Abstract
Studies of skeletal muscle disuse, either in patients on bed rest or experimentally in animals (immobilization), have demonstrated that decreased protein synthesis is common, with transient parallel increases in protein degradation. Muscle disuse atrophy involves a process of transition from slow to fast myosin fiber types. A shift toward glycolysis, decreased capacity for fat oxidation, and substrate accumulation in atrophied muscles have been reported, as has accommodation of the liver with an increased gluconeogenic capacity. Recent studies have modeled skeletal muscle disuse by using cyclic stretch of differentiated myotubes (C2C12), which mimics the loading pattern of mature skeletal muscle, followed by cessation of stretch. We utilized this model to determine the metabolic changes using non-targeted metabolomics analysis of the media. We identified increases in amino acids resulting from protein degradation (largely sarcomere) that occurs with muscle atrophy that are involved in feeding the Kreb’s cycle through anaplerosis. Specifically, we identified increased alanine/proline metabolism (significantly elevated proline, alanine, glutamine, and asparagine) and increased α-ketoglutaric acid, the proposed Kreb’s cycle intermediate being fed by the alanine/proline metabolic anaplerotic mechanism. Additionally, several unique pathways not clearly delineated in previous studies of muscle unloading were seen, including: 1) elevated keto-acids derived from branched chain amino aicds (i.e. 2-ketoleucine and 2-keovaline), which feed into a metabolic pathway supplying acetyl-CoA and 2-hydroxybutyrate (also significantly increased); and 2) elevated guanine, an intermediate of purine metabolism, was seen at 12 hours unloading. Given the interest in targeting different aspects of the ubiquitin proteasome system to inhibit protein degradation, this C2C12 system may allow the identification of direct and indirect alterations in metabolism due to anaplerosis or through other yet to be identified mechanisms using a non-targeted metabolomics approach.
Keywords: C2C12, biaxial stretch, atrophy, hypertrophy regression, metabolomics, anaplerosis
1. Introduction
Recovery from injury and illness can cause extended periods of muscle disuse and/or unloading resulting in rapid skeletal muscle atrophy and loss of functional strength1–3. The extent of muscle loss that occurs during illness is an important predictor of hospitalization duration and need for rehabilitation4. The resulting decline in functional capacity and strength, decline in basal metabolic rate, and onset of insulin resistance reported to be some of the sequelae in humans5. Since the signs of muscle disuse atrophy occurs rapidly, understanding the short term alterations that occur may help us better appreciate their contribution to sarcopenia and elucidate ways in which to counteract the particularly fast and severe consequences that result.
Studies of skeletal muscle disuse either in patients on bed rest or experimentally in animals (immobilization) have demonstrated that decreased protein synthesis is common, with transient parallel increases in protein degradation (as recently reviewed5). Muscle disuse atrophy involves a process of transition from slow to fast myosin fiber types6. A shift toward glycolysis, decreased capacity for fat oxidation, and substrate accumulation in atrophied muscles have been reported, as has accommodation of the liver with an increased gluconeogenic capacity6. These alterations in glycolysis appear to regulate more than carbohydrate metabolism7.
Recent studies have modeled skeletal muscle disuse by using cyclic stretch of differentiated myotubes (C2C12), which mimics the loading pattern of mature skeletal muscle, followed by cessation of stretch8. The resulting atrophy mimicked disuse atrophy and allowed investigation of the underlying mechanisms. In the current study, we sought to more broadly identify the metabolic changes that occur acutely in differentiated muscle cells using a non-targeted metabolomics approach of both cells and media in vitro. While we identified previously reported effects on glucose utilization, a host of previously undescribed alterations in protein metabolism was found and offers insight into the mechanisms underlying acute skeletal muscle disuse atrophy that may be targeted therapeutically in the future.
2.0 Materials and Methods
2.1 C2C12 plating and differentiation on FlexCell plates
The C2C12 mouse myoblast cell line (ATCC, CRL-1772) was plated at 30–50% confluence onto six-well BioFlex® culture plates (BF-3001, Flexcell International Corporation, Hillsborough, NC) coated with Collagen type I. Myoblasts were grown to 80% confluence in DMEM (4500 mg/L glucose) with 20% FBS, then differentiated to myotubes by changing media to DMEM with 2% horse serum supplemented with insulin (1 microM final), as previously described9–11. Cells were plated were then allowed to quiesce in DMEM (25 mM glucose) without media for 24 hours before stretch stimulus was applied to quiesce the cells, as previously described in the context of cardiomyocyte-induced hypertrophy by IGF-1 and thyroid hormone in vitro12,13.
2.2 Biomechanical stretch of differentiated C2C12 cells
Differentiated C2C12 cells were either stretched at 15% biaxial stretch for 6 hours using the Flexcell® FX-5000™ Compression System (Flexcell International Corporation, Hillsborough, NC), or used as controls (non-stretched) and incubated in parallel to experimental cells without stretch (non-stretched cells). The stretched differentiated C2C12 cells were then unloaded by stopping the stretch and allowing the cells to incubate for another 12 hours. Media was collected at baseline, or after 6 hours of stretch, and 1, 3, 6, and 12 hours after the cessation of stretch. Replicate control samples and cells undergoing cessation of stretch were maintained under static conditions with no applied cyclic strain. In parallel, second experimental group of differentiated C2C12 cells were stimulated with 10% FBS for 6 hours to induce hypertrophy (experimental controls were incubated in parallel without FBS).
2.3 Imaging and cell surface area determinations
Cultured myotubes were viewed and imaged using a Zeiss inverted microscope (Axiovert 200, Oberkochen, Germany). Three digital images per culture were captured. The images were analyzed for myotube length, diameter and area using ImageJ imaging software (NIH) as previously described8.
2.4 Non-targeted metabolomics analysis
Collection of samples (spent media) from all 6 wells was performed, and samples were placed on dry ice/stored at −80°C. Samples were then analyzed by GC/MS, as previously described14. The raw, transformed, and sorted data used for each of the three comparisons in the metabolomics analyses can be found in Supplemental Table 1. Up to 1 missing value per group was imputed using lowest value in the same group, with groups missing 2 or more excluded from the analysis. All data used in this analysis has been archived in the UCSD Metabolomics Workbench (http://www.metabolomicsworkbench.org/), accession #(Pending Assignment).
2.5 Metabolomic statistical analyses
Metaboanalyst (v3.0) run on the statistical package R (v2.14.0) used metabolite peaks areas (as representative of concentration)19,20. Data were first normalized to a pooled average sample from their control and scaled using Pareto scaling feature, and then analyzed to calculate fold change using Metaboanalyst fold change feature. Unsupervised principal component analysis (PCA) was performed next, which identified the effect of stretch cessation as the principal source of variance. The metabolites that best differentiated the groups were then individually tested using univariate analysis of individual component by t-test (Metaboanalyst v 3.0), and then the t-test and VIP significant metabolites were matched to metabolomics pathways using the Pathway Analysis and enrichment analysis features in Metaboanalyst 3.0. In addition, a Pairwise One-Way Analysis of Variance (ANOVA) and Fisher LSD post-hoc were conducted among all groups at different time points using Metaboanalyst v3.0 to delineate the changes induced by stretch and cessation. Only metabolites identified and detected in all groups were included in the One-Way ANOVA. If two or more values of each metabolite were missing in a given group, the entire metabolite was removed from the analysis. Data used in this study are available in Supplemental Table 1. Heat maps were generated using the GENE-E software (http://www.broadinstitute.org/cancer/software/GENE-E/index.html). All data is shown as mean +/− standard error of the mean (SEM), unless otherwise indicated.
3.0 Results
Using differentiated C2C12 myotubes seeded at the same time with equal numbers of cells, we cyclically stretched cells (15% at 60 cycles/min) for 6 hours, then stopped the stretch and collected media at 1, 3, 6, and 12 hours post-stretch. Media from the same cells were collected just before and 6 hours post-stretch (indicated by 0 h) was analyzed using non-targeted metabolomics (Figure 1A). Compared to non-stretch controls, C2C12 cells significantly increased in cross-sectional are after 6 hours (Figure 1B). Stretch cessation resulted in a significant reduction in myocyte area within 3 hours (Figure 1B), which continued to decrease at 6 and 12 hours, respectively. To discover the alterations that occurred metabolically in these myocytes, we analyzed the media in the stretch cells and compared it to non-stretched cells in vitro, investigating each of the five times analyzed (6 hours stretch, and 1, 3, 6, and 12 hours post-stretch cessation).
Figure 1. Stretch-induced C2C12 hypertrophy and reversal model.
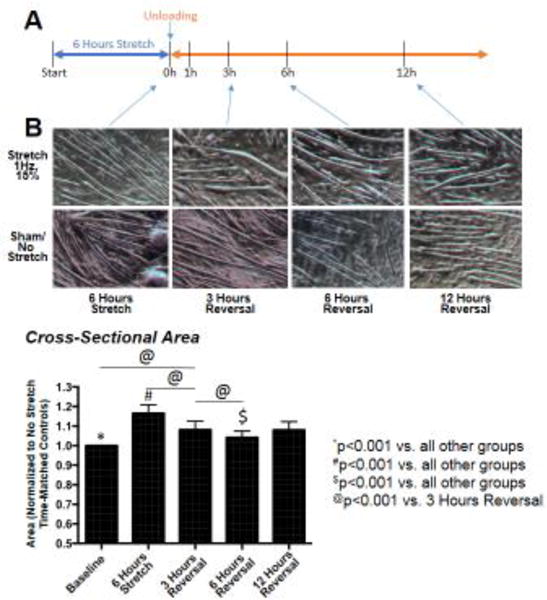
A. Experimental design using differentiated C2C12 in the absence of serum. B. Photomicrographs of control time-matched sham and stretch/reversal cells (N=3/group). C. Quantification of cross-section area of differentiated C2C12 cells normalized to sham / no stretch controls (N=80-100 cells/group, indicated in bars as stretch cell # / control cell # included in cross-sectional area counts). A One-Way ANOVA followed by Holm-Sidak pairwise post-hoc all pairwise analysis was performed to compare cell size over time.
Using non-targeted metabolomics analysis, we compared the metabolites found in control no-stretch cell media to cells stretched for 6 hours without serum (Figure 2). We identified eighty-two metabolites (of 110 substances peaks recorded)(Figure 2A). Of the 82 metabolites named, 12 were significantly different from non-stretch controls by t-test (Figure 2B). By category, stretch affected arginine/proline metabolism and starch/sucrose metabolism (Figure 2C). We identified 84 metabolites in serum-stimulated C2C12 cells (Supplemental Figure 1A), with 32 of them significantly different from parallel controls (Supplemental Figure 1B). Like stretch-induced hypertrophy, serum-stimulated C2C12 cells showed significant alterations in protein biosynthesis and alanine metabolic pathway as the most enriched pathways and lowest p-value (Supplemental Figure 1). Twelve (12) significantly altered metabolites were found in the stretch challenged C2C12 cells compared to thirty-two (32) in the serum-induced after 6 hours illustrate the many differences in these stimuli as well, including citrate cycle, arginine/proline metabolism, and glycine/serine/threonine metabolic pathways identified (Supplemental Figure 1). Pathway enrichment analysis of the 6 hours stretch and 6-hour serum significant metabolites illustrate the similarities between the two, including “protein biosynthesis” and “alanine metabolism” having the lowest p values, while citric acid cycle changes were unique to the serum-stimulated pathway (Supplemental Figure 2).
Figure 2. Non-targeted metabolomics of C2C12 myotube media with no serum, after 6 hours of stretch, compared to serum free media of non-stretched C2C12 myotubes after 0-1-3-6 hours of no stretch (one replicate each).
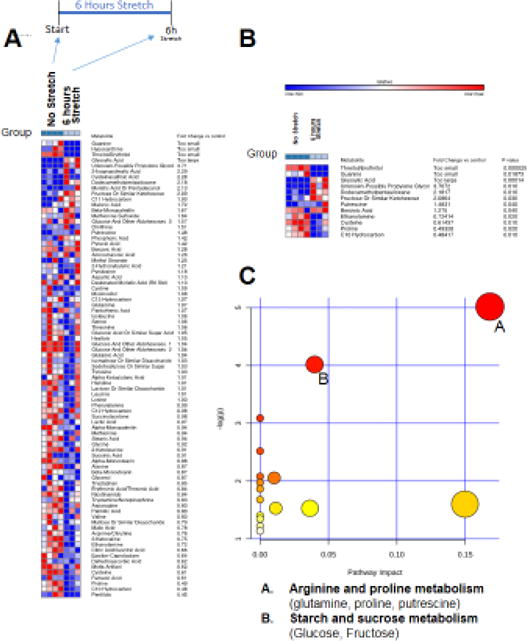
A. Heat map of metabolites identified by non-targeted GC/MS analysis. B. T-test significant metabolites with fold change and p-values. C. Pathway analysis of T-test significant metabolites, N=3 (6 hours stretch), N=4 (no stretch controls).
After identifying the metabolic alterations that occurred with stretch, we next determined the metabolic changes at 1, 3, 6, and 12 hours after (Figures 3–6). After 1 hour, three metabolites were significantly different between groups (of 83 metabolites identified from 191 substance peaks recorded)(Figure 3A and 3B), involving starch and sucrose metabolism (Figure 3C). Similarly, after 3 hours of stretch cessation, nine metabolites were significantly different between groups (from 87 metabolites identified from 197 substances peaks recorded)(Figure 4A and 4B), also involving aminoacyl-tRNA biosynthesis (Figure 4C). At 6 hours of stretch cessation, 16 metabolites were significantly different between groups (of 86 metabolites identified from 196 substances peaks recorded)(Figure 5A and 5B), involving valine/leucine/isoleucine biosynthesis, pyruvate metabolism, and aminoacyl-tRNA biosynthesis (Figure 5C). By 12 hours of stretch cessation, 30 metabolites were significantly different (of 80 metabolites identified from 193 substances peaks recorded)(Figure 6A and 6B), involving primarily intermediate metabolism (alanine/aspartate, and glutamate metabolism, citrate cycle, and nitrogen metabolism)(Figure 6C).
Figure 3. Non-targeted metabolomics of media from C2C12 stretched myotubes with no serum, after 1 hour of unloading (post 6 hours stretch) compared to media from C2C12 myotubes after 6 hours of stretch.
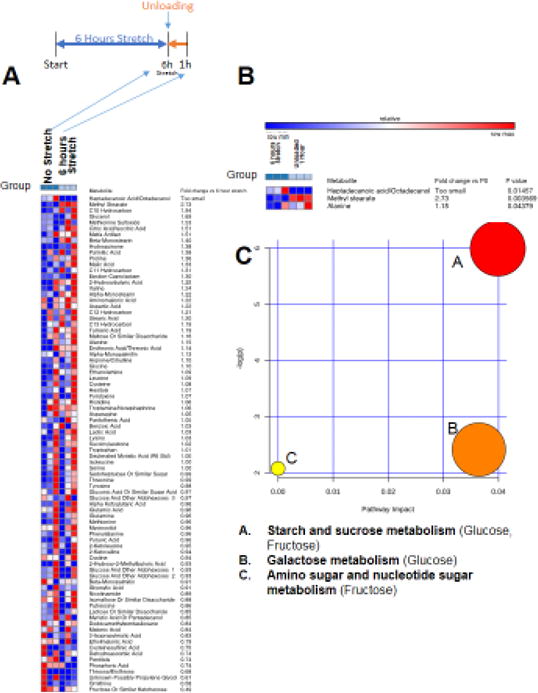
A. Heat map of metabolites identified by non-targeted GC/MS analysis. B. T-test significant metabolites with fold change and p-values. C. Pathway analysis of T-test significant metabolites, N=3/group.
Figure 6. Non-targeted metabolomics of media from C2C12 stretched myotubes with no serum, after 12 hours of unloading (post 6 hours stretch) compared to media from C2C12 myotubes after 6 hours of stretch.
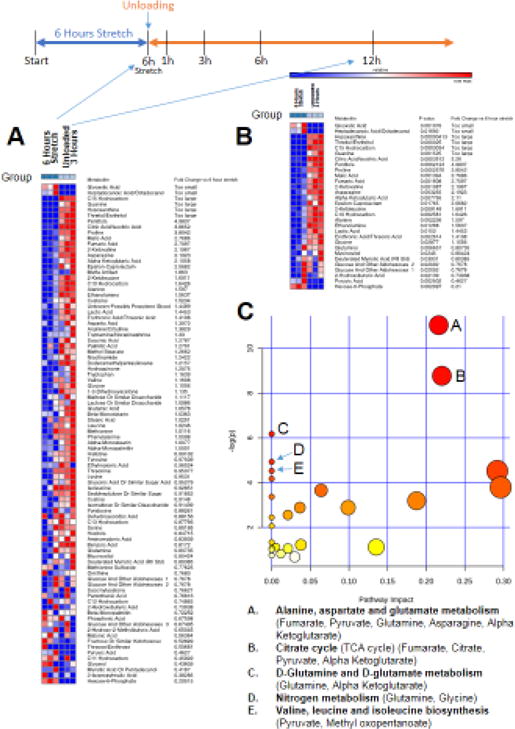
A. Heat map of metabolites identified by non-targeted GC/MS analysis. B. T-test significant metabolites with fold change and p-values. C. Pathway analysis of T-test significant metabolites, N=3/group.
Figure 4. Non-targeted metabolomics of media from C2C12 stretched myotubes with no serum, after 3 hours of unloading (post 6 hours stretch) compared to media from C2C12 myotubes after 6 hours of stretch.
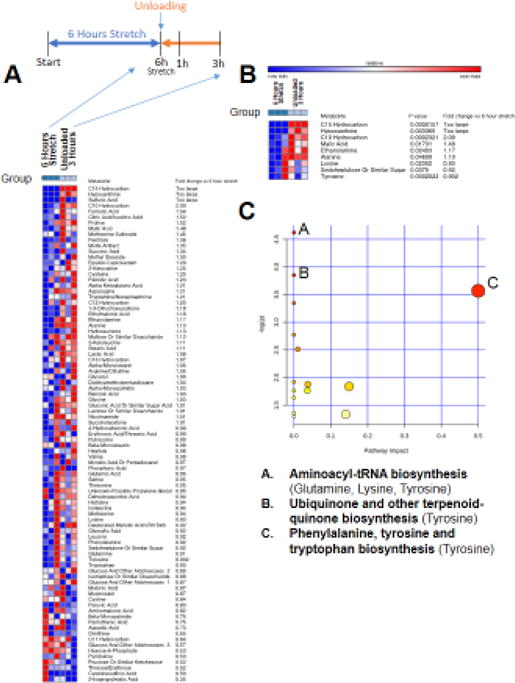
A. Heat map of metabolites identified by non-targeted GC/MS analysis. B. T-test significant metabolites with fold change and p-values. C. Pathway analysis of T-test significant metabolites, N=3/group.
Figure 5. Non-targeted metabolomics of media from C2C12 stretched myotubes with no serum, after 6 hours of unloading (post 6 hours stretch) compared to media from C2C12 myotubes after 6 hours of stretch.
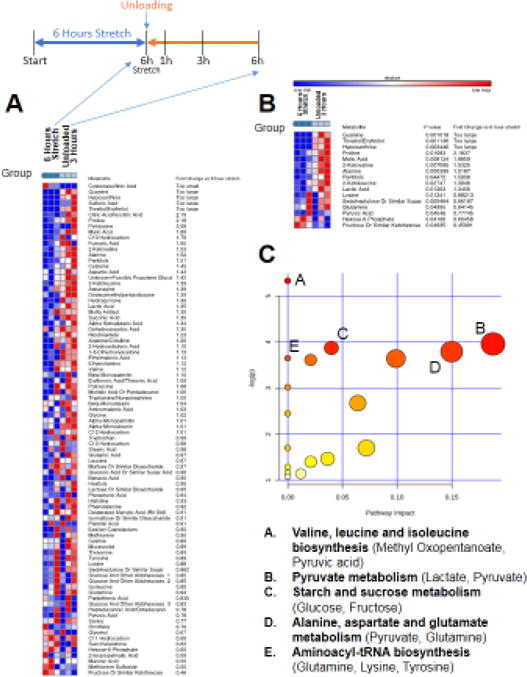
A. Heat map of metabolites identified by non-targeted GC/MS analysis. B. T-test significant metabolites with fold change and p-values. C. Pathway analysis of T-test significant metabolites, N=3/group.
To summarize the dynamic metabolic alterations throughout the entire experiment, a One-Way ANOVA was performed on all the metabolites at each time point compared to the 6 hours stretch (0 hr) time point (Figure 7, Figure 8, Supplemental Figure 3, Supplemental Figure 4). The metabolic process affected most prominently by ANOVA analysis is the Kreb’s Cycle (Figure 7). Since glucose uptake occurs in response to stretch, we followed media glucose levels as it was an identified metabolites found throughout. Glucose levels did not significantly change throughout the time course (Supplemental Figure 5). Significant increases in lactic acid, citric acid, α-ketoglutaric acid, and malate were identified and significantly increased by 12 hours of stretch cessation and hypertrophy reversal (see inset plots). Both ANOVA and t-tests identified decreases in pyruvate, complementing the analysis performed in Figure 6, investigating the significant alterations by t-test at the 12-hour stretch cessation compared to the 6-hour hypertrophy time point (0 Hr), indicated in blue and red. In addition to the ANOVA significant findings, fumarate was found to be decreased 3.5 fold (Figure 7).
Figure 7. T-test and ANOVA significant changes in the Kreb’s Cycle intermediates from C2C12 stretched myotube media after 12 hours of unloading (post 6 hours stretch) compared to no stretch time-matched controls.
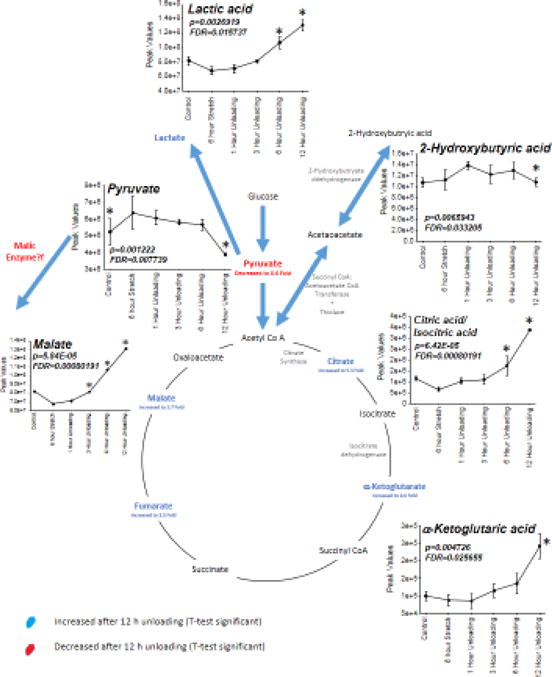
T-test significant alterations indicated in either red (decreased) or blue (increased) with ANOVA significant alterations indicated by inset graph of changes over time.
Figure 8. T-test and ANOVA significant changes in glutamine and citrulline metabolism in C2C12 stretched myotube media after 12 hours of unloading (post 6 hours stretch) compared to no stretch time-matched controls.
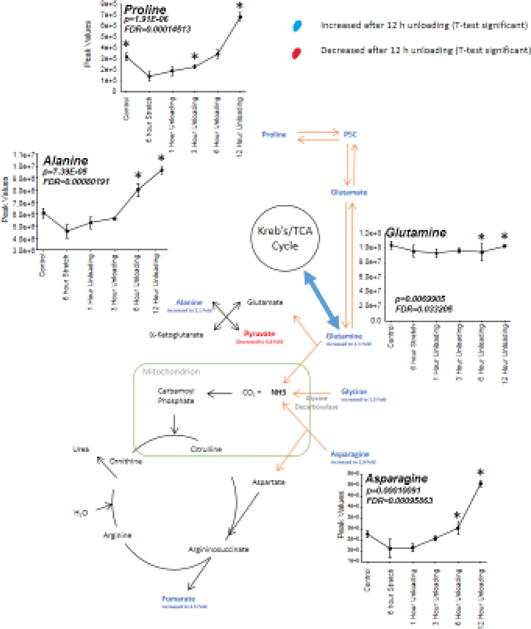
T-test significant alterations indicated in either red (decreased) or blue (increased) with ANOVA significant alterations indicated by inset graph of changes over time. Glutamine/proline metabolism pathways adapted from Bertolo and Burrin, 200842. *p<0.05 vs. 6-hour stretch time point.
One-way ANOVA performed on all the time points revealed alterations in alanine and proline metabolism (Figure 8). As adjacent pathways to the Kreb’s cycle, increases in proline, alanine, glutamine, and asparagine were increased with the cessation of stretch by 3–12 hours (Figure 8, see inset graphs). In addition to the ANOVA significant metabolites, the 12 hours t-test identified glutamate and glycine reduced (see metabolites in blue, Figure 8). Lastly, ANOVA significant metabolites were also identified in purine metabolism (Supplemental Figure 3A), branched chain amino acid synthesis (Supplemental Figure 3B), phospholipid metabolism (Supplemental Figure 3C), and in pathways not clearly delineated, including sugar alcohols identified as pentitols and hexitols (Supplemental Figure 4).
4.0 Discussion
Recent studies have demonstrated that cyclic stretch of differentiated C2C12 myotubes for as little as 1 hour per day (12% at 0.7 Hz) increases myocyte size in as little as two days8. To streamline this model, we found that in preliminary studies that stretching cells similarly (15% at 1.0 Hz) could induce myocyte growth in 6 hours, which became the basis for the present study. Cyclic stretch of C2C12 myotubes induces the release IGF-1 and AngII, which act as autocrine/paracrine stimulators of IGF-18 and Angiotensin II15 signaling on the C2C12 cells themselves, inducing an increase in cell size. As myocyte hypertrophy represents the increase in newly synthesized sarcomeres, the significance of the observed IGF-1 induced protein synthesis (evidenced by increased p-Akt and p-GSK3beta, respectively) is clear. Conversely, cessation of stretch reproducibly causes a loss of myocyte mass8, involving the proteasome-dependent degradation of sarcomere proteins that involves both the ubiquitin-proteasome system and calpain enzymes16,17. The myocyte-specific ubiquitin ligases MuRF1 and MAFbx mediate muscle atrophy18, recognizing and ubiquitinating sarcomere proteins, then targeted for proteasome-dependent degradation19. Atrophy in C2C12 myotubes can be inhibited by blocking the proteasome20 or by blocking ubiquitination to prevent atrophy in C2C12 myotubes16. Recent studies have identified that activating calpain enzymes serve to induce the ubiquitin-proteasome pathway, thereby acting in concerted to degrade sarcomere proteins during atrophy21.
The induction of anaplerosis in atrophy is an important compensatory mechanism by which amino acids feed the TCA cycle to generate energy. The link between atrophy and anaplerosis is logical, given the tremendous sarcomere protein degradation that occurs, freeing peptides and amino acids used for energy. In addition to the structural changes that occur with muscle unloading and atrophy, recent studies have identified an intricate link between skeletal muscle mass regulation and energy metabolism22. Conceptually, this link lies in the well-established increase in net protein degradation that produces an increase in amino acids5,7,23. During the development and progression of colorectal cancer, tumor-bearing animals experienced decreases in pyruvate kinase (PKM1) and pyruvate kinase activity but were unexpectedly able to maintain energy7. These studies revealed that an increase in autophagy supported the loss of muscle mass and increased amino acid production, including increased glutamine7. Through a well-known process of anaplerosis that occurs in skeletal muscle, glutaminase can change glutamine to glutamate, whereby glutamate dehydrogenase can create the α-ketoglutaric acid intermediate to feed the TCA cycle24,25. During the progression of skeletal muscle atrophy due to cancer, increases in glutamine were thought to be the main mechanism by which ATP levels were maintained in the presence of decreased pyruvate kinase activity7. In the present study, we expand this evidence to demonstrate increases in alanine/proline metabolism (significantly elevated proline, alanine, glutamine, and asparagine, (Figure 8) and increased α-ketoglutaric acid, the proposed intermediate (Figure 7) being fed by the alanine/proline metabolic anaplerotic mechanism. Lastly, the anaplerotic pathway shunting pyruvate to malate has been described as a potential anaplerotic mechanism in skeletal muscle through the malic enzyme26. While it has not clearly been described to our knowledge in unloading, it may be at work in the present model to describe the elevated malate seen after unloading (Figure 7).
In addition to the anaplerotic mechanism feeding α-ketoglutaric acid seen with C2C12 unloading, we identified several unique pathways not clearly delineated in previous studies of muscle unloading. The CDP-ethanolamine pathway has been described to regulate skeletal muscle diacylglycerol content and mitochondrial biogenesis27. The drug clenbuterol is an ethanolamine that has been used to treat skeletal muscle atrophy, including dexamethasone-induced muscle atrophy28, denervated skeletal muscle29, and in treating humans with spinal and bulbar muscular atrophy for a 12 month trial30. These studies indicate that the ethanolamine clenbuterol protects skeletal muscle loss by antagonizing Akt/mTOR and by increasing polyamines (putrescine, spermidine, and spermine), which are repressed in muscle atrophy31–33. The presence of elevated ethanolamine may represent novel endogenous pathways involved in the recovery of atrophy (Supplemental Figure 3C). Significantly increased concentration of the keto-acids derived from branched chain amino acids (i.e. 2-ketoleucine and 2-keovaline) were identified after unloading (Supplemental Figure 3B) and have been described as intermediates in the Ehrlich amino acid degradation pathway. These keto-acids derived from branched chain amino acids feed into a metabolic pathway supplying acetyl-CoA and 2-hydroxybutyrate (also significantly increased, Figure 7). Since the keto-amino acids are further reacted in this pathway to make higher alcohols, it is possible that the generic sugar alcohols may be related to this process (Supplemental Figure 4A). While the elevation of amino acids during skeletal muscle atrophy is well known34, the keto-acids derived from branched chain amino acids seen here have not previously been described specifically. Lastly, elevated guanine was seen at 12 hours unloading, which previously was undetectable at multiple time points (Supplemental Figure 3A). While guanine is an intermediate in purine metabolism, its role in unloading remodeling has not been described to our knowledge in the literature previously.
Metabolomic analysis of cell culture can involve extracellular (footprint) and intracellular (fingerprint) metabolic profiles. One advantage of metabolic footprinting is the ability to assay serially, as in the present study, to allow identification of changes over time in the same cell culture system. Footprinting of B-lymphocytes into Ig secreting plasma cells using supernatants identified the consumption of glucose, glutamine, and other essential amino acids35. 5′-methylthioadenosine (5′MTA) was produced and released during the activation phase, while the second phase of differentiation corresponded to deoxycytidine release35. Changes in extracellular metabolites correlated with the known biochemical pathway changes reported previously35. The secretome footprinting of cancer cells has similarly shown parallels between the metabolites secreted and the underlying biology of the cells releasing these metaoblites36. Specifically, identification of isoleucine, α-aminoadipic acid (AADA), and γ-amino-N-butyric acid (GABA) in media were accurate biomarkers of c-Myc, KLF4, and Oct1 variable expression, with modulation of these markers indicative of changes in the underlying biology of the tumor36. The reason for the parallel metabolic mirroring of the footprint with the intracellular (fingerprint) in these studies is not addressed directly in these studies.
One potential mechanism that may explain the parallel metabolomics profiles seen in extracellular media and cells alike may be exosome-like vesicles (ELV)37. Small molecule profiling from ELVs isolated from cell culture media has recently demonstrated to be much more dynamic. The rich metabolome that was found included glycerophospholipids/sphingolipids, peptides, cyclic alcohols, fatty acid esters/amides, alcohols, sugars, steroids, amino acids/conjugates, nucleotides, and organic acids in cell culture media from exosome-like vesicles found in the media37. While we did not isolate ELVs from media in the present study, this finding demonstrates that the diversity of metabolites we did identify have been reported in media ELVs as a source. The transport and movement of these diverse metabolites are not well described but are different enough that multiple mechanisms, including those outside of ELVs not previously described, may similarly be involved.
A limitation of this study is the limited fatty acids available to the differentiated C2C12 cells during the stretch phase and subsequent hypertrophy reversal. C2C12 cells have the ability to take up and oxidize fatty acids for energy production and have the ability to store fats as triglycerides as well38. Adequate supplementation of fatty acids complexed to albumin was available in the serum used to proliferate and differentiate these cells. DMEM with 10% fetal bovine serum was used to induce proliferation of C2C12 myoblasts; the media was then replaced with DMEM with 2% horse serum to induce differentiation. However, the stretch studies were then performed in the absence of serum as serum is a potent inducer of hypertrophic growth (containing IGF-1, Angiotensin II, and thyroid hormone, among other pro-hypertrophic constituents8,15; see serum-induced hypertrophic controls, Supplemental Figure 1). While fatty acids were not directly added to the media via serum for these reasons, fatty acids were identified in the media by our present analysis. Specifically, palmitic acid, alpha-Monopalmitin, and/or Beta-Monopalmitin were found at each time found (Supplemental Table 1). Recent studies have demonstrated that the essential fatty acids linoleic acid (LA) and alpha-linolenic acid (ALA) themselves can improve glucose uptake in C2C12 cells made insulin resistant using palmitic acid39, making the balance between fatty acids and glucose critically important when modeling myocytes in vitro.
5.0 Conclusions
Cessation of biaxial stretch in C2C12 myotubes in culture resulted in a reduction in cross-sectional area over 12 hours, paralleling some metabolic changes using non-targeted metabolomics analysis of the media. Using a One-Way ANOVA analysis comparing the cessation time point, increases in amino acids were identified, resulting from the protein degradation (largely sarcomere) that occurs with muscle atrophy. Increases in alanine/proline metabolism (significantly elevated proline, alanine, glutamine, and asparagine) and increased α-ketoglutaric acid, the proposed intermediate being fed by the alanine/proline metabolic anaplerotic mechanism were identified. Additionally, several unique pathways not clearly delineated in previous studies of muscle unloading were seen, including: 1) elevated keto-acids derived from branched chain amino acids (i.e. 2-ketoleucine and 2-keovaline), which feed into a metabolic pathway supplying acetyl-CoA and 2-hydroxybutyrate (also significantly increased); and 2) elevated guanine, an intermediate of purine metabolism, was seen at 12 hours unloading. Given the interest in targeting different aspects of the ubiquitin-proteasome system to inhibit protein degradation18,40,41, this C2C12 system may allow the identification of direct and indirect alterations in metabolism due to anaplerosis or through other yet to be identified mechanisms using a non-targeted metabolomics approach.
Supplementary Material
Acknowledgments
This work was supported by the National Institutes of Health (R01HL104129 to M.W.), the Jefferson-Pilot Corporation (Fellowship to M.W.), and the Leducq Foundation Transatlantic Networks of Excellence (to M.W.).
Non-standard abbreviations
- PKM1
pyruvate kinase
- TCA cycle
tri-carboxylic acid cycle
Footnotes
Publisher's Disclaimer: This is a PDF file of an unedited manuscript that has been accepted for publication. As a service to our customers we are providing this early version of the manuscript. The manuscript will undergo copyediting, typesetting, and review of the resulting proof before it is published in its final citable form. Please note that during the production process errors may be discovered which could affect the content, and all legal disclaimers that apply to the journal pertain.
Conflict of interest
The authors declare that they have no conflict of interest.
Compliance with Ethical Standards
All applicable international, national, and/or institutional guidelines for the care and use of animals were followed.
References
- 1.Deitrick JE. The effect of immobilization on metabolic and physiological functions of normal men. Bull N Y Acad Med. 1948;24(6):364–375. [PMC free article] [PubMed] [Google Scholar]
- 2.Gibson JN, Halliday D, Morrison WL, et al. Decrease in human quadriceps muscle protein turnover consequent upon leg immobilization. Clin Sci (Lond) 1987;72(4):503–509. doi: 10.1042/cs0720503. [DOI] [PubMed] [Google Scholar]
- 3.Ingemann-Hansen T, Halkjaer-Kristensen J. Computerized tomographic determination of human thigh components. The effects of immobilization in plaster and subsequent physical training. Scand J Rehabil Med. 1980;12(1):27–31. [PubMed] [Google Scholar]
- 4.Christensen T, Bendix T, Kehlet H. Fatigue and cardiorespiratory function following abdominal surgery. Br J Surg. 1982;69(7):417–419. doi: 10.1002/bjs.1800690721. [DOI] [PubMed] [Google Scholar]
- 5.Wall BT, Dirks ML, van Loon LJ. Skeletal muscle atrophy during short-term disuse: implications for age-related sarcopenia. Ageing Res Rev. 2013;12(4):898–906. doi: 10.1016/j.arr.2013.07.003. [DOI] [PubMed] [Google Scholar]
- 6.Stein TP, Wade CE. Metabolic consequences of muscle disuse atrophy. J Nutr. 2005;135(7):1824S–1828S. doi: 10.1093/jn/135.7.1824S. [DOI] [PubMed] [Google Scholar]
- 7.Luo Y, Yoneda J, Ohmori H, et al. Cancer usurps skeletal muscle as an energy repository. Cancer Res. 2014;74(1):330–340. doi: 10.1158/0008-5472.CAN-13-1052. [DOI] [PubMed] [Google Scholar]
- 8.Soltow QA, Zeanah EH, Lira VA, Criswell DS. Cessation of cyclic stretch induces atrophy of C2C12 myotubes. Biochem Biophys Res Commun. 2013;434(2):316–321. doi: 10.1016/j.bbrc.2013.03.048. [DOI] [PubMed] [Google Scholar]
- 9.Yaffe D, Saxel O. Serial passaging and differentiation of myogenic cells isolated from dystrophic mouse muscle. Nature. 1977;270(5639):725–727. doi: 10.1038/270725a0. [DOI] [PubMed] [Google Scholar]
- 10.Casas-Delucchi CS, Brero A, Rahn HP, et al. Histone acetylation controls the inactive X chromosome replication dynamics. Nat Commun. 2011;2:222. doi: 10.1038/ncomms1218. [DOI] [PMC free article] [PubMed] [Google Scholar]
- 11.Blau HM, Pavlath GK, Hardeman EC, et al. Plasticity of the differentiated state. Science. 1985;230(4727):758–766. doi: 10.1126/science.2414846. [DOI] [PubMed] [Google Scholar]
- 12.Wadosky KM, Rodriguez JE, Hite RL, Min JN, Walton BL, Willis MS. Muscle RING finger-1 attenuates IGF-I-dependent cardiomyocyte hypertrophy by inhibiting JNK signaling. Am J Physiol Endocrinol Metab. 2014;306(7):E723–739. doi: 10.1152/ajpendo.00326.2013. [DOI] [PMC free article] [PubMed] [Google Scholar]
- 13.Wadosky KM, Berthiaume J, Tang W, et al. MuRF1 mono-ubiquitinates TRalpha to inhibit T3 induced cardiac hypertrophy in vivo. J Mol Endocrinol. 2016 doi: 10.1530/JME-15-0283. [DOI] [PMC free article] [PubMed] [Google Scholar]
- 14.Banerjee R, Bultman SJ, Holley D, et al. Non-targeted metabolomics of double-mutant cardiomyocytes reveals a novel role for SWI/SNF complexes in metabolic homeostasis. Metabolomics. 2015;11(5):1287–1301. doi: 10.1007/s11306-015-0786-7. [DOI] [PMC free article] [PubMed] [Google Scholar]
- 15.Johnston AP, Baker J, De Lisio M, Parise G. Skeletal muscle myoblasts possess a stretch-responsive local angiotensin signalling system. J Renin Angiotensin Aldosterone Syst. 2011;12(2):75–84. doi: 10.1177/1470320310381795. [DOI] [PubMed] [Google Scholar]
- 16.Kawai N, Hirasaka K, Maeda T, et al. Prevention of skeletal muscle atrophy in vitro using anti-ubiquitination oligopeptide carried by atelocollagen. Biochim Biophys Acta. 2015;1853(5):873–880. doi: 10.1016/j.bbamcr.2015.01.024. [DOI] [PubMed] [Google Scholar]
- 17.Salazar JJ, Michele DE, Brooks SV. Inhibition of calpain prevents muscle weakness and disruption of sarcomere structure during hindlimb suspension. J Appl Physiol (1985) 2010;108(1):120–127. doi: 10.1152/japplphysiol.01080.2009. [DOI] [PMC free article] [PubMed] [Google Scholar]
- 18.Bodine SC, Latres E, Baumhueter S, et al. Identification of ubiquitin ligases required for skeletal muscle atrophy. Science. 2001;294(5547):1704–1708. doi: 10.1126/science.1065874. [DOI] [PubMed] [Google Scholar]
- 19.Willis MS, Patterson C. Into the heart: the emerging role of the ubiquitin-proteasome system. J Mol Cell Cardiol. 2006;41(4):567–579. doi: 10.1016/j.yjmcc.2006.07.015. [DOI] [PubMed] [Google Scholar]
- 20.Polge C, Heng AE, Jarzaguet M, et al. Muscle actin is polyubiquitinylated in vitro and in vivo and targeted for breakdown by the E3 ligase MuRF1. FASEB J. 2011;25(11):3790–3802. doi: 10.1096/fj.11-180968. [DOI] [PubMed] [Google Scholar]
- 21.Kramerova I, Kudryashova E, Venkatraman G, Spencer MJ. Calpain 3 participates in sarcomere remodeling by acting upstream of the ubiquitin-proteasome pathway. Hum Mol Genet. 2005;14(15):2125–2134. doi: 10.1093/hmg/ddi217. [DOI] [PubMed] [Google Scholar]
- 22.Koopman R, Ly CH, Ryall JG. A metabolic link to skeletal muscle wasting and regeneration. Front Physiol. 2014;5:32. doi: 10.3389/fphys.2014.00032. [DOI] [PMC free article] [PubMed] [Google Scholar]
- 23.Kachaeva EV, Shenkman BS. Various jobs of proteolytic enzymes in skeletal muscle during unloading: facts and speculations. J Biomed Biotechnol. 2012;2012:493618. doi: 10.1155/2012/493618. [DOI] [PMC free article] [PubMed] [Google Scholar]
- 24.Gibala MJ, Young ME, Taegtmeyer H. Anaplerosis of the citric acid cycle: role in energy metabolism of heart and skeletal muscle. Acta Physiol Scand. 2000;168(4):657–665. doi: 10.1046/j.1365-201x.2000.00717.x. [DOI] [PubMed] [Google Scholar]
- 25.Gupte AA, Hamilton DJ, Cordero-Reyes AM, et al. Mechanical unloading promotes myocardial energy recovery in human heart failure. Circ Cardiovasc Genet. 2014;7(3):266–276. doi: 10.1161/CIRCGENETICS.113.000404. [DOI] [PMC free article] [PubMed] [Google Scholar]
- 26.Gibala MJ. Regulation of skeletal muscle amino acid metabolism during exercise. Int J Sport Nutr Exerc Metab. 2001;11(1):87–108. doi: 10.1123/ijsnem.11.1.87. [DOI] [PubMed] [Google Scholar]
- 27.Selathurai A, Kowalski GM, Burch ML, et al. The CDP-Ethanolamine Pathway Regulates Skeletal Muscle Diacylglycerol Content and Mitochondrial Biogenesis without Altering Insulin Sensitivity. Cell Metab. 2015;21(5):718–730. doi: 10.1016/j.cmet.2015.04.001. [DOI] [PubMed] [Google Scholar]
- 28.Umeki D, Ohnuki Y, Mototani Y, et al. Protective Effects of Clenbuterol against Dexamethasone-Induced Masseter Muscle Atrophy and Myosin Heavy Chain Transition. PLoS One. 2015;10(6):e0128263. doi: 10.1371/journal.pone.0128263. [DOI] [PMC free article] [PubMed] [Google Scholar]
- 29.Goncalves DA, Silveira WA, Lira EC, et al. Clenbuterol suppresses proteasomal and lysosomal proteolysis and atrophy-related genes in denervated rat soleus muscles independently of Akt. Am J Physiol Endocrinol Metab. 2012;302(1):E123–133. doi: 10.1152/ajpendo.00188.2011. [DOI] [PubMed] [Google Scholar]
- 30.Querin G, D’Ascenzo C, Peterle E, et al. Pilot trial of clenbuterol in spinal and bulbar muscular atrophy. Neurology. 2013;80(23):2095–2098. doi: 10.1212/WNL.0b013e318295d766. [DOI] [PubMed] [Google Scholar]
- 31.Bongers KS, Fox DK, Kunkel SD, et al. Spermine oxidase maintains basal skeletal muscle gene expression and fiber size and is strongly repressed by conditions that cause skeletal muscle atrophy. Am J Physiol Endocrinol Metab. 2015;308(2):E144–158. doi: 10.1152/ajpendo.00472.2014. [DOI] [PMC free article] [PubMed] [Google Scholar]
- 32.Szathmary I, Selmeci L, Szobor A, Molnar J. Altered polyamine levels in skeletal muscle of patients with myasthenia gravis. Clin Neuropathol. 1994;13(4):181–184. [PubMed] [Google Scholar]
- 33.Abukhalaf IK, von Deutsch DA, Wineski LE, et al. Effect of hindlimb suspension and clenbuterol treatment on polyamine levels in skeletal muscle. Pharmacology. 2002;65(3):145–154. doi: 10.1159/000058041. [DOI] [PubMed] [Google Scholar]
- 34.Schakman O, Kalista S, Barbe C, Loumaye A, Thissen JP. Glucocorticoid-induced skeletal muscle atrophy. Int J Biochem Cell Biol. 2013;45(10):2163–2172. doi: 10.1016/j.biocel.2013.05.036. [DOI] [PubMed] [Google Scholar]
- 35.Garcia-Manteiga JM, Mari S, Godejohann M, et al. Metabolomics of B to plasma cell differentiation. J Proteome Res. 2011;10(9):4165–4176. doi: 10.1021/pr200328f. [DOI] [PubMed] [Google Scholar]
- 36.Bellance N, Pabst L, Allen G, Rossignol R, Nagrath D. Oncosecretomics coupled to bioenergetics identifies alpha-amino adipic acid, isoleucine and GABA as potential biomarkers of cancer: Differential expression of c-Myc, Oct1 and KLF4 coordinates metabolic changes. Biochim Biophys Acta. 2012;1817(11):2060–2071. doi: 10.1016/j.bbabio.2012.07.004. [DOI] [PubMed] [Google Scholar]
- 37.Altadill T, Campoy I, Lanau L, et al. Enabling Metabolomics Based Biomarker Discovery Studies Using Molecular Phenotyping of Exosome-Like Vesicles. PLoS One. 2016;11(3):e0151339. doi: 10.1371/journal.pone.0151339. [DOI] [PMC free article] [PubMed] [Google Scholar]
- 38.Bastie CC, Hajri T, Drover VA, Grimaldi PA, Abumrad NA. CD36 in myocytes channels fatty acids to a lipase-accessible triglyceride pool that is related to cell lipid and insulin responsiveness. Diabetes. 2004;53(9):2209–2216. doi: 10.2337/diabetes.53.9.2209. [DOI] [PubMed] [Google Scholar]
- 39.Park SY, Kim MH, Ahn JH, et al. The Stimulatory Effect of Essential Fatty Acids on Glucose Uptake Involves Both Akt and AMPK Activation in C2C12 Skeletal Muscle Cells. Korean J Physiol Pharmacol. 2014;18(3):255–261. doi: 10.4196/kjpp.2014.18.3.255. [DOI] [PMC free article] [PubMed] [Google Scholar]
- 40.Jagoe RT, Goldberg AL. What do we really know about the ubiquitin-proteasome pathway in muscle atrophy? Curr Opin Clin Nutr Metab Care. 2001;4(3):183–190. doi: 10.1097/00075197-200105000-00003. [DOI] [PubMed] [Google Scholar]
- 41.Smith IJ, Lecker SH, Hasselgren PO. Calpain activity and muscle wasting in sepsis. Am J Physiol Endocrinol Metab. 2008;295(4):E762–771. doi: 10.1152/ajpendo.90226.2008. [DOI] [PMC free article] [PubMed] [Google Scholar]
- 42.Bertolo RF, Burrin DG. Comparative aspects of tissue glutamine and proline metabolism. J Nutr. 2008;138(10):2032S–2039S. doi: 10.1093/jn/138.10.2032S. [DOI] [PubMed] [Google Scholar]
Associated Data
This section collects any data citations, data availability statements, or supplementary materials included in this article.


