

Summary
Aim and methods
Different types of insults to the CNS lead to axon demyelination. Remyelination occurs when the CNS attempts to recover from myelin loss and requires the activation of oligodendrocyte precursor cells. With the rationale that CB1 receptor is expressed in oligodendrocytes and marijuana consumption alters CNS myelination, we study the effects of the cannabinoid agonist WIN55212.2 in (1) an in vitro model of oligodendrocyte differentiation and (2) the cuprizone model for demyelination.
Results
The synthetic cannabinoid agonist WIN55212.2 at 1 μM increased the myelin basic protein mRNA and protein expression in vitro. During cuprizone‐induced acute demyelination, the administration of 0.5 mg/kg WIN55212.2 confers more myelinated axons, increased the expression of retinoid X receptor alpha, and declined nogo receptor expression. Controversially, 1 mg/kg of the drug increased the number of demyelinated axons and reduced the expression of nerve growth factor inducible, calreticulin and myelin‐related genes coupling specifically with a decrease in 2′,3′‐cyclic nucleotide 3′ phosphodiesterase expression.
Conclusion
The cannabinoid agonist WIN55212.2 promotes oligodendrocyte differentiation in vitro. Moreover, 0.5 mg/kg of the drug confers neuroprotection during cuprizone‐induced demyelination, while 1 mg/kg aggravates the demyelination process.
Keywords: Cuprizone, Demyelination, Endocannabinoid system, Neuroprotection, Oligodendrocyte
Introduction
Understanding how different populations of neurons develop, integrate, and function as a whole has direct impact for the etiology of neurological disorders. Neurons represent a major cell type in the central nervous system (CNS) and are critically associated with glial cells in the formation of effective synapses which provide communication in a timely manner 1. Oligodendrocytes are a type of glial cells that wrapped axons in the CNS to produce large amounts of myelin sheath 1. Myelin sheath isolates the axon and promotes the action potentials propagation 2. Some types of injuries to the CNS drive axonal demyelination and cause severe disorders such as multiple sclerosis, neuropathies, myelopathies, and leukodystrophies. One of the most crucial steps in remyelination is the stimulation of oligodendrocyte precursor cells (OPCs), which progress across several stages from immature to mature oligodendrocytes 1. The cuprizone (CPZ) mouse model allows the investigation of the complex molecular mechanisms behind non‐autoimmune‐mediated demyelination. Matsushima and Morell 3 determined that C57BL/6 mice fed with 0.2% CPZ‐supplemented diet for 4–6 weeks displayed acute demyelinating lesions followed by spontaneous remyelination.
By activating cannabinoid receptors, Gomez et al. 4 reported a markedly oligodendrocyte differentiation in vitro. The effects of cannabinoids are classically associated with CB1 and CB2 receptors. These receptors are key components of the endocannabinoid system as well as the endogenous cannabinoids ligands, their carriers, and synthetic/degrading enzymes 5. CB1 receptor is highly expressed in the brain 6 and it is essential for several behaviors including anxiety and fear responses (for review, see 7). The most important endogenous ligands for cannabinoid receptors are N‐arachidonylethanolamine (AEA) 8 and 2‐arachidonoylglycerol (2‐AG) 9. N‐Arachidonoylphospatidylethanolamine phospholipase D (Napepld) is the central enzyme responsible for the synthesis of AEA, while 2‐AG is mainly produced by diacylglycerol lipase (Dagla) in the adult brain as described 10. After the activation of cannabinoid receptors, AEA and 2‐AG are removed from the synaptic cleft and hydrolyzed by the action of fatty acid amide hydrolase (Faah) and monoacylglycerol lipase (Magl), respectively 11.
With the rationale that CB1 receptor is expressed in oligodendrocytes 4 and marijuana consumption alters CNS myelination 12, 13, we directed the present study to evaluate the effects of the cannabinoid CB1/CB2 agonist WIN55212.2 in (1) an in vitro model of oligodendrocyte differentiation and (2) the murine model of demyelination by cuprizone.
Materials and Methods
A total of 90 C57Bl6/J male mice at the age of 7–8 weeks were obtained from Charles River Laboratories (Germany). After arrival, the animals were housed 5 mice per cage and maintained under standard conditions (12‐h light/dark cycle with 6:00/18:00 lights on/off, room temperature of 21 ± 2°C, and food and water ad libitum). Procedures performed on mice were in accordance with NIH guidelines for the use of animals in research and the European Communities Council Directive (86/609/EEC).
HOG16 Oligodendrocyte In Vitro Model
The cell line HOG16 was obtained from Eucellbank (University of Barcelona, Spain) in agreement with Dr. G. Dawson (University of Chicago, USA). Oligodendrocytes were cultured in standard medium containing high‐glucose Dulbecco's modified Eagle medium (Invitrogen Ltd., Warrington, UK) complemented with 10% fetal bovine serum (HyClone, Logan, UT, USA), the antibiotics penicillin (50 U/mL) and streptomycin (50 μg/mL) (Invitrogen Ltd., UK) at fully humidified atmosphere incubator at 37°C and 5% CO2. To induce differentiation, cells were exposed to differentiation medium that contained 0.05% FBS, 30 nM triiodothyronine (T3), 30 nM selenium, 0.5 μg/mL insulin (all from Sigma–Aldrich, Munich, Germany), 50 μg/mL transferrin (US Biological, Salem, MA, USA), and the antibiotics used above 14. The effect of 1 μM WIN55212.2 (WIN) (Sigma–Aldrich) was tested under both conditions according to Bologov et al., 15. Cells grew with standard medium and when they reached 50% confluency were divided into two groups. One of them remained with standard medium, and in the other one, the medium was replaced by differentiation medium. After 24 h, the cells were subjected to lysis buffer or fixed. Quantitative RT‐PCR was performed in triplicate wells and in three independent experiments. Immunohistochemistry was carried out in a Lab‐Tek II Chamber Slide System (Nunc, Roskilde, Denmark). Figure 1(A) shows a schematic drawing of the experiment.
Figure 1.
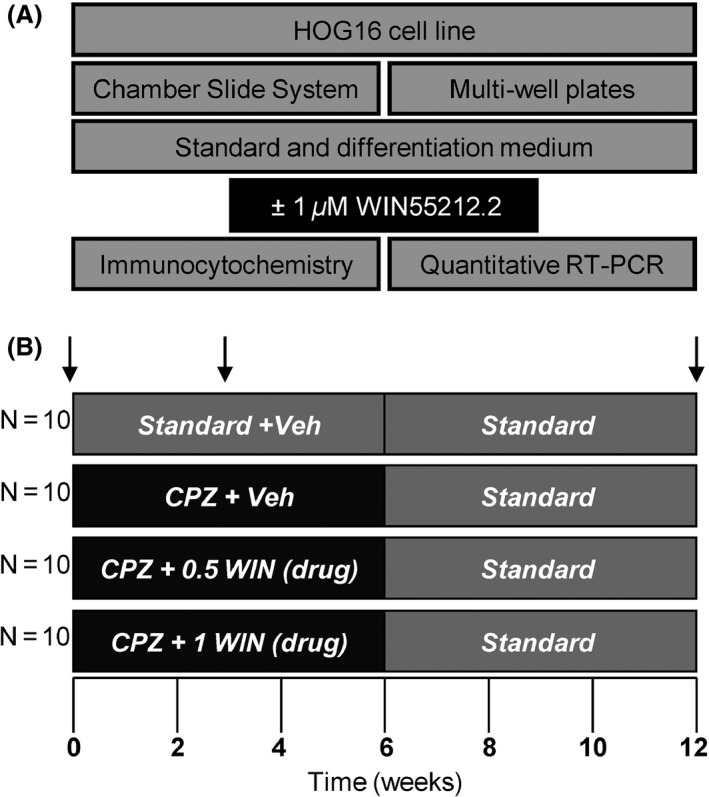
Schematic drawing of the experiment. (A) The human oligodendroglial cell line HOG16 was cultured in standard medium, and when they reached 50% confluency, cells were subjected to differentiation medium according to Bologov et al., 15. The effect of 1 μM cannabinoid agonist WIN was tested under both conditions. (B) C57Bl6/J male mice at 8 weeks of age were divided into control groups fed with a regular diet for 0, 3, and 12 weeks (controls) or those mice that received a diet supplemented with 0.2% CPZ for 3 and 6 weeks (treated). In parallel, mice fed with CPZ were single daily injected with WIN (drug) or phosphate‐buffered saline (vehicle). After 0, 3, and 12 weeks, mice were evaluated by behavioral testing, and finally, they were sacrificed as indicated vertical arrows.
Immunocytochemistry on Cell Culture
The cells were washed in phosphate‐buffered saline (PBS), fixed in 2% paraformaldehyde (PFA) for 30 min, permeabilized with 0.05% Triton X‐100 for 30 min, washed in PBS, and incubated overnight at 4°C in PBS with anti‐CB1 receptor antibody (ab23703, dilution 1:300; Abcam, Bristol, UK) and anti‐MBP antibody (250746, dilution 1:250; Abbiotec, Aachen, Germany). Next day, after washing the cells with PBS, they were incubated for 30 min with goat anti‐rabbit DyLight488‐labeled secondary antibody (46402, dilution 1:300; Thermo Scientific, Karlsruhe, Germany), and finally, the excess of secondary antibody was eluted washing with PBS 14. Cells were analyzed under a fluorescence microscope (Olympus light microscope BX51, Hamburg, Germany) equipped with a camera and filters that allow excitation at 495/10 nm, and labeled structures were digitally photographed using ×100 magnification.
The Cuprizone Murine Model
Mice received regular diet for 0, 3, and 12 weeks (controls) or were fed with 0.2% CPZ for 3 and 6 weeks (treated). In the recovery group, animals were fed with CPZ for 6 weeks, followed by a recovery period of 6 weeks with regular diet. In parallel to CPZ feeding, mice were intraperitoneally injected with WIN or phosphate‐buffered saline (vehicle) once per day. WIN was dissolved in 10% DMSO (Sigma–Aldrich), 0.1% Tween 80 (Sigma–Aldrich) in 0.9% saline and prepared freshly every day. The same volume of WIN (drug) or phosphate‐buffered saline (vehicle) (200 μL) was applied i.p. The drug was administered at 0.5 or 1 mg/kg. At certain time points (at 3 and 12 weeks), mice were evaluated by testing the baseline startle response and prepulse inhibition (PPI). After behavioral testing, mice were deeply anesthetized by intraperitoneal injection of 2,2,2‐tribromoethanol (Sigma‐Aldrich, Germany) and transcardially perfused with cold PBS. From one half of the brain, the corpus callosum was dissected and collected for RNA analysis. The other half of the brain was fixed with 4% PFA and processed later for EPON embedding. We selected this brain region because it is mainly affected in this model 3. Although this approach is not ideal for the electron microscopy sample preparation, we have chosen this experimental design to be able to perform RNA and morphological analysis on same brain tissue. Figure 1(B) shows a schematic drawing of the experiment.
Startle response and Prepulse Inhibition (PPI)
An experimental session consisted of a 3‐min habituation to 65 dB background white noise (continuously during the session), followed by a baseline recording for 2 min. Startle reflexes were resulted from an acoustic stimuli. The startle reaction to an acoustic stimulus evoked a movement of the platform which was recorded during a frame time of 100 ms (the onset of the acoustic stimulus) and stored for further analysis. For prepulse inhibition tests, the 120‐dB startle pulse of 40‐ms duration was applied either alone or preceded by a nonstartling prepulse stimulus of 70‐, 75‐, or 80‐dB intensity and 20‐ms duration. An interval of 100 ms with background white noise was used between each prepulse and pulse stimulus. Ten trials of each type were displayed in a randomly order with intertrial intervals ranging from 8 to 22 seconds. The amplitude of the startle response (AUs) during recording frame time was determined as the maximum force displayed during a reaction to 120‐dB acoustic stimulus. Maximum amplitudes were averaged individually, separately for all types of trials as described 16.
RNA Isolation
The corpus callosum from each of the CPZ‐exposed and controls was sonicated with a blender in RNase‐free lysis buffer (Applied Biosystems, Carlsbad, CA, USA). Cell cultures were stopped by removing the medium and adding RNase‐free lysis buffer (Applied Biosystems, USA). Samples were kept for 1 h at 4°C. Total RNA was isolated using the TRIzol protocol (Invitrogen Ltd., Darmstadt, Germany). The RNA was digested with RNase‐free DNase (Qiagen, Valencia, CA, USA) and checked for integrity by electrophoresis (Bioanalyzer; Agilent Technologies, Santa Clara, CA, USA). N = 5 mice/group.
Electron Microscopy
As described above, mice were deeply anesthetized and transcardially perfused with PBS; half of the brain was dissected and immersion‐fixed in 4% PFA and stored at 4°C. Later, the brains were postfixed with 4% formaldehyde (Serva, Heidelberg, Germany), 2.5% glutaraldehyde (Science Services, Munich, Germany), and 0.5% NaCl in phosphate buffer pH 7.4 17. Finally, the corpus callosum was postfixed with 2% OsO4 (Science Services) in 0.1 M phosphate buffer pH 7.3 and embedded in EPON (Serva) after dehydration with ethanol and propylene oxide. EPON blocks with embedded tissue were then trimmed, using a Leica EM TRIM (Leica, Vienna, Austria), to the size of the corpus callosum. In the following, ultrathin sections were stained with an aqueous solution of 4% uranyl acetate followed by lead citrate 18. The pictures were taken in an unbiased random fashion with a Zeiss EM900 electron microscope (Zeiss, Oberkochen, Germany) using a side‐mounted 2k CCD camera (TRS, Waakirchen, Germany). Counting of myelinated and demyelinated axons was performed using NIH ImageJ software (National Institutes of Health, Bethesda, MD, USA); a total area of 10*784 μm2 = 7840 μm2 was analyzed per mouse and every axon counted. The g ratio was calculated as the ratio between the number of demyelinated axons and the number of myelinated axons. Counting was performed on groups of n = 5 mice.
Focused Gene Signature Profiling
The prognostic 35‐gene signature was implemented in the digital transcript counting (nCounter) assay (NanoString) 19. Total RNA (200–400 ng) was assayed according to the manufacturer's instructions. Data were standardized by scaling with geometric mean of built‐in control gene probes after log transformation (base 2) for each sample. Genes for testing were chosen according to the following criteria: myelin, cannabinoid, corpus callosum connectivity, and psychiatric disorders‐related genes. Probe sets for each gene were designed and synthesized by NanoString nCounter™ technologies (Seattle, WA, USA) (Table S1). N = 5 mice/group.
Statistical Analysis
Statistical significance was evaluated by two‐way ANOVA, and a Bonferroni post hoc test was used when appropriate. Significance values were set to P < 0.05. In all figures and text, data are represented as mean ± SEM. Significant effects were identified using Statistica (StatSoft Software, Tulsa, OK, USA).
Results
HOG16 Oligodendrocyte Model
Cells were differentiated from immature oligodendrocytes into a more mature phenotype, that is, cells that were able to synthesize myelin proteins. These cells were grown in standard medium (SM) and differentiation medium (DM) supplemented with 1 μM of WIN, respectively (Figure 1A). Fluorescent immunocytochemistry showed a morphological change associated with differentiation. Cells changed from a round shape (Figure 2A, i‐ii, v‐vi) to a stellated shape (Figure 2A, iii‐iv, vii‐viii). The drug also increased the amount of myelin basic protein (MBP) under both SM and DM shown by immunofluorescence staining (Figure 2A, v, vii). The amount of CB1 receptor increased in those cells cultured with standard medium supplemented with WIN (Figure 2A, vi). Mbp and the cannabinoid CB1 receptor (Cnr1) gene expression were further analyzed by quantitative RT‐PCR (Figure 2B). In brief, the cannabinoid agonist WIN promoted the expression of Mbp under either SM or DM (P < 0.05; P < 0.001, respectively) (Figure 2B). Cells cultured in differentiation medium supplemented with WIN increased Mbp expression when compared with those cells grown in standard medium combined with WIN (P < 0.01) (Figure 2B). Moreover, CB1 receptor mRNA expression increased under SM with WIN (P < 0.05) as depicted in Figure 2B.
Figure 2.
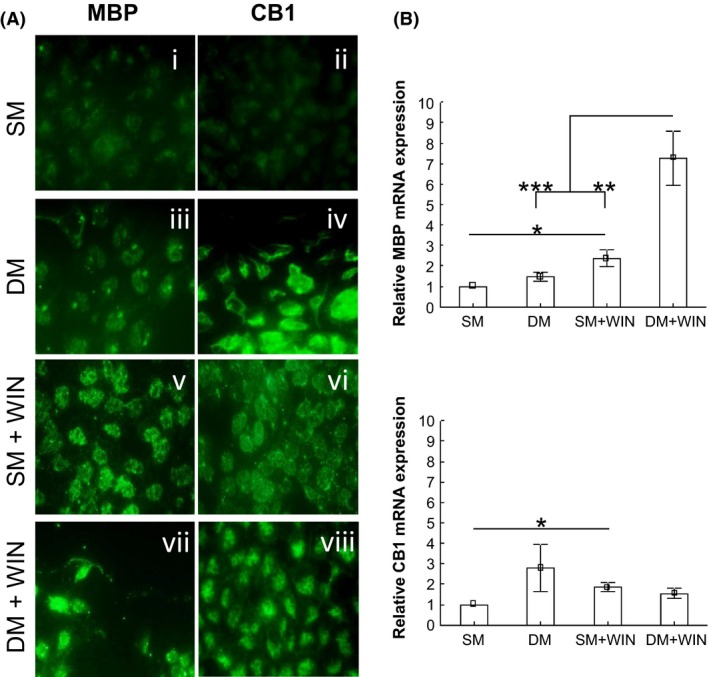
HOG16 oligodendrocyte in vitro model. Cells were differentiated from immature oligodendrocytes to a more mature phenotype, that is, cells that were able to synthesize myelin proteins. These cells were grown in both standard medium (SM) and differentiation medium (DM) supplemented with 1 μM of the cannabinoid CB1/CB2 agonist WIN. (A) Fluorescent immunocytochemistry showed a morphological change associated with the differentiation process. Cells changed from a round shape (i‐ii, v‐vi) to a stellated shape (iii‐iv, vii‐viii). The cannabinoid agonist WIN increased myelin basic protein expression under both SM and DM (v, vii). The CB1 receptor protein expression increased in those cells cultured with standard medium supplemented with WIN (vi). (B) The cannabinoid agonist WIN promoted the expression of Mbp under both SM and DM (P < 0.05; P < 0.001, respectively). Cells cultured in differentiation medium supplemented with WIN increased Mbp when compared with those cells grown in standard medium enriched with WIN (P < 0.01). Finally, CB1 receptor mRNA increased in SM supplemented with WIN (P < 0.05). Data are expressed as mean ± SEM. P values were set as follows: *P < 0.05, **P < 0.01, and ***P < 0.001. N = 3. SM, standard medium; DM, differentiation medium; Mbp, myelin basic protein; Cnr1, cannabinoid receptor 1.
The Cuprizone Murine Model
Startle Response and Prepulse Inhibition (PPI)
Mice exposed to CPZ for 3 weeks displayed no changes in the startle response (Figure 3i). However, we measured an increase in PPI 70 dB in CPZ‐fed mice treated with 0.5 mg/kg of WIN when compared with both control and CPZ alone (P < 0.05) (Figure 3ii). In addition, CPZ‐fed mice treated with 0.5 mg/kg of WIN displayed higher PPI 75 dB than CPZ alone (P < 0.05) (Figure 3iii). Mice exposed to CPZ alone shower lower score of PPI 80 dB in contrast to control and CPZ‐fed mice subjected to either 0.5 or 1 mg/kg of WIN (P < 0.05) (Figure 3iv). In contrast, no significant differences were found in the recovery group (data not shown).
Figure 3.
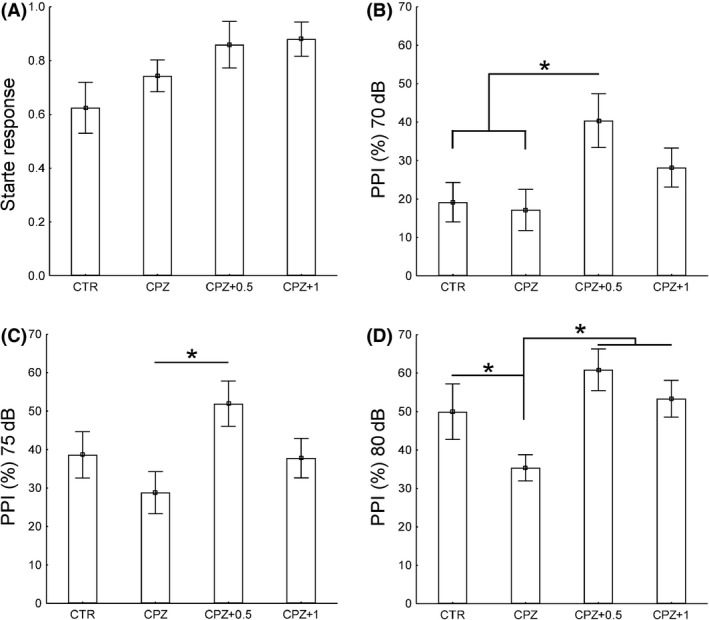
Startle response and prepulse inhibition (PPI) during the acute demyelination. We measured an increase in PPI 70 dB in CPZ‐fed mice treated with 0.5 mg/kg of WIN when compared with either control or CPZ alone (P < 0.05) (ii). In addition, CPZ‐fed mice treated with 0.5 mg/kg of WIN displayed higher PPI 75 dB than CPZ alone (P < 0.05) (iii). Mice exposed to CPZ alone declined PPI 80 dB in contrast to control and CPZ‐fed mice subjected to either 0.5 or 1 mg/kg of WIN (P < 0.05) (iv). Data are expressed as mean ± SEM. P values were set as follows: * P < 0.05, ** P < 0.01, and *** P < 0.001. N = 10. CTR, control animals fed with standard diet and treated with phosphate‐buffered saline; CPZ, cuprizone‐fed animals; WIN, WIN55212.2.
Methylene Blue/Azure II Staining and Electron Microscopy
Ultrastructural analysis of the corpus callosum revealed a clear demyelination after 3 weeks of CPZ alone (P < 0.001) (Figure 4A, ii; B, ii; C), while CPZ‐fed mice subjected to 0.5 mg/kg of WIN showed a lower g ratio than those fed with CPZ and acutely treated with vehicle buffer (P < 0.001) (Figure 4B, iii; C). In contrast, the administration of 1 mg/kg of WIN in CPZ‐fed mice induced the maximum demyelination as indicated the g ratio when compared with either controls (P < 0.001), CPZ alone (P < 0.001), or CPZ treated with 0.5 mg/kg of WIN (P < 0.001) (Figure 4B, iv; C). However, no significant differences concerning the g ratio are reported in the recovery group (Figure 4C).
Figure 4.
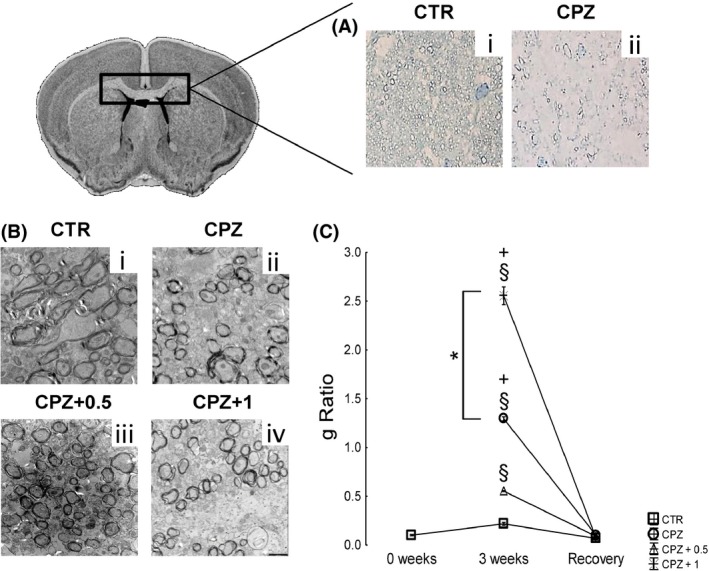
The corpus callosum cytoarchitecture. Ultrastructural analysis of the corpus callosum revealed a clear demyelination after 3 weeks of CPZ alone (P < 0.001) (A‐ii, B‐ii, C), while CPZ‐fed mice subjected to 0.5 mg/kg of WIN showed a lower g ratio than those fed with CPZ and acutely treated with vehicle buffer (P < 0.001) (B‐iii, C). In contrast, the administration of 1 mg/kg of WIN in CPZ‐fed mice induced the maximum demyelination as indicated the g ratio when compared with either controls (P < 0.001), CPZ alone (P < 0.001), or CPZ treated with 0.5 mg/kg of WIN (P < 0.001) (B‐iv, C). However, no significant differences concerning the g ratio are reported in the recovery group (C). Data are expressed as mean ± SEM. An § indicates significant differences between CPZ‐fed groups and their respective control group. CPZ intragroup comparisons between vehicle and drug‐treated mice are indicated by an +. Otherwise underlined * indicated comparisons between CPZ‐fed treated with 0.5 and those treated with 1 mg/kg. P values were set at P < 0.001. N = 5. CTR, control animals fed with standard diet and treated with phosphate‐buffered saline; CPZ, cuprizone‐fed animals; WIN, WIN55212.2.
Focused Gene Signature Profiling
The results are summarized in Table 1 according to the gene expression profile data depicted in Figure S1 (3 weeks) and Figure S2 (12 weeks).
Table 1.
Summary of gene expression analysis
| Time (weeks) | Comparison | Upregulated | Downregulated | ||
|---|---|---|---|---|---|
| Gene | P value | Gene | P value | ||
| 3 | CPZ versus CTR |
ApoE Rxra |
<0.01**
<0.05* |
Mbp Mog Mag Napepld |
<0.01**
<0.05* <0.05* <0.05* |
| CPZ+0.5 versus CTR |
ApoE Rxra |
<0.001***
<0.01** |
NogoR Mog Mbp Mag Satb2 Napepld Dagla Vgf |
<0.001***
<0.01** <0.01** <0.01** <0.01** <0.01** <0.05* <0.05* |
|
| CPZ+1 versus CTR | ApoE | <0.001*** |
NogoR Napepld Mog Mag Mbp Cnp Vgf Satb2 Calr |
<0.001***
<0.01** <0.01** <0.01** <0.01** <0.05* <0.05* <0.05* <0.05* |
|
| CPZ+1 versus CPZ+0.5 | Ski | <0.01** | NS | ||
| 12 | CPZ+0.5 versus CPZ | NS |
Mag Olig2 |
<0.05*
<0.05* |
|
| CPZ+1 versus CPZ | Dtnbp1 | <0.05* |
Olig2 Sox10 Mag Calr Ddr1 |
<0.05*
<0.05* <0.05* <0.05* <0.05* |
|
| CPZ+1 versus CPZ+0.5 | Dtnbp1 | <0.05* | Olig2 | <0.05* | |
Time = 3: apolipoprotein E (ApoE) expression increased following CPZ alone (P < 0.01) and in combination with either 0.5 or 1 mg/kg of WIN (P < 0.001). Moreover, the expression of myelin oligodendrocyte glycoprotein (Mog), myelin basic protein (Mbp), and myelin‐associated glycoprotein (Mag) declined following cuprizone alone (P < 0.05) or in combination with either 0.5 or 1 mg/kg of WIN (P < 0.01). Animals exposed to CPZ diet and treated with either 0.5 or 1 mg/kg of WIN exhibited lower expression of Nogo receptor (Ngr1) (P < 0.001), special AT‐rich sequence‐binding protein 2 (Satb2) (P < 0.01; P < 0.05, respectively), and nerve growth factor inducible (Vgf) (P < 0.05). In addition, the administration of 1 mg/kg WIN in CPZ‐fed animals decreased specifically the expression of 2′,3′‐cyclic nucleotide 3′ phosphodiesterase (Cnp) and also does calreticulin (Calr) (P < 0.05). Time = 12: the expression of Mag and Olig2 decreased following CPZ feeding and 0.5 mg/kg of WIN in contrast to CPZ alone (P < 0.05). The recovery group exposed to 1 mg/kg WIN showed lower Olig2, Sox10, Mag, Calr, and discoidin domain receptor 1 (Ddr1) expression in comparison with CPZ alone (P < 0.05). Furthermore, the expression of Olig2 decreased in CPZ‐fed mice treated with 1 mg/kg of WIN when compared with those mice treated with 0.5 mg/kg of WIN (P < 0.05). The remaining comparisons are depicted in the table.
P values were set as follows: NS (P > 0.05), *P < 0.05, **P < 0.01, and ***P < 0.001. N = 5. CTR, control animals fed with standard diet and treated with phosphate‐buffered saline; CPZ, cuprizone‐fed animals.
During the acute demyelination, apolipoprotein E (ApoE) expression increased following both CPZ alone (P < 0.01) and CPZ combined with either 0.5 or 1 mg/kg of WIN (P < 0.001) when compared with their respective controls as depicted in Table 1. The administration of cuprizone increased the expression of retinoid × receptor alpha (Rxra) in mice exposed to vehicle (CPZ alone) as well as in combination with 0.5 mg/kg of WIN (P < 0.01) (Table 1). Moreover, the expression of myelin oligodendrocyte glycoprotein (Mog), myelin basic protein (Mbp), myelin‐associated glycoprotein (Mag), and N‐acyl phosphatidylethanolamine phospholipase D (Napepld) declined following cuprizone alone (P < 0.05) or in combination with either 0.5 or 1 mg/kg of WIN (P < 0.01) (Table 1). Animals exposed to CPZ diet and treated with either 0.5 or 1 mg/kg of WIN exhibited lower expression of nogo receptor (Ngr1) (P < 0.001), special AT‐rich sequence‐binding protein 2 (Satb2) (P < 0.01; P < 0.05, respectively), and nerve growth factor inducible (Vgf) (P < 0.05) than controls (Table 1). Daily injection with 0.5 mg/kg of WIN in CPZ‐fed mice decreased the expression of diacylglycerol lipase alpha (Dagla) in contrast to controls (P < 0.05) (Table 1). In addition, the administration of 1 mg/kg WIN in CPZ‐fed animals reduced the expression of 2′,3′‐cyclic nucleotide 3′ phosphodiesterase (Cnp) and also does calreticulin (Calr) (P < 0.05) (Table 1). CPZ‐fed mice subjected to 1 mg/kg of WIN displayed higher Ski protooncogene (Ski) expression than those mice treated with 0.5 mg/kg of WIN (P < 0.01) (Table 1).
After a recovery period of 6 weeks following cuprizone dietary, dystrobrevin binding protein 1 (Dtnbp1) expression was higher in mice treated with 1 mg/kg of WIN when compared with either CPZ alone or CPZ combined with 0.5 mg/kg of WIN (P < 0.05) (Table 1). Furthermore, Mag and oligodendrocyte transcription factor (Olig2) expression were downregulated following CPZ feeding and 0.5 mg/kg of WIN in contrast to CPZ alone (P < 0.05) (Table 1). The recovery group exposed to 1 mg/kg of WIN showed lower Olig2, Mag, SRY‐Box 10 (Sox10), Calr, and discoidin domain receptor 1 (Ddr1) expression in comparison with CPZ alone (P < 0.05) (Table 1). In addition, the expression of Olig2 decreased in CPZ‐fed mice treated with 1 mg/kg of WIN when compared with those animals treated with 0.5 mg/kg of WIN (P < 0.05) (Table 1).
Discussion
After confirming the presence of CB1 receptor in a cultured oligodendrocyte cell line, we also proved that the synthetic cannabinoid agonist WIN exerted a strong effect on immature oligodendrocytes resulting in increased MBP levels 24 h once the differentiation process started, in agreement with Gomez et al. 4. This fact encouraged us to investigate the effect of WIN in a well‐described mouse model of demyelination, the cuprizone model 3. Here, we focused our study on the acute demyelination and the recovery period.
Acute Demyelination
CPZ‐fed mice exhibited PPI deficits that were reversed by 0.5 mg/kg of WIN. Despite this, Xu et al. 20 reported that mice exposed to CPZ for 3 weeks displayed lower prepulse inhibition as well as higher dopamine levels 20. Overactivation of dopaminergic system in the forebrain correlates with PPI deficits in humans 21 and also in animals 20. The cannabinoids are actively involved in dopamine release in the prefrontal cortex 22. Furthermore, ultrastructural analysis of the corpus callosum revealed more myelinated axons following 3 weeks of CPZ diet combined with 0.5 mg/kg, but not in those mice treated with 1 mg/kg. In fact, many studies have demonstrated either therapeutic or deleterious effects of cannabinoids on the viability of various cell types (for review, see 23 that might be attributable to blockage or stimulation of calcium entry into the cell, which in turn depends on cannabinoid concentration 24.
In neurodegenerative processes, CNS cholesterol synthesis is compromised. ApoE plays an important role in CNS cholesterol and lipid metabolism 25. Therefore, the dysregulation of the endocannabinoid system has been associated with ApoE activity 26. Recent reports suggest that demyelination in experimental allergic encephalomyelitis (EAE) is related to an increase in ApoE 25, which supports the present findings. In addition, retinoid acids (rxrs) are essential for cholesterol metabolism 27, 28 and stimulate oligodendrocyte differentiation 29. Interestingly, we found that 0.5 mg/kg of WIN during CPZ exposure increased the expression of Rxra which might protect myelinated axons against cuprizone. In contrast, the drug at 1 mg/kg aggravates CNS demyelination as indicated ultrastructural and gene expression analysis. Particularly, CPZ‐fed animals subjected to 1 mg/kg displayed a decrease in the expression of myelin‐related genes and also Cnp. Cnpase is involved in RNA trafficking, splicing, and metabolism in the myelinating oligodendrocyte 30, 31, 32, 33. The severity of demyelination in EAE model is modulated by CB1 receptor 34, 35, which underpins the present findings. Furthermore, we reported lower Napepld expression in all groups fed with CPZ and this fact might indicate less AEA content. However, previous studies revealed decreased AEA levels 36, whereas others observed normal 37 or higher 38 AEA levels in demyelinated brains. In addition, the gene involved in 2‐AG synthesis (Dagla) was declined following CPZ diet and 0.5 mg/kg of WIN although others have found conflicting results 39, 40, 41, 42. This discrepancy might be attributed to the animal model (rats vs. mice), the methods, the sampling time applied, or the target brain structure analyzed.
Administration of CPZ in combination with 0.5 mg/kg of WIN decreased the expression of NgR1 and might confer neuroprotection against CPZ. In fact, NgR1 participates in oligodendrocyte differentiation, myelination 43, and cell cytoskeleton reorganization 44, while the blockade of NgR1 signaling prevents axonal degeneration in EAE model 44. Accordingly, it is noteworthy to speculate that the loss of NgR1 might protect the axon.
Animals fed with CPZ and subjected to either 0.5 or 1 mg/kg of WIN might suffer a dysfunction in the corticocortical connectivity resulting from a downregulation of Satb2 expression. DNA‐binding protein Satb2 is essential for the normal elaboration of corticocortical network 45. During the acute demyelination, the expression of Ski protooncogene increased following CPZ diet and 1 mg/kg of WIN when compared with those animals subjected to 0.5 mg/kg. Such increase might contribute to counteract the exacerbated demyelination observed after CPZ dietary combined with 1 mg/kg of WIN. In line with these findings, it is described that neurons for Ski‐deficient mice lose their identity and cannot culminate to form the corpus callosum 46.
The present findings demonstrated lower Vgf expression following the administration of CPZ combined with either 0.5 or 1 mg/kg of WIN, but not after CPZ alone. Vgf is a component of the chromogranin/secretogranin family 47, 48 actively involved in amyotrophic lateral sclerosis (ALS) neuroprotection 49. Because it is described that declined levels of this bioactive peptide (Vgf) could promote neurodegeneration 50, further investigation of these aspects is required.
Proteins associated with endoplasmic reticulum (ER) stress have recently been shown in demyelinating disorders 51, 52. Among these, the chaperone Calr has an important role in serum myelin clearance 53. Indeed, we assume that CPZ‐fed mice treated with 1 mg/kg of WIN showed an impairment in serum myelin clearance as indicated the loss of Calr expression 53.
The Recovery Period
Animals fed with normal chow for a recovery period of 6 weeks following cuprizone diet displayed no differences regarding sensory motor gaiting, while the corpus callosum was apparently normal 3. However, certain genes persisted deregulated. Briefly, animals exposed to CPZ and treated with either 0.5 or 1 mg/kg of WIN declined the expression of Mag in comparison with CPZ alone and this fact might indicate a failure in the trophic support for oligodendrocytes 54. After a recovery period of 6 weeks, once CPZ was removed from diet, 1 mg/kg of WIN declined the expression of myelin‐related genes such as Olig2, Sox10, and Ddr1 in comparison with CPZ alone. The proliferation of OPCs at the demyelinated region is tightly coordinated by a complex interplay of intrinsic, extrinsic, and epigenetic mechanisms 55. Among the intrinsic factors, Olig2 and Sox10 are critical for oligodendrocytes 56, 57. An overexpression of Ddr1 has been reported in myelinating oligodendrocytes 58, during oligodendrocyte differentiation as well as during CPZ‐induced remyelination 14. Accordingly, we demonstrated that myelin‐related processes are affected by 1 mg/kg WIN during both demyelination and recovery period. Additionally, we found that Olig2 remained downregulated in CPZ‐fed animals treated with 1 mg/kg in comparison with those treated with 0.5 mg/kg, which in turn supports that myelination is not fully achieved.
Following CPZ and 1 mg/kg of WIN, Dtnbp1 expression increased in comparison with the remaining CPZ‐fed animals, which could promote neurite outgrowth and cytoskeleton rearrangements in order to restore corpus callosum connectivity. In fact, Dtnbp1 regulates neurotransmitter release, signal transduction 59, while deficits in this protein cause shorter neurite length and alterations in cytoskeleton rearrangements 60. Moreover, ER homeostasis and serum myelin clearance might be at risk following CPZ and 1 mg/kg of WIN compared with CPZ alone as indicated the loss of calreticulin expression 53.
In conclusion, we proved that the drug WIN promotes oligodendrocyte differentiation in vitro. During the CPZ‐induced CNS demyelination, we assessed a neuroprotective effect of 0.5 mg/kg of the drug as shown by (1) better sensory motor gaiting, (2) more myelinated axons/area, and (3) overexpression of Rxra in combination with lower NgR1 expression. In contrast, CPZ‐fed mice treated with 1 mg/kg of WIN exhibited the maximum demyelination as indicated by (1) more demyelination axons/area and (2) downregulation of Vgf, Calr, and myelin‐related gene expression coupling specifically with lower Cnp expression. However, the detailed mechanisms of action that underlie the cannabinoid neuroprotection warrant further investigation.
Conflict of Interest
The authors declare no conflict of interest.
Supporting information
Table S1. Nanostring nCounter codeset. Column titles from left to right: official gene symbol; target sequence; accession.
Figure S1. Nanostring nCounter gene expression profile at the third week. During the acute demyelination, ApoE expression increased following CPZ alone (P < 0.01) and in combination with either 0.5 or 1 mg/kg of WIN (P < 0.001). The administration of cuprizone increased the expression of Rxra in mice exposed to vehicle (CPZ alone) as well as in combination with 0.5 mg/kg of WIN (P < 0.01). Moreover, the expression of Mog, Mbp, Mag, and Napepld were declined following CPZ alone (P < 0.05) or in combination with either 0.5 or 1 mg/kg of WIN (P < 0.01). Animals exposed to CPZ diet and treated with either 0.5 or 1 mg/kg of WIN exhibited lower expression of Ngr1 (P < 0.001), Satb2 (P < 0.01; P < 0.05, respectively), and Vgf (P < 0.05). Daily injection with 0.5 mg/kg of WIN in CPZ‐fed mice decreased the expression of Dagla in contrast to controls (P < 0.05). In addition, the administration of 1 mg/kg WIN in CPZ‐fed animals decreased specifically the expression of Cnp and also does Calr (P < 0.05). CPZ‐fed mice subjected to 1 mg/kg of WIN displayed higher Ski expression than those mice treated with 0.5 mg/kg (P < 0.01). The remaining comparisons were statistically nonsignificant and not included in this figure. Data were normalized by scaling with geometric mean of built‐in control gene probes after log transformation (base 2) for each sample. Level of significance (‐log10p) was set to *1.30103, **2, and ***3. –Log2FC values below 0 indicate downregulation, whereas upper 0 indicate upregulation. N = 5. CTR, control animals fed with standard diet and treated with phosphate‐buffered saline; CPZ, cuprizone‐fed animals.
Figure S2. Nanostring nCounter gene expression profile at the twelfth week. After a recovery period of 6 weeks following cuprizone dietary, Dtnbp1 expression increased in CPZ‐fed mice treated with 1 mg/kg of WIN when compared with either CPZ alone or in combination with 0.5 mg/kg of WIN (P < 0.05). Furthermore, Mag and Olig2 expression underwent a downregulation following CPZ feeding and 0.5 mg/kg of WIN in contrast to CPZ alone (P < 0.05). The recovery group exposed to 1 mg/kg of WIN showed lower Olig2, Sox10, Mag, Calr, and Ddr1 expression in comparison with CPZ alone (P < 0.05). In addition, the expression of Olig2 decreased in CPZ‐fed mice treated with 1 mg/kg of WIN when compared with those mice treated with 0.5 mg/kg of WIN (P < 0.05). The remaining comparisons were statistically nonsignificant and not included in this figure. Data were normalized by scaling with geometric mean of built‐in control gene probes after log transformation (base 2) for each sample. Level of significance (‐log10p) was set to *1.30103, **2, and ***3. –Log2FC values below 0 indicate downregulation, whereas upper 0 indicate upregulation. N = 5. CTR, control animals fed with standard diet and treated with phosphate‐buffered saline; CPZ, cuprizone‐fed animals.
Acknowledgment
The authors would like to thank Dr. Möbius and Torben Ruhwedel (Dept. of Neurogenetics, MPIEM, Göttingen, Germany) for excellent technical support. The work was supported by DFG CNMPB grant CNMPB C1‐6 to Prof Havemann‐Reinecke. We thank the Northern German Addiction Research Federation for kindly financial support of this study to U. Havemann‐Reinecke.
The copyright line for this article was changed on 25 March, 2016 after original online publication.
References
- 1. Baumann N, Pham‐Dinh D. Biology of oligodendrocyte and myelin in the mammalian central nervous system. Physiol Rev 2001;81:871–927. [DOI] [PubMed] [Google Scholar]
- 2. Waxman SG. Axonal conduction and injury in multiple sclerosis: The role of sodium channels. Nat Rev Neurosci 2006;7:932–941. [DOI] [PubMed] [Google Scholar]
- 3. Matsushima GK, Morell P. The neurotoxicant, cuprizone, as a model to study demyelination and remyelination in the central nervous system. Brain Pathol 2001;11:107–116. [DOI] [PMC free article] [PubMed] [Google Scholar]
- 4. Gomez O, Sanchez‐Rodriguez A, Le M, Sanchez‐Caro C, Molina‐Holgado F, Molina‐Holgado E. Cannabinoid receptor agonists modulate oligodendrocyte differentiation by activating PI3K/Akt and the mammalian target of rapamycin (mTOR) pathways. Br J Pharmacol 2011;163:1520–1532. [DOI] [PMC free article] [PubMed] [Google Scholar]
- 5. Vettor R, Pagano C. The role of the endocannabinoid system in lipogenesis and fatty acid metabolism. Best Pract Res: Clin Endocrinol Metab 2009;23:51–63. [DOI] [PubMed] [Google Scholar]
- 6. Smith TH, Sim‐Selley LJ, Selley DE. Cannabinoid CB1 receptor‐interacting proteins: Novel targets for central nervous system drug discovery? Br J Pharmacol 2010;160:454–466. [DOI] [PMC free article] [PubMed] [Google Scholar]
- 7. Ruehle S, Rey AA, Remmers F, Lutz B. The endocannabinoid system in anxiety, fear memory and habituation. J Psychopharmacol 2012;26:23–39. [DOI] [PMC free article] [PubMed] [Google Scholar]
- 8. Devane WA, Hanus L, Breuer A, et al. Isolation and structure of a brain constituent that binds to the cannabinoid receptor. Science 1992;258:1946–1949. [DOI] [PubMed] [Google Scholar]
- 9. Sugiura T, Kondo S, Sukagawa A, et al. 2‐Arachidonoylgylcerol: A possible endogenous cannabinoid receptor ligand in brain. Biochem Biophys Res Commun 1995;215:89–97. [DOI] [PubMed] [Google Scholar]
- 10. Basavarajappa BS. Critical enzymes involved in endocannabinoid metabolism. Protein Pept Lett 2007;14:237–246. [DOI] [PMC free article] [PubMed] [Google Scholar]
- 11. Di Marzo V. Endocannabinoids: Synthesis and degradation. Rev Physiol Biochem Pharmacol 2008;160:1–24. [DOI] [PubMed] [Google Scholar]
- 12. Rapp C, Walter A, Studerus E, et al. Cannabis use and brain structural alterations of the cingulate cortex in early psychosis. Psychiatry Res 2013;214:102–108. [DOI] [PubMed] [Google Scholar]
- 13. Sánchez‐Blázquez P, Rodríguez‐Muñoz M, Garzón J. The cannabinoid receptor 1 associates with NMDA receptors to produce glutamatergic hypofunction: Implications in psychosis and schizophrenia. Front Pharmacol 2013;4:169. [DOI] [PMC free article] [PubMed] [Google Scholar]
- 14. Franco‐Pons N, Tomàs J, Roig B, Auladell C, Martorell L, Vilella E. Discoidin domain receptor 1, a tyrosine kinase receptor, is upregulated in an experimental model of remyelination and during oligodendrocyte differentiation in vitro. J Mol Neurosci 2009;38:2–11. [DOI] [PubMed] [Google Scholar]
- 15. Bologov A, Gafni M, Keren O, Sarne Y. Dual neuroprotective and neurotoxic effects of cannabinoid drugs in vitro. Cell Mol Neurobiol 2011;31:195–202. [DOI] [PMC free article] [PubMed] [Google Scholar]
- 16. Radyushkin K, Hammerschmidt K, Boretius S, et al. Neuroligin‐3‐deficient mice: Model of a monogenic heritable form of autism with an olfactory deficit. Genes Brain Behav 2009;8:416–425. [DOI] [PubMed] [Google Scholar]
- 17. Schultz RL, Karlsson U. Fixation of the central nervous system for electron microscopy by aldehyde perfusion. II. Effect of osmolarity, pH of perfusate, and fixative concentration. J Ultrastruct Res 1965;12:187–206. [DOI] [PubMed] [Google Scholar]
- 18. Reynolds E. The use of lead citrate at high pH as an electron‐opaque stain in electron microscopy. J Cell Biol 1963;17:208–212. [DOI] [PMC free article] [PubMed] [Google Scholar]
- 19. Hoshida Y, Villanueva A, Sangiovanni A, et al. Prognostic gene expression signature for patients with hepatitis C‐related early‐stage cirrhosis. Gastroenterology 2013;144:1024–1030. [DOI] [PMC free article] [PubMed] [Google Scholar]
- 20. Xu H, Yang H‐J, McConomy B, Browning R, Li X‐M. Behavioral and neurobiological changes in C57BL/6 mouse exposed to cuprizone: Effects of antipsychotics. Front Behav Neurosci 2010;4:8. [DOI] [PMC free article] [PubMed] [Google Scholar]
- 21. Swerdlow NR, Stephany N, Wasserman LC, Talledo J, Shoemaker J, Auerbach PP. Amphetamine effects on prepulse inhibition across‐species: Replication and parametric extension. Neuropsychopharmacology 2003;28:640–650. [DOI] [PubMed] [Google Scholar]
- 22. Pistis M, Ferraro L, Pira L, et al. Delta(9)‐tetrahydrocannabinol decreases extracellular GABA and increases extracellular glutamate and dopamine levels in the rat prefrontal cortex: An in vivo microdialysis study. Brain Res 2002;948:155–158. [DOI] [PubMed] [Google Scholar]
- 23. Guzmán M, Sánchez C, Galve‐Roperh I. Cannabinoids and cell fate. Pharmacol Ther 2002;95:175–184. [DOI] [PubMed] [Google Scholar]
- 24. Rubovitch V, Gafni M, Sarne Y. The cannabinoid agonist DALN positively modulates L‐type voltage‐dependent calcium‐channels in N18TG2 neuroblastoma cells. Mol Brain Res 2002;101:93–102. [DOI] [PubMed] [Google Scholar]
- 25. Dayger CA, Rosenberg JS, Winkler C, et al. Paradoxical effects of apolipoprotein E on cognitive function and clinical progression in mice with experimental autoimmune encephalomyelitis. Pharmacol Biochem Behav 2012; DOI: S0091‐3057(12)00321‐8 [pii]\r10.1016/j.pbb.2012.11.010. [DOI] [PubMed] [Google Scholar]
- 26. Bartelt A, Orlando P, Mele C, et al. Altered endocannabinoid signalling after a high‐fat diet in Apoe ‐/‐ mice: Relevance to adipose tissue inflammation, hepatic steatosis and insulin resistance. Diabetologia 2011;54:2900–2910. [DOI] [PubMed] [Google Scholar]
- 27. Diab A, Hussain RZ, Lovett‐Racke AE, Chavis JA, Drew PD, Racke MK. Ligands for the peroxisome proliferator‐activated receptor‐gamma and the retinoid X receptor exert additive anti‐inflammatory effects on experimental autoimmune encephalomyelitis. J Neuroimmunol 2004;148:116–126. [DOI] [PubMed] [Google Scholar]
- 28. Gentili C, Tutolo G, Pianezzi A, Cancedda R, Cancedda FD. Cholesterol secretion and homeostasis in chondrocytes: A liver X receptor and retinoid X receptor heterodimer mediates apolipoprotein A1 expression. Matrix Biol 2005;24:35–44. [DOI] [PubMed] [Google Scholar]
- 29. Huang JK, Jarjour AA, Nait Oumesmar B, et al. Retinoid X receptor gamma signaling accelerates CNS remyelination. Nat Neurosci 2011;14:45–53. [DOI] [PMC free article] [PubMed] [Google Scholar]
- 30. Bifulco M, Laezza C, Stingo S, Wolff J. 2′,3′‐Cyclic nucleotide 3′‐phosphodiesterase: A membrane‐bound, microtubule‐associated protein and membrane anchor for tubulin. Proc Natl Acad Sci USA 2002;99:1807–1812. [DOI] [PMC free article] [PubMed] [Google Scholar]
- 31. Gobert RP, Joubert L, Curchod M‐L, et al. Convergent functional genomics of oligodendrocyte differentiation identifies multiple autoinhibitory signaling circuits. Mol Cell Biol 2009;29:1538–1553. [DOI] [PMC free article] [PubMed] [Google Scholar]
- 32. Gravel M, Robert F, Kottis V, Gallouzi IE, Pelletier J, Braun PE. 2′,3′‐Cyclic nucleotide 3′‐phosphodiesterase: A novel RNA‐binding protein that inhibits protein synthesis. J Neurosci Res 2009;87:1069–1079. [DOI] [PubMed] [Google Scholar]
- 33. Lee J, Gravel M, Zhang R, Thibault P, Braun PE. Process outgrowth in oligodendrocytes is mediated by CNP, a novel microtubule assembly myelin protein. J Cell Biol 2005;170:661–673. [DOI] [PMC free article] [PubMed] [Google Scholar]
- 34. Croxford JL, Pryce G, Jackson SJ, et al. Cannabinoid‐mediated neuroprotection, not immunosuppression, may be more relevant to multiple sclerosis. J Neuroimmunol 2008;193:120–129. [DOI] [PubMed] [Google Scholar]
- 35. Pryce G, Ahmed Z, Hankey DJR, et al. Cannabinoids inhibit neurodegeneration in models of multiple sclerosis. Brain 2003;126:2191–2202. [DOI] [PubMed] [Google Scholar]
- 36. Cabranes A, Venderova K, De Lago E, et al. Decreased endocannabinoid levels in the brain and beneficial effects of agents activating cannabinoid and/or vanilloid receptors in a rat model of multiple sclerosis. Neurobiol Dis 2005;20:207–217. [DOI] [PubMed] [Google Scholar]
- 37. Witting A, Chen L, Cudaback E, et al. Experimental autoimmune encephalomyelitis disrupts endocannabinoid‐mediated neuroprotection. Proc Natl Acad Sci USA 2006;103:6362–6367. [DOI] [PMC free article] [PubMed] [Google Scholar]
- 38. Centonze D, Bari M, Rossi S, et al. The endocannabinoid system is dysregulated in multiple sclerosis and in experimental autoimmune encephalomyelitis. Brain 2007;130:2543–2553. [DOI] [PubMed] [Google Scholar]
- 39. Bernal‐Chico A, Canedo M, Manterola A, et al. Blockade of monoacylglycerol lipase inhibits oligodendrocyte excitotoxicity and prevents demyelination in vivo. Glia 2015;63:163–176. [DOI] [PubMed] [Google Scholar]
- 40. Kreutz S, Koch M, Ghadban C, Korf HW, Dehghani F. Cannabinoids and neuronal damage: Differential effects of THC, AEA and 2‐AG on activated microglial cells and degenerating neurons in excitotoxically lesioned rat organotypic hippocampal slice cultures. Exp Neurol 2007;203:246–257. [DOI] [PubMed] [Google Scholar]
- 41. Melis M, Pillolla G, Bisogno T, et al. Protective activation of the endocannabinoid system during ischemia in dopamine neurons. Neurobiol Dis 2006;24:15–27. [DOI] [PubMed] [Google Scholar]
- 42. Panikashvili D, Mechoulam R, Beni SM, Alexandrovich A, Shohami E. CB1 cannabinoid receptors are involved in neuroprotection via NF‐kappa B inhibition. J Cereb Blood Flow Metab 2005;25:477–484. [DOI] [PubMed] [Google Scholar]
- 43. Mi S, Miller RH, Lee X, et al. LINGO‐1 negatively regulates myelination by oligodendrocytes. Nat Neurosci 2005;8:745–751. [DOI] [PubMed] [Google Scholar]
- 44. Petratos S, Azari MF, Ozturk E, Papadopoulos R, Bernard CCA. Novel therapeutic targets for axonal degeneration in multiple sclerosis. J Neuropathol Exp Neurol 2010;69:323–334. [DOI] [PubMed] [Google Scholar]
- 45. Alcamo EA, Chirivella L, Dautzenberg M, et al. Satb2 regulates callosal projection neuron identity in the developing cerebral cortex. Neuron 2008;57:364–377. [DOI] [PubMed] [Google Scholar]
- 46. Baranek C, Dittrich M, Parthasarathy S, et al. Protooncogene Ski cooperates with the chromatin‐remodeling factor Satb2 in specifying callosal neurons. Proc Natl Acad Sci 2012; 109:3546–3551. [DOI] [PMC free article] [PubMed] [Google Scholar]
- 47. Bartolomucci A, La Corte G, Possenti R, et al. TLQP‐21, a VGF‐derived peptide, increases energy expenditure and prevents the early phase of diet‐induced obesity. Proc Natl Acad Sci USA 2006;103:14584–14589. [DOI] [PMC free article] [PubMed] [Google Scholar]
- 48. Yamaguchi H, Sasaki K, Satomi Y, et al. Peptidomic identification and biological validation of neuroendocrine regulatory peptide‐1 and ‐2. J Biol Chem 2007;282:26354–26360. [DOI] [PubMed] [Google Scholar]
- 49. Pompl PN, Ho L, Bianchi M, McManus T, Qin W, Pasinetti GM. A therapeutic role for cyclooxygenase‐2 inhibitors in a transgenic mouse model of amyotrophic lateral sclerosis. FASEB J 2003;17:725–727. [DOI] [PubMed] [Google Scholar]
- 50. Zhao Z, Lange DJ, Ho L, et al. Vgf is a novel biomarker associated with muscle weakness in amyotrophic lateral sclerosis (ALS), with a potential role in disease pathogenesis. Int J Med Sci 2008;5:92–99. [DOI] [PMC free article] [PubMed] [Google Scholar]
- 51. Cunnea P, Mháille AN, McQuaid S, Farrell M, McMahon J, FitzGerald U. Expression profiles of endoplasmic reticulum stress‐related molecules in demyelinating lesions and multiple sclerosis. Mult Scler 2011;17:808–818. [DOI] [PubMed] [Google Scholar]
- 52. McMahon JM, McQuaid S, Reynolds R, FitzGerald UF. Increased expression of ER stress‐ and hypoxia‐associated molecules in grey matter lesions in multiple sclerosis. Mult Scler 2012;18:1437–1447. [DOI] [PubMed] [Google Scholar]
- 53. Ní Fhlathartaigh M, McMahon J, Reynolds R, et al. Calreticulin and other components of endoplasmic reticulum stress in rat and human inflammatory demyelination. Acta Neuropathol Commun 2013;1:37. [DOI] [PMC free article] [PubMed] [Google Scholar]
- 54. Quarles RH. Myelin‐associated glycoprotein (MAG): Past, present and beyond. J Neurochem 2007;100:1431–1448. [DOI] [PubMed] [Google Scholar]
- 55. Rowitch DH, Kriegstein AR. Developmental genetics of vertebrate glial‐cell specification. Nature 2010;468:214–222. [DOI] [PubMed] [Google Scholar]
- 56. Hornig J, Fröb F, Vogl MR, Hermans‐Borgmeyer I, Tamm ER, Wegner M. The transcription factors Sox10 and Myrf define an essential regulatory network module in differentiating oligodendrocytes. PLoS Genet 2013;9:e1003907. [DOI] [PMC free article] [PubMed] [Google Scholar]
- 57. Wegener A, Deboux C, Bachelin C, et al. Gain of Olig2 function in oligodendrocyte progenitors promotes remyelination. Brain 2015;138:120–135. [DOI] [PMC free article] [PubMed] [Google Scholar]
- 58. Franco‐Pons N, Virgos C, Vogel WF, et al. Expression of discoidin domain receptor 1 during mouse brain development follows the progress of myelination. Neuroscience 2006;140:463–475. [DOI] [PubMed] [Google Scholar]
- 59. Ghiani CA, Starcevic M, Rodriguez‐Fernandez IA, et al. The dysbindin‐containing complex (BLOC‐1) in brain: Developmental regulation, interaction with SNARE proteins and role in neurite outgrowth. Mol Psychiatry 2010;15:204–215. [DOI] [PMC free article] [PubMed] [Google Scholar]
- 60. Kubota K, Kumamoto N, Matsuzaki S, et al. Dysbindin engages in c‐Jun N‐terminal kinase activity and cytoskeletal organization. Biochem Biophys Res Commun 2009;379:191–195. [DOI] [PubMed] [Google Scholar]
Associated Data
This section collects any data citations, data availability statements, or supplementary materials included in this article.
Supplementary Materials
Table S1. Nanostring nCounter codeset. Column titles from left to right: official gene symbol; target sequence; accession.
Figure S1. Nanostring nCounter gene expression profile at the third week. During the acute demyelination, ApoE expression increased following CPZ alone (P < 0.01) and in combination with either 0.5 or 1 mg/kg of WIN (P < 0.001). The administration of cuprizone increased the expression of Rxra in mice exposed to vehicle (CPZ alone) as well as in combination with 0.5 mg/kg of WIN (P < 0.01). Moreover, the expression of Mog, Mbp, Mag, and Napepld were declined following CPZ alone (P < 0.05) or in combination with either 0.5 or 1 mg/kg of WIN (P < 0.01). Animals exposed to CPZ diet and treated with either 0.5 or 1 mg/kg of WIN exhibited lower expression of Ngr1 (P < 0.001), Satb2 (P < 0.01; P < 0.05, respectively), and Vgf (P < 0.05). Daily injection with 0.5 mg/kg of WIN in CPZ‐fed mice decreased the expression of Dagla in contrast to controls (P < 0.05). In addition, the administration of 1 mg/kg WIN in CPZ‐fed animals decreased specifically the expression of Cnp and also does Calr (P < 0.05). CPZ‐fed mice subjected to 1 mg/kg of WIN displayed higher Ski expression than those mice treated with 0.5 mg/kg (P < 0.01). The remaining comparisons were statistically nonsignificant and not included in this figure. Data were normalized by scaling with geometric mean of built‐in control gene probes after log transformation (base 2) for each sample. Level of significance (‐log10p) was set to *1.30103, **2, and ***3. –Log2FC values below 0 indicate downregulation, whereas upper 0 indicate upregulation. N = 5. CTR, control animals fed with standard diet and treated with phosphate‐buffered saline; CPZ, cuprizone‐fed animals.
Figure S2. Nanostring nCounter gene expression profile at the twelfth week. After a recovery period of 6 weeks following cuprizone dietary, Dtnbp1 expression increased in CPZ‐fed mice treated with 1 mg/kg of WIN when compared with either CPZ alone or in combination with 0.5 mg/kg of WIN (P < 0.05). Furthermore, Mag and Olig2 expression underwent a downregulation following CPZ feeding and 0.5 mg/kg of WIN in contrast to CPZ alone (P < 0.05). The recovery group exposed to 1 mg/kg of WIN showed lower Olig2, Sox10, Mag, Calr, and Ddr1 expression in comparison with CPZ alone (P < 0.05). In addition, the expression of Olig2 decreased in CPZ‐fed mice treated with 1 mg/kg of WIN when compared with those mice treated with 0.5 mg/kg of WIN (P < 0.05). The remaining comparisons were statistically nonsignificant and not included in this figure. Data were normalized by scaling with geometric mean of built‐in control gene probes after log transformation (base 2) for each sample. Level of significance (‐log10p) was set to *1.30103, **2, and ***3. –Log2FC values below 0 indicate downregulation, whereas upper 0 indicate upregulation. N = 5. CTR, control animals fed with standard diet and treated with phosphate‐buffered saline; CPZ, cuprizone‐fed animals.