Abstract
To circumvent the bottlenecks of non‐flexibility, low sensitivity, and narrow workable detection range of conventional biosensors for biological molecule detection (e.g., dopamine (DA) secreted by living cells), a new hybrid flexible electrochemical biosensor has been created by decorating closely packed dendritic Pt nanoparticles (NPs) on freestanding graphene paper. This innovative structural integration of ultrathin graphene paper and uniform 2D arrays of dendritic NPs by tailored wet chemical synthesis has been achieved by a modular strategy through a facile and delicately controlled oil–water interfacial assembly method, whereby the uniform distribution of catalytic dendritic NPs on the graphene paper is maximized. In this way, the performance is improved by several orders of magnitude. The developed hybrid electrode shows a high sensitivity of 2 μA cm−2 μm −1, up to about 33 times higher than those of conventional sensors, a low detection limit of 5 nm, and a wide linear range of 87 nm to 100 μm. These combined features enable the ultrasensitive detection of DA released from pheochromocytoma (PC 12) cells. The unique features of this flexible sensor can be attributed to the well‐tailored uniform 2D array of dendritic Pt NPs and the modular electrode assembly at the oil–water interface. Its excellent performance holds much promise for the future development of optimized flexible electrochemical sensors for a diverse range of electroactive molecules to better serve society.
Keywords: dopamine, graphene, living cells, platinum, sensors
1. Introduction
As one of the most widely studied monoaminergic neuroreceptors, dopamine (DA) plays a significant role in modulating many aspects of the brain circuitry of mammals.1 It has been reported that intractable psychiatric and neurodegenerative diseases, such as Huntington's, Alzheimer's, and Parkinson's diseases and schizophrenia, are associated with abnormalities of DA.2 It is thus highly desirable to improve the capability to monitor DA levels in vitro and in vivo so as to lead to a greater understanding of neuronal function for the development of diagnostic tools.3 To date, a variety of methods, including fluorimetry, ionic chromatography, capillary electrophoresis, UV/Vis spectrophotometry, and electrogenerated chemiluminescence, have been developed for the sensitive detection of DA.4 Besides these well‐established methods, electrochemical methods have been widely used to detect DA since they possess some outstanding properties, such as ease of operation, rapid response, and high sensitivity in biological systems.5
As is well known, the electrochemical response intensity towards DA is extremely dependent on the material composition and surface properties of the working electrode used.4d, 6 Additionally, it is a considerable challenge to eliminate interference from coexisting species such as ascorbic acid (AA) and uric acid (UA), which have similar oxidation potentials and are likely to be present at high concentrations. Based on these considerations, tailored nanomaterials and biological recognition species, such as noble metals and metal oxides,7 conductive polymers,8 carbon materials modified with small molecules,7b, 9, 10 an RNA aptamer,4c and an enzyme,5a have been introduced as the modifying components for DA biosensors to impart improved sensitivity and selectivity. These modifications could inhibit interference reactions or promote DA oxidation through effective electrocatalysis,7 electrostatic attraction,8a, 11 or specific recognition between DA and an enzyme (such as tyrosinase) or an RNA aptamer.4c, 12 However, most of these modified electrodes have been inflexible and not suitable for the construction of flexible sensors/devices with very high sensitivity. Flexible biosensors would be amenable to potential miniaturization, such that they might be deployed in point‐of‐care devices, which would greatly widen their applications in extreme conditions whereby only small quantities (less than a microliter) of samples are available for analysis.13 Furthermore, another field of application of flexible biosensors is in wearable detectors and implantable devices suitable for field‐based use, which rely far less on laboratory‐based analytical instrumentation and with which it is desirable to obtain instant results upon exposure to the analyte.14 Considering the good application prospects and miniaturization potential of flexible biosensors, some new sensing platforms with excellent flexibility are highly anticipated. Freestanding graphene paper, obtained by the layer‐by‐layer stacking of single graphene nanosheets, has emerged as a novel supporting scaffold for hybrid flexible electrodes.11a, 12 Previous research by our group has demonstrated that hybrids of graphene paper with metal nanocrystals constitute ideal flexible electrode materials, displaying good performance for the detection of biomolecules released from living cells.15 The good performance could be attributed to the well‐tailored nanocrystal size, morphology, and enhanced loading density, coupled with the excellent mechanical strength, structural uniformity, and electrical conductivity of the flexible graphene‐paper‐based substrate.15a, 16 Moreover, the fabrication of such flexible hybrid electrodes is facile.
Herein, we report the construction of a novel hybrid electrode by structurally integrating 2D assembled dendritic Pt nanoparticles (NPs) on flexible graphene paper, which shows improved application in detecting DA released from living cells.17 Dendritic Pt NPs have been selected from various Pt nanostructures, such as nanowires, nanotubes, polyhedra, and multipods, because of their larger surface area, which provides enough adsorption sites for molecules within a confined space.18 Moreover, through effective self‐assembly and accumulation at the interface between oil and water phases,31, 32 monolayer dendritic Pt NPs with high density and excellent uniformity could be formed on the surface of graphene paper. Thus, the high catalytic efficiency of dendritic Pt NPs could be fully exploited and revealed. As illustrated in Figure 1, 2D assembled dendritic Pt NPs were transferred onto fixed graphene paper to form a flexible hybrid electrode through a facile dip‐coating approach.15b This strategy provides an attractive advantage for a new kind of biosensor by integrating optimized metal nanostructures and flexible graphene paper into a uniquely designed electrode. The developed functional electrodes have effectively circumvented problems such as the low loading density of NPs and poor control over the NP structures encountered in existing methods.17b Results have indicated that this flexible composite electrode exhibits ultrahigh sensitivity, a wide linear range, and a very low limit for the detection of DA. These interesting findings collectively enable such an electrochemical biosensor to be potentially applied as an implantable, portable, and miniaturized smart device in living tissues.
Figure 1.
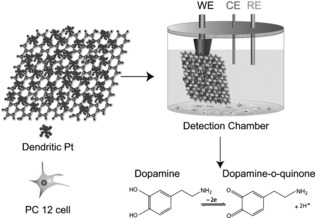
Schematic illustration of the fabrication of hybrid electrodes and their electrochemical sensing response towards DA released from living PC 12 cells.
2. Results and Discussion
2.1. Characterization of dendritic Pt NPs
2,2′‐Dithiobis[1‐(2‐bromo‐2‐methyl‐propionyloxy)]ethane (DTBE)‐conjugated dendritic Pt NPs spontaneously assembled into a 2D monolayer film at the interface between water and hexane. This film was then transferred onto a Cu grid by a dip‐coating method. The well‐tailored 2D monolayer film was characterized by a large‐scale, low‐magnification TEM image (Figure 2 A). The uniformity and monolayer nature of the Pt NP film were more clearly revealed by a high‐magnification TEM image (Figure 2 B). Furthermore, high‐resolution TEM (HRTEM) (Figure 2 C) was used to examine the morphology of the synthesized NPs. HRTEM revealed that the dendritic Pt NPs (ca. 20 nm) were composed of uniform Pt nanocrystals (ca. 3 nm). A distance of 0.22 nm was consistently observed, which can be ascribed to the lattice fringe of the Pt (111) face.17b, 19 It is noteworthy that the ligand‐exchange process is a reliable strategy for the synthesis of 2D assembled dendritic Pt NP films.20
Figure 2.
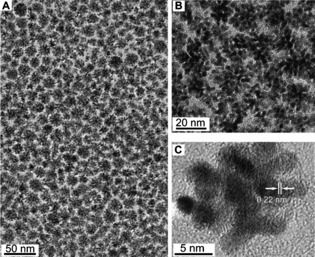
(A, B) TEM images of a 2D assembled film of dendritic Pt NPs at low and high magnifications, respectively. (C) HRTEM image of a dendritic Pt NP.
2.2. Characterization of the hybrid electrode
Through a simple dip‐coating process at the water‐oil interface, dendritic Pt NPs were uniformly anchored on the surface of rGO paper. Figure 3 A, B show cross‐sectional FESEM images at low and high magnifications, respectively, which reveal the layer‐by‐layer structured rGO paper of constant thickness and high loading of Pt NPs. The formation of a well‐defined dendritic Pt NP monolayer on the rGO paper could be observed most clearly in the top‐view image of the hybrid flexible electrode (Figure 3 C). We speculated that this was due to the hydrophobic force between Pt NPs and rGO paper, as DTBE‐capped dendritic Pt NPs are amphiphilic and rGO paper also displays hydrophobicity because of the restored functional groups.15c XRD was used to further investigate the crystal structure of Pt/rGO paper in comparison with that of pure rGO paper. As can be seen from Figure 3 D, a typical characteristic (002) diffraction peak (2θ=24.4°) was observed for both rGO paper and Pt/rGO paper, suggesting that the crystal structure of rGO paper remained unchanged after modification with Pt NPs.17b On the other hand, four characteristic diffraction peaks ascribed to the (111), (200), (220), and (311) planes of the face‐centered cubic (fcc) structure of Pt were seen for the Pt/rGO paper, located at 2θ≈39.9°, 46.3°, 67.7°, and 81.4°, respectively, indicating the successful anchoring of Pt NPs on the rGO paper.
Figure 3.
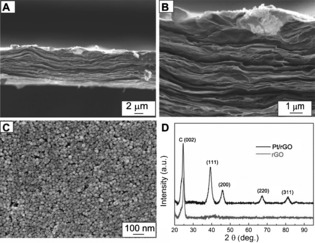
A, B) Cross‐sectional SEM images of dendritic Pt NPs‐decorated rGO paper electrode at low and high magnifications, respectively. C) Top‐view SEM image of dendritic Pt NPs‐decorated rGO paper electrode. D) XRD patterns of rGO and Pt/rGO paper electrodes.
Figure 4 A shows the CV curves of a Pt/rGO paper electrode and a bare Pt foil electrode in 1.0 m H2SO4 measured at a scan rate of 100 mV s−1. Both CV curves feature two peaks in the potential range between −0.2 V and 0.2 V for forward and reverse scanning, corresponding to the typical profiles of hydrogen desorption and adsorption on a Pt electrode surface.21 The electrochemically active surface area (EAS) was estimated on the basis of hydrogen adsorption and desorption peaks on the CV curves by assuming 210 μC cm−2 to correspond to a monolayer of hydrogen on a smooth Pt electrode.22 EAS values of 236 and 47.2 cm2 mg−1 Pt were determined for Pt/rGO and Pt foil electrodes, respectively. The remarkably increased active surface area of the Pt/rGO paper electrode (236 cm2 mg−1 Pt), which is larger than those of some previously reported electrodes (Pt NPs/CNT array 143 cm2 mg−1 Pt, mesoporous Pt powder 60 cm2 mg−1 Pt), could be explained in terms of the high‐density loading of dendritic Pt NPs on rGO paper.23 The charge‐transfer resistance of the Pt/rGO paper electrode (90 Ω) was clearly much smaller than that of the rGO paper electrode (325 Ω) (Figure 4 A, inset), and thus electron transfer became easier at the hybrid electrode. Besides the high sensitivity imparted by the enlarged EAS, the hybrid electrode exhibited good selectivity. Figure 4 B shows DPV curves of DA in the presence of AA and UA. The voltammetric peak intervals of DA to AA and UA are 189 mV and 156 mV, respectively, in line with a previous report.24 This indicated that the electrochemical response of DA could be distinguished and quantified by the Pt/rGO paper electrode even in the presence of potential interfering species (e.g., AA and UA) at higher concentrations in the biological environment. This can be attributed to the negatively charged DTBE ligand on the surface of the dendritic Pt NPs, which strongly repels the negatively charged AA and UA. The reproducibility and stability of the developed biosensors were also acceptable. After storage for 4 weeks, the peak current density retained 95 % of its initial value. Five repeated measurements using the same electrode yielded a relative standard deviation (RSD) of 4.5 %.
Figure 4.
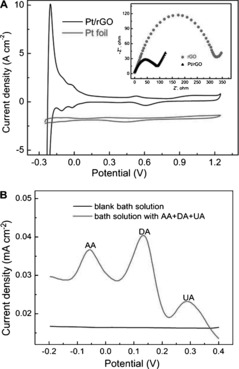
A) CV curves of the hybrid Pt/rGO paper electrode and a Pt foil electrode in 1 m H2SO4. Scan rate: 100 mV s−1. The inset shows impedance plots of rGO and hybrid Pt/rGO paper electrodes in 0.1 m KCl containing 1.0 mm K3Fe(CN)6 and 1.0 mm K4Fe(CN)6. B) DPV curves of the hybrid electrode in blank bath solution and bath solution containing 0.15 mm AA, 0.003 mm DA, and 0.15 mm UA, showing the feasibility of selective detection.
2.3. Electrochemical performance of the hybrid electrode
The electrocatalytic activities of different electrodes were investigated by applying DA as the model analyte (Figure 5). The Pt/rGO paper electrode clearly showed better electrochemical catalytic activity toward DA oxidation than the rGO paper electrode because of the increased current density and negatively shifted oxidation potential (Figure 5 A). Both the cathodic and anodic current densities of DA were found to vary linearly with scan rate (Figure 5 B), indicating that the electrochemical redox process of DA at the electrode surface was adsorption‐controlled. In order to avoid any memory effect, the Pt/rGO paper electrode was cleaned prior to the next detection. Specifically, the electrode was subjected to several CV scans in blank PBS (pH 10.0) after each measurement, and the results confirmed that the adsorbed DA could be fully eliminated and the electrode surface could be successfully restored. Figure 5 C displays the DPV responses towards DA at various concentrations at the Pt/rGO paper electrode. The DPV peak intensity was demonstrated to be proportional to the DA concentration over the range 87 nm–100 μm, with an excellent sensitivity of 2 μA μM−1 cm−2.4c, 9 The detection limit was about 5 nm. The detection limit and linear range are compared with those quoted in other reports in Table 1.
Figure 5.
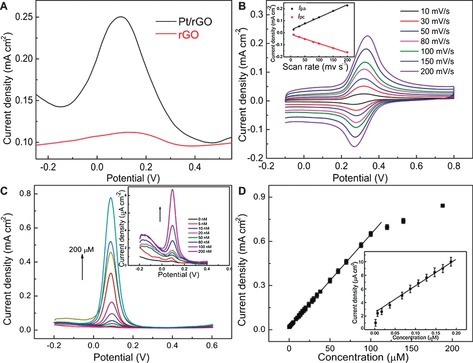
A) DPV curves of rGO and Pt/rGO paper electrodes in PBS (0.1 m, pH 7.4) containing DA. B) CVs of the Pt/rGO paper electrode at different scan rates in PBS (0.1 m, pH 7.4) containing 10 μm DA. The inset shows the dependence of redox peak current density on the potential sweep rate. C) DPV responses to various concentrations of DA at the Pt/rGO paper electrode. The inset shows DPV curves at low concentrations of DA. It should be noted that not all of the curves at different concentrations are shown for the sake of clarity. D) Relationship between DPV current density and DA concentration. The inset shows the equivalent plot for low concentrations of DA.
Table 1.
Comparison of the performances of DA biosensors based on different electrode materials.
| Electrode | Sensitivity [μA μm −1 cm−2] | Linear Range [μm] | Detection Limit [μm] | Ref. | |
|---|---|---|---|---|---|
| 1 | RNA aptamer | 0.06 | 0.10–5 | 0.1 | 4c |
| 2 | NiNPs@P‐1,5‐DAN | 0.88 | 1–6000 | 0.011 | 28 |
| 3 | RuO2/CNTs | 0.08 | 0.60–3600 | 0.06 | 29 |
| 4 | Self‐assembled peptide | 0.22 | 5.0–40 | 2.8 | 8a |
| 5 | Pyrolytic carbon films | 0.20 | 18–270 | 2.30 | 30 |
| 6 | Oligo(phenyleneethynylene)s/graphene | 0.01–60 | 0.005 | 10 | |
| 7 | Silica/CNTs | 0.17 | 0.50–6.00 | 0.014 | 7a |
| 8 | 3D graphene foam | 0.62 | 0.025–25 | 0.025 | 9 |
| 9 | 2D assembly dendritic Pt/graphene paper | 2.00 | 0.087–100 | 0.005 | This work |
2.4. Detection of DA released from live cells
The above results unequivocally revealed the high performance of the hybrid Pt/rGO paper electrode toward DA detection, making it highly promising for tracking DA released from living cells. Prior to application for detecting DA released from living PC 12 cells, the biocompatibility of the hybrid Pt/rGO paper electrode was confirmed by a cell viability test with the standard CCK‐8 assay. Figure 6 A shows the quantitative results for the living cells. It can be seen that after co‐culturing with a hybrid Pt/rGO paper electrode for 8 h, more than 95 % of the PC 12 cells were still alive, demonstrating the good biocompatibility of the electrode. Based on the above merits of the flexible hybrid Pt/rGO paper electrode, it was employed to detect DA secreted from living PC 12 cells. After PC 12 cells had been cultured on a 24‐well microplate for more than 24 h, they had reached 85 % confluence. High‐K+ saline solution was then added to the wells as a stimulus and DPV was carried out to detect DA released from the PC 12 cells. It has been confirmed that the addition of high‐K+ saline solution leads to cell membrane depolarization and opening of Ca2+ ion channels.25 In turn, the Ca2+ influx through these opened channels stimulates several sets of proteins to immobilize and fuse large, dense‐core secretory vesicles.27b, 27c In this way, DA inside the vesicles fused with plasma membrane is discharged into the extracellular space.25, 26 From Figure 6 B (a), it can be seen that no peak current was detected in the absence of the stimulus (high‐K+ solution). Upon the addition of a certain amount of K+ solution, peaks attributable to the oxidation of DA appeared. The intensity of DPV response was related to the concentration of the stimuli present (Figure 6 B (b–d)). In the presence of 105 mm high‐K+ solution, the most commonly used concentration level as a stimulus, a response value of 24 μA cm−2 was obtained. The resultant multiple current densities were due to the oxidation of DA from individual exocytotic events and the electrical signal was equivalent to an extracellular value of 110 zmol transmitter molecules in a single cell, consistent with previous reports.27
Figure 6.
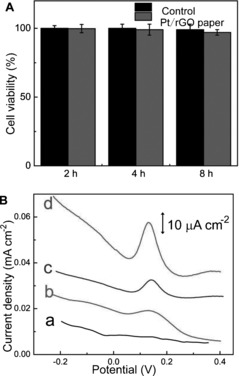
A) Cell viability testing of the hybrid Pt/rGO paper working electrode after co‐culturing with PC 12 cells for several hours. B) DPV responses (from a to d) of the Pt/rGO paper electrode in a microplate well with cultured PC 12 cells in the presence of 0 mm (a), 35 mm (b), 85 mm (c), and 105 mm (d) K+ solution.
3. Conclusions
A hybrid, freestanding, and stable dendritic Pt NPs‐decorated flexible graphene paper electrode has been successfully fabricated by a dip‐coating method. A 2D array of dendritic Pt NPs was self‐assembled at the interface of a biphasic mixture of water and hexane, and then uniformly anchored on graphene paper upon its immersion. By virtue of the remarkable electrocatalytic activity, high loading density of dendritic Pt nanocrystals, and good conductivity of the flexible graphene paper, the constructed sensor exhibited excellent performance. It showed very high sensitivity, several orders of magnitude greater than those of conventional sensors, outstanding selectivity, and good stability for the detection of DA. These integrated features endowed it with an excellent ability to detect DA secreted from live PC 12 cells, with an ultra‐low detection limit of 5 nm, an ultra‐high sensitivity of 2 μA μm −1 cm−2, and a wide linear detection range from 87 nm to 100 μm. This work illustrates a simple and novel approach for the development of electrochemical sensors based on thin NP film‐decorated flexible paper electrodes, which could provide a new flexible sensing platform for electroactive molecules. This approach should be promising for the fabrication of implantable, portable, and miniaturized sensor devices for use in living tissues, which would be of high commercial value.
4. Experimental Section
4.1. Materials and instrumentation
Hydrogen hexachloroplatinate(IV) hydrate (H2PtCl6 ⋅6 H2O, purity: 99.9 %), graphite powder (<150 μm, 99.99 %), hydroiodic acid (HI, 55 % in water), polyvinyl pyrrolidone (PVP), uric acid (UA), and l‐ascorbic acid (AA) were purchased from Aldrich. All other chemicals used were of analytical reagent grade. Stock solutions of dopamine (3‐hydroxyltyramine hydrochloride; Aldrich) were prepared by dissolving it in HClO4 and then stored in a refrigerator. Standard solutions of dopamine at different concentrations from 5 nm to 10 mm were obtained by diluting this stock solution with phosphate buffer solution (PBS, pH 7.4). The bath solution contained 140 mm NaCl, 2 mm CaCl2, 4.2 mm KCl, 0.7 mm MgCl2, 1 mm NaH2PO4, and 10 mm HEPES at pH 7.4. The stimulus was K+ solution (pH 7.4) containing 40 mm NaCl, 105 mm KCl, 6 mm CaCl2, 1 mm MgCl2, and 10 mm HEPES. Ultrapure deionized (DI) water was used to prepare all of the above solutions.
An electrochemical workstation (CHI 660D, CH Instruments) with a conventional three‐electrode system was employed for cyclic voltammetry (CV), electrochemical impedance spectroscopy (EIS), and differential pulse voltammetry (DPV) measurements. The working electrode was reduced graphene oxide (rGO) paper (1×1 cm) decorated with dendritic Pt NPs. An Ag/AgCl electrode and a Pt wire were adopted as the reference and counter electrodes, respectively. A JEM 2010 microscope was used to obtain TEM images of the samples. A JEOL JSM‐6700 field‐emission scanning electron microscope (FESEM) equipped with an energy‐dispersive X‐ray (EDX) detector was applied to determine the topographies and compositions of the samples. A UV/Vis spectrophotometer (1800) was used to record the UV/Vis spectra of the samples. An Olympus 71 inverted microscope equipped with a PIXIS: 100 B spectroscopy CCD camera was used to capture optical bright‐field images of living cells.
4.2. Fabrication of graphene paper
Graphene oxide (GO) was synthesized from graphite powder by a modified Hummers method.31 Freestanding GO paper was then prepared by a mold‐casting method recently developed by our group.15a The merit of this method is that both the size and thickness of the GO paper can be freely controlled by applying casting molds of different sizes and dropping different volumes of GO dispersions. GO paper was reduced to rGO paper by immersing it in HI solution for 1 h at room temperature.32 Residual HI was rinsed off with DI water and the resultant electrode was allowed to dry naturally.
4.3. Synthesis of dendritic Pt NPs
Dendritic Pt NPs were synthesized on the basis of previous reports.17a, 19a Briefly, H2O (13.4 mL), PVP (70 mg), and AA (13.6 mL, 100 mm) were well mixed and heated to 90 °C, and then H2PtCl4 (13 mL, 20 mm) was added with stirring. The resulting mixture was stirred for 3 h at 90 °C. Thereafter, the dendritic Pt NPs were purified by removing the surplus PVP and resuspended in DI water.
4.4. Interfacial assembly of dendritic Pt NP arrays
The dendritic Pt NPs were capped with 2,2′‐dithiobis[1‐(2‐bromo‐2‐methyl‐propionyloxy)]ethane (DTBE) through a ligand‐exchange reaction.15c Briefly, a solution of DTBE (10 mg) in DMF (500 μL) was added to the above suspension of dendritic Pt NPs in H2O (100 mL). After reaction for 12 h, the NPs were purified by centrifugation and stored in DMF for further usage. The oil–water interface assembly of dendritic Pt NPs was performed by introducing the NPs into a mixture of water and hexane (1:1, v/v). After gently mixing the two‐phase system for 5 min and then leaving it undisturbed, a metallic lustre appeared at the interface between the water and hexane, indicating the formation of a 2D assembly of dendritic Pt NPs. The hybrid electrode (Pt/rGO) was fabricated by dip‐coating the 2D assembly of Pt NPs onto fixed rGO paper. All hybrid paper electrodes of fixed size were washed and dried at room temperature.
4.5. Cell culture
PC 12 cells were selected as model cells to study regulated neurotransmitter secretion from neurons. PC 12 cells were seeded into a 24‐well microplate at a density of 1×10⁶ cells mL−1 and maintained at 37 °C in a humid atmosphere containing 5 % CO2. The cell culture medium was a mixture containing 5 % horse serum, 10 % fetal bovine serum, and 1 % penicillin‐streptomycin.
4.6. Electrochemical measurements
DPV and CV measurements for DA were performed in unstirred PBS (0.1 m, pH 7.4) by applying a potential between −0.2 V and 0.8 V vs Ag/AgCl. For the detection of DA released from living PC 12 cells, stimulus solution (high‐K+ saline) was injected into the cells when the density reached 85 % confluence. The electrode was then immersed into a 24‐well microplate and electrochemical measurements were carried out directly.
X. Zan, H. Bai, C. Wang, F. Zhao, H. Duan, Chem. Eur. J. 2016, 22, 5204.
Contributor Information
Dr. Hongwei Bai, Email: hwbai@ntu.edu.sg
Prof. Hongwei Duan, Email: hwduan@ntu.edu.sg
References
- 1.
- 1a. Bernsmann F., Ponche A., Ringwald C., Hemmerlé J., Raya J., Bechinger B., Voegel J.-C., Schaaf P., Ball V., J. Phys. Chem. C 2009, 113, 8234–8242; [Google Scholar]
- 1b. Fante C., Eldar-Boock A., Satchi-Fainaro R., Osborn H. M. I., Greco F., J. Med. Chem. 2011, 54, 5255–5259; [DOI] [PubMed] [Google Scholar]
- 1c. Venton B. J., Wightman R. M., Anal. Chem. 2003, 75, 414A–421A. [Google Scholar]
- 2.
- 2a. Chen D., Feng H., Li J., Chem. Rev. 2012, 112, 6027–6053; [DOI] [PubMed] [Google Scholar]
- 2b. Nestler E. J., Cell 1994, 79, 923–926. [DOI] [PubMed] [Google Scholar]
- 3. Patel A. N., Tan S. Y., Miller T. S., Macpherson J. V., Unwin P. R., Anal. Chem. 2013, 85, 11755–11764. [DOI] [PubMed] [Google Scholar]
- 4.
- 4a. Casalini S., Leonardi F., Cramer T., Biscarini F., Org. Electron. 2013, 14, 156–163; [Google Scholar]
- 4b. Cui R., Gu Y. P., Bao L., Zhao J. Y., Qj B. P., Zhang Z. L., Xie Z. X., Pang D. W., Anal. Chem. 2012, 84, 8932–8935; [DOI] [PubMed] [Google Scholar]
- 4c. Farjami E., Campos R., Nielsen J. S., Gothelf K. V., Kjems J., Ferapontova E. E., Anal. Chem. 2013, 85, 121–128; [DOI] [PubMed] [Google Scholar]
- 4d. Huang Y., Cai D., Chen P., Anal. Chem. 2011, 83, 4393–4406; [DOI] [PubMed] [Google Scholar]
- 4e. Wang X.-D., Wolfbeis O. S., Anal. Chem. 2013, 85, 487–508. [DOI] [PubMed] [Google Scholar]
- 5.
- 5a. Njagi J., Chernov M. M., Leiter J. C., Andreescu S., Anal. Chem. 2010, 82, 989–996; [DOI] [PubMed] [Google Scholar]
- 5b. Yang G., Zhao F., Zeng B., Biosens. Bioelectron. 2014, 53, 447–452. [DOI] [PubMed] [Google Scholar]
- 6. Zhao S., Wu M., Zhao F., Zeng B., Talanta 2013, 117, 146–151. [DOI] [PubMed] [Google Scholar]
- 7.
- 7a. Canevari T. C., Raymundo-Pereira P. A., Landers R., Benvenutti E. V., Machado S. A. S., Talanta 2013, 116, 726–735; [DOI] [PubMed] [Google Scholar]
- 7b. Teymourian H., Salimi A., Khezrian S., Biosens. Bioelectron. 2013, 49, 1–8. [DOI] [PubMed] [Google Scholar]
- 8.
- 8a. Matos I. D., Alves W. A., ACS Appl. Mater. Interfaces 2011, 3, 4437–4443; [DOI] [PubMed] [Google Scholar]
- 8b. Feng X., Zhang Y., Yan Z., Chen N., Ma Y., Liu X., Yang X., Hou W., J. Mater. Chem. A 2013, 1, 9775–9780. [Google Scholar]
- 9. Dong X. C., Wang X. W., Wang L. H., Song H., Zhang H., Huang W., Chen P., ACS Appl. Mater. Interfaces 2012, 4, 3129–3133. [DOI] [PubMed] [Google Scholar]
- 10. Deng J., Liu M., Lin F., Zhang Y., Liu Y., Yao S., Anal. Chim. Acta 2013, 767, 59–65. [DOI] [PubMed] [Google Scholar]
- 11.
- 11a. Alwarappan S., Liu G., Li C.-Z., Nanomed. Nanotechnol. 2010, 6, 52–57; [DOI] [PubMed] [Google Scholar]
- 11b. Kalimuthu P., John S. A., Talanta 2010, 80, 1686–1691. [DOI] [PubMed] [Google Scholar]
- 12. Ali S. R., Ma Y., Parajuli R. R., Balogun Y., Lai W. Y. C., He H., Anal. Chem. 2007, 79, 2583–2587. [DOI] [PubMed] [Google Scholar]
- 13.
- 13a. Reddy A. S. G., Narakathu B. B., Atashbar M. Z., Rebros M., Hrehorova E., Joyce M., IEEE Sens. J. 2010, 2010, 1596–1600; [Google Scholar]
- 13b. Feier B., Floner D., Cristea C., Bodoki E., Sandulescu R., Geneste F., Talanta 2012, 98, 152–156; [DOI] [PubMed] [Google Scholar]
- 13c. Gao A., Lu N., Dai P., Li T., Pei H., Gao X., Gong Y., Wang Y., Fan C., Nano Lett. 2011, 11, 3974–3978; [DOI] [PubMed] [Google Scholar]
- 13d. Wan H., Zhao F., Zeng B., Colloids Surf. B 2011, 86, 247–250; [DOI] [PubMed] [Google Scholar]
- 13e. Xiao F., Zhao F., Mei D., Mo Z., Zeng B., Biosens. Bioelectron. 2009, 24, 3481–3486. [DOI] [PubMed] [Google Scholar]
- 14.
- 14a. Hwang S.-W., Lee C. H., Cheng H., Jeong J.-W., Kang S.-K., Kim J.-H., Shin J., Yang J., Liu Z., Ameer G. A., Huang Y., Rogers J. A., Nano Lett. 2015, 15, 2801–2808; [DOI] [PubMed] [Google Scholar]
- 14b. Gao H., Duan H., Biosens. Bioelectron. 2015, 65, 404–419. [DOI] [PubMed] [Google Scholar]
- 15.
- 15a. Xiao F., Li Y., Zan X., Liao K., Xu R., Duan H., Adv. Funct. Mater. 2012, 22, 2487–2494; [Google Scholar]
- 15b. Xiao F., Song J. B., Gao H. C., Zan X. L., Xu R., Duan H. W., ACS Nano 2012, 6, 100–110; [DOI] [PubMed] [Google Scholar]
- 15c. Zan X., Fang Z., Wu J., Xiao F., Huo F., Duan H., Biosens. Bioelectron. 2013, 49, 71–78. [DOI] [PubMed] [Google Scholar]
- 16. Chen J., Bi H., Sun S., Tang Y., Zhao W., Lin T., Wan D., Huang F., Zhou X., Xie X., Jiang M., ACS Appl. Mater. Interfaces 2013, 5, 1408–1413. [DOI] [PubMed] [Google Scholar]
- 17.
- 17a. Lim B., Jiang M., Camargo P. H., Cho E. C., Tao J., Lu X., Zhu Y., Xia Y., Science 2009, 324, 1302–1305; [DOI] [PubMed] [Google Scholar]
- 17b. Shen Q., Jiang L., Zhang H., Min Q., Hou W., Zhu J.-J., J. Phys. Chem. C 2008, 112, 16385–16392. [Google Scholar]
- 18. Attard G. S., Science 1997, 278, 838–840. [Google Scholar]
- 19.
- 19a. Lim B., Jiang M., Yu T., Camargo P. H. C., Xia Y., Nano Res. 2010, 3, 69–80; [Google Scholar]
- 19b. Yang C. W., Chanda K., Lin P. H., Wang Y. N., Liao C. W., Huang M. H., J. Am. Chem. Soc. 2011, 133, 19993–20000. [DOI] [PubMed] [Google Scholar]
- 20. Duan H., Wang D., Kurth D. G., Möhwald H., Angew. Chem. Int. Ed. 2004, 43, 5639–5642; [DOI] [PubMed] [Google Scholar]; Angew. Chem. 2004, 116, 5757–5760. [Google Scholar]
- 21. Xu Y., Lin X., J. Power Sources 2007, 170, 13–19. [Google Scholar]
- 22.
- 22a. Savinell R. F., Zeller R. L., Adams J. A., J. Electrochem. Soc. 1990, 137, 489–494; [Google Scholar]
- 22b. Tian M., Wu G., Chen A., ACS Catal. 2012, 2, 425–432. [Google Scholar]
- 23.
- 23a. Jeon M. K., McGinn P. J., Electrochim. Acta 2012, 64, 147–153; [Google Scholar]
- 23b. Liu Y., Chen J., Zhang W., Ma Z., Swiegers G. F., Too C. O., Wallace G. G., Chem. Mater. 2008, 20, 2603–2605. [Google Scholar]
- 24. Sun C. L., Chang C. T., Lee H. H., Zhou J. G., Wang J., Sham T. K., Pong W. F., ACS Nano 2011, 5, 7788–7795. [DOI] [PubMed] [Google Scholar]
- 25. Sudibya H. G., Ma J., Dong X., Ng S., Li L.-J., Liu X.-W., Chen P., Angew. Chem. Int. Ed. 2009, 48, 2723–2726; [DOI] [PubMed] [Google Scholar]; Angew. Chem. 2009, 121, 2761–2764. [Google Scholar]
- 26. Li B.-R., Hsieh Y.-J., Chen Y.-X., Chung Y.-T., Pan C.-Y., Chen Y.-T., J. Am. Chem. Soc. 2013, 135, 16034–16037. [DOI] [PubMed] [Google Scholar]
- 27.
- 27a. Shi B. X., Wang Y., Zhang K., Lam T. L., Chan H. L. W., Biosens. Bioelectron. 2011, 26, 2917–2921; [DOI] [PubMed] [Google Scholar]
- 27b. Hou S., Kasner M. L., Su S., Patel K., Cuellari R., J. Phys. Chem. C 2010, 114, 14915–14921; [Google Scholar]
- 27c. Chen T. K., Luo G., Ewing A. G., Anal. Chem. 1994, 66, 3031–3035. [DOI] [PubMed] [Google Scholar]
- 28. Hathoot A. A., Yousef U. S., Shatla A. S., Abdel-Azzem M., Electrochim. Acta 2012, 85, 531–537. [Google Scholar]
- 29. Jiang L. C., Zhang W. D., Electroanalysis 2009, 21, 1811–1815. [Google Scholar]
- 30. Keeley G. P., McEvoy N., Nolan H., Kumar S., Rezvani E., Holzinger M., Cosnier S., Duesberg G. S., Anal. Methods 2012, 4, 2048–2053. [Google Scholar]
- 31. Hummers W. S., Offeman R. E., J. Am. Chem. Soc. 1958, 80, 1339–1339. [Google Scholar]
- 32. Pei S. F., Zhao J. P., Du J. H., Ren W. C., Cheng H. M., Carbon 2010, 48, 4466–4474. [Google Scholar]


