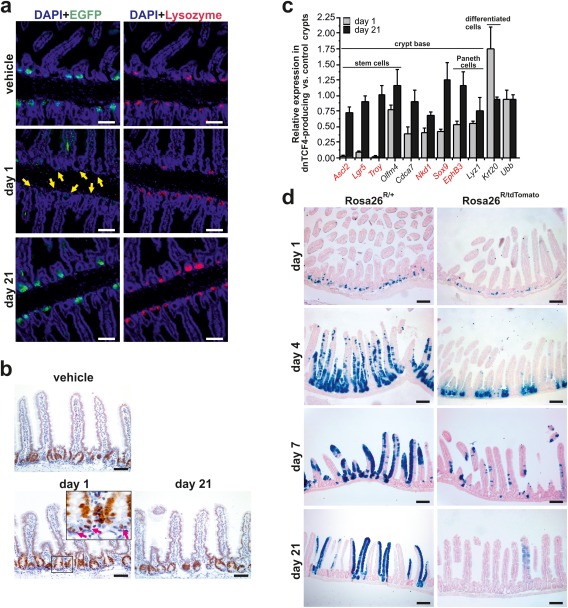
Figure 4.

EGFP‐dnTCF4‐expressing ISCs do not contribute to tissue homeostasis. (a) Confocal microscopy images of immunohistochemical staining performed in the proximal part of the small intestine of Rosa26tdTomato/tdTomato/Lgr5‐EGFP‐IRES‐CreERT2+ mice. Mice were injected by vehicle (mineral oil) only or by three consecutive doses of tamoxifen and analyzed next day or 21 days upon the first tamoxifen injection (indicated as “day 1” or “day 21,” respectively). Paraffin‐embedded sections were stained using an anti‐EGFP or anti‐lysozyme antibody to visualize ISCs (and/or EGFP‐dnTCF4‐producing cells; green fluorescence) and Paneth cells (red fluorescence). The specimens were co‐stained with DAPI nuclear stain (blue fluorescence), and merged images are shown. Notice the absence of (any) EGFP‐positive cells at the base of the crypts (yellow arrows) of “day 1” mice. (b) Distribution of proliferating Ki67‐positive cells in the small intestine of Rosa26tdTomato/tdTomato/Lgr5‐EGFP‐CreERT2+ mice. The animals were treated as in panel (a). Pink arrows in the inset indicate anti‐Ki67‐stained cells located at the base of the crypts. The specimens were counterstained with hematoxylin. (c) EGFP‐dnTCF4 alters gene expression signature in cells localized in the small intestinal crypts. Expression profiling of the small intestinal crypts isolated from Rosa26tdTomato/tdTomato/Lgr5‐EGFP‐IRES‐CreERT2+ (CreERT2+) and control Rosa26tdTomato/tdTomato (CreERT2‐) mice. Animals in both groups were injected with a single dose of tamoxifen and analyzed 1 and 21 days later (in the diagram indicated as the “day 1” and “day 21” dataset, respectively). The relative expression levels (at given time points) of the indicated gene in CreERT2+ vs. CreERT‐ crypts are shown. Corresponding crossing point (Cp) values are given in Supporting Information Table S2. Genes directly activated by Wnt/β‐catenin signaling are in red. The quantities of input cDNAs were normalized to Actb mRNA. The relative expression of another housekeeping gene, Ubb, is also shown. The analysis was performed in technical triplicates; error bars represent SDs from three analyzed mice (for each genotype). (d) Lineage tracing experiment performed in the middle part of the small intestine of Rosa26R/+/Lgr5‐EGFP‐IRES‐CreERT2+ (designated as Rosa26R/+) and Rosa26R/tdTomato/Lgr5‐EGFP‐IRES‐CreERT2+ (Rosa26R/tdTomato) mice. Specimens were obtained 1, 4, 7, and 21 days after a single tamoxifen injection. Three animals of each genotype were analyzed for the given time point; representative images are shown. Scale bar: 0.15 mm (a, b), 0.3 mm (d).
