Figure 5.

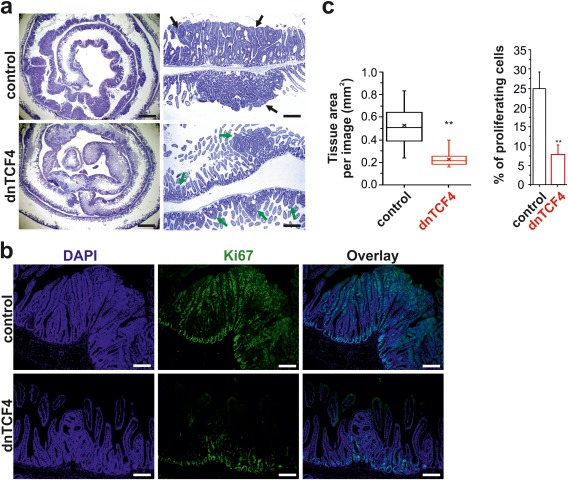
Decreased tumor formation in Apc‐deficient intestine of mice harboring the Rosa26dnTCF4 allele. (a) Left, representative microscopy images showing hematoxylin and eosin‐stained specimens of the rolled small intestine (the duodenum is centered) obtained from ApcCKO/CKO/Lgr5‐EGFP‐IRES‐CreERT2+ (control) and Rosa26+/tdTomato/ApcCKO/CKO/Lgr5‐EGFP‐IRES‐CreERT2+ (dnTCF4) mice 16 days after a single dose of tamoxifen. Right, hematoxylin‐stained immunohistochemical sections prepared from the proximal part of the small intestine. Notice the differences in the size of the neoplastic adenomatous lesions formed in control (black arrows) and dnTCF (green arrows) mice. Scale bar: 3 mm (left image); 0.75 mm (right image). (b) Representative fluorescent microscopy images of the small intestinal sections stained with an anti‐Ki67 antibody to visualize proliferating cells; the specimens were counterstained with DAPI nuclear stain (corresponding DAB‐based staining is shown in Supporting Information Fig. S5). Scale bar: 0.3 mm. (c) Quantification of tissue hyperplasia induced by the loss of Apc. Ten sections taken along the longitudinal axis of the small intestine were analyzed from each animal; two control and two dnTCF4 mice were examined. Left, DAPI fluorescence was employed to quantify the total tissue area per one image. The boxed areas correspond to the second and third quartiles; the spread of the values is also shown. Median and average value is indicated by the transverse line and cross, respectively. Right, both DAPI and anti‐Ki67 fluorescence was utilized to quantify the proportion of proliferating cells in the tissue sections. **P < 0.01; error bars indicate SDs.
