

Summary
The enhancement of heat stress tolerance in crops is an important challenge for food security to facilitate adaptation to global warming. In Arabidopsis thaliana, the transcriptional regulator DNA polymerase II subunit B3‐1 (DPB3‐1)/nuclear factor Y subunit C10 (NF‐YC10) has been reported as a positive regulator of Dehydration‐responsive element binding protein 2A (DREB2A), and the overexpression of DPB3‐1 enhances heat stress tolerance without growth retardation. Here, we show that DPB3‐1 interacts with DREB2A homologues in rice and soya bean. Transactivation analyses with Arabidopsis and rice mesophyll protoplasts indicate that DPB3‐1 and its rice homologue OsDPB3‐2 function as positive regulators of DREB2A homologues. Overexpression of DPB3‐1 did not affect plant growth or yield in rice under nonstress conditions. Moreover, DPB3‐1‐overexpressing rice showed enhanced heat stress tolerance. Microarray analysis revealed that many heat stress‐inducible genes were up‐regulated in DPB3‐1‐overexpressing rice under heat stress conditions. However, the overexpression of DPB3‐1 using a constitutive promoter had almost no effect on the expression of these genes under nonstress conditions. This may be because DPB3‐1 is a coactivator and thus lacks inherent transcriptional activity. We conclude that DPB3‐1, a coactivator that functions specifically under abiotic stress conditions, could be utilized to increase heat stress tolerance in crops without negative effects on vegetative and reproductive growth.
Keywords: DNA polymerase II subunit B3‐1/nuclear factor Y subunit C10, heat stress tolerance, Oryza sativa, transcriptional regulation, dehydration‐responsive element binding protein 2, microarray analysis
Introduction
There is increasing evidence of global warming, and it has been reported that the increased temperature will have negative effects on crop yields during the 21st century (Intergovernmental Panel on Climate Change, Working Group II, 2014). Moreover, frequent extreme heat events triggered by global warming will cause severe damage to several crop species, particularly in tropical and temperate regions (Deryng et al., 2014; Lobell et al., 2011; Schlenker and Roberts, 2009). Adaptation to climate change is one of the most important challenges for crop production in many parts of the world. Many previous studies have reported the negative effects of heat stress on plant growth and reproduction at physiological and molecular levels. Heat stress generally decreases the water content in plant cells, which results in cell growth inhibition, cell division and cell expansion (Ashraf and Hafeez, 2004; Hasanuzzaman et al., 2013; Rodríguez et al., 2005). Severe heat stress damages leaf tips and margins, resulting in leaf desiccation and ultimately necrosis (Omae et al., 2012). Several studies have reported that high temperature (28–30 °C) induces stem elongation or leaf elevation in some plants, such as Arabidopsis thaliana and potato; this also results in a decrease in total biomass or yield (Foreman et al., 2011; Patel and Franklin, 2009; Singh et al., 2013).
Several recent papers have demonstrated a loss of crop yields in response to high temperature. In 2003, severe heat stress caused a loss of approximately 5 million tons of rice grain yields in China (Tian et al., 2009). In Europe, heat waves in the summer of 2003 greatly reduced the yield of a wide range of agricultural crops (Ciais et al., 2005). It is estimated that global warming and extreme heat events will continue to exert negative effects on agricultural production in the future (Rosenzweig et al., 2014). Previous studies have reported the enhancement of heat stress tolerance in rice by genetic engineering, such as the overexpression of the Arabidopsis molecular chaperone HSP101 or the rice transcription factor OsWRKY11 in transgenic rice. Overexpression of these genes decreased the necrosis of leaves after heat stress treatment in rice plants (Katiyar‐Agarwal et al., 2003; Wu et al., 2009b); however, most of these studies did not reported differences in the transcriptomes of transgenic plants by gene transfer under nonstress conditions. Changes in the transcriptome in response to the overexpression of a gene under nonstress conditions might cause unexpected effects that are disadvantageous for agricultural applications.
We previously reported that DPB3‐1 interacts with the transcription factor DREB2A and that the overexpression of DPB3‐1 improves heat stress tolerance in Arabidopsis by increasing the expression of many stress‐inducible genes under heat stress conditions. DREB2A is an important transcription factor that regulates both heat and drought stress responses in Arabidopsis, and DREB2A activates gene expression by binding to dehydration‐responsive element (DRE) on the target promoters (Sakuma et al., 2006a,b). A phenotypic analysis suggested that DPB3‐1 would be a useful factor for generating heat stress‐tolerant crops because the overexpression of DPB3‐1 did not have negative effects on vegetative growth in Arabidopsis (Sato et al., 2014). In this study, interactions between DPB3‐1 and DREB2A homologues in rice and soya bean were confirmed. The effects of DPB3‐1 overexpression on vegetative and reproductive growth were assessed under nonstress conditions in rice; heat stress tolerance in DPB3‐1 overexpressing rice was also assessed.
Results
Arabidopsis DPB3‐1 interacts with DREB2A homologues in rice and soya bean
Recently, we reported that DPB3‐1 interacts with the N‐terminal region of DREB2A and functions as a positive regulator of DREB2A specifically under heat stress conditions (Sato et al., 2014). DPB3 family proteins are widely conserved among land plants, including rice and soya bean (Sato et al., 2014), indicating that DPB3‐1 might positively regulate DREB2A homologues in various crop plants. Initially, we analysed the reproductive growth phenotypes and yield of DPB3‐1‐overexpressing Arabidopsis to confirm the effects of DPB3‐1 overexpression on yield (Figure S1). The results indicated that the overexpression of DPB3‐1 did not have negative effects on reproductive growth and seed formation (Table S1). We also examined the expression levels of a rice DPB3‐1 homologue, OsDPB3‐2 (LOC_Os03g63530), under abiotic stress conditions in seedlings. Expression of the OsDPB3‐2 gene was induced by heat stress in shoots (Figure 1a). The gene was highly expressed in shoot basal regions, including meristematic cells (Figure 2); this expression pattern has also been observed for DPB3‐1 in Arabidopsis (Sato et al., 2014). These findings suggest that OsDPB3‐2 has conserved functions similar to DPB3‐1 in rice. The expression patterns of OsDPB3‐2 were different from those of DPB3‐1; OsDPB3‐2 was expressed in both roots and shoots under nonstress conditions and was not repressed by dehydration stress (Figure 1a). However, DPB3‐1 was primarily expressed in aerial regions and was repressed by dehydration (Figure 1b). These results imply that OsDPB3‐2 has specific functions in these tissues under such conditions.
Figure 1.
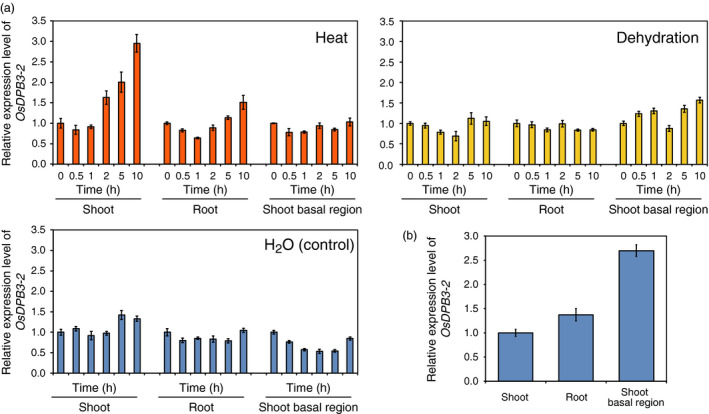
Expression profiles of the rice gene OsDPB3‐2. (a) OsDPB3‐2 expression levels in different rice tissues under heat (42 °C), dehydration or nonstress ( H2O ) conditions. OsDPB3‐2 expression levels were calculated using quantitative RT‐PCR analysis. The expression levels at 0 h under each condition were defined as 1.0. The error bars indicate the SD (n = 3). (b) OsDPB3‐2 expression levels in different tissues under nonstress conditions. The expression levels in shoot tissues were defined as 1.0. The error bars indicate the SD (n = 3).
Figure 2.
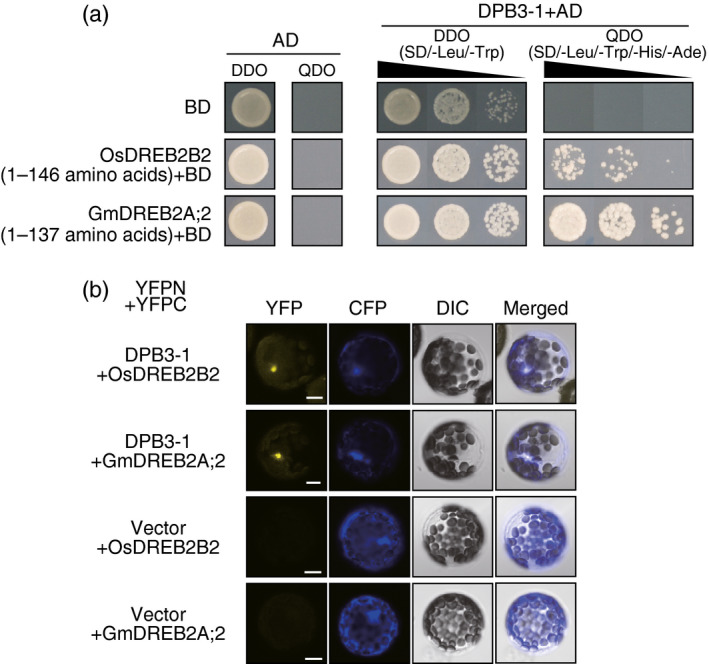
Interactions of DPB3‐1 with OsDREB2B2 and GmDREB2A;2 in yeast and Arabidopsis mesophyll cells. (a) The growth of yeast cells harbouring DPB3‐1 fused to the GAL4 activation domain (AD). SD/‐Leu/‐Trp (DDO) was the nonselective medium, and SD/‐Leu/‐Trp/‐His/‐Ade (QDO) was the selective medium. The N‐terminal region of OsDREB2B or GmDREB2A;2 was expressed as a fusion protein with the GAL4 binding domain (BD). (b) Verification of the interaction between DPB3‐1 and DREB2A homologous proteins by the BiFC system in Arabidopsis mesophyll protoplasts. Two constructs expressing a fusion protein of DPB3‐1 and the N‐terminal half of YFP (DPB3‐1‐YFPN) and a fusion protein of a DREB2A homologue protein and the C‐terminal half of YFP (OsDREB2B‐YFPC or GmDREB2A;2‐YFPC) were transfected. A construct expressing CFP was co‐transfected to identify transfected protoplasts. The transfected protoplasts were treated with 25 μm MG132, a 26S proteasome inhibitor, for 2 h in the dark. Differential interference contrast (DIC) images, confocal images of YFP and CFP fluorescence, and merged images are shown. Scale bars represent 10 μm.
Next, we investigated the interaction between DPB3‐1 and DREB2A homologues. We selected OsDREB2B2 and GmDREB2A;2 because these proteins were previously identified as canonical orthologues of DREB2A in rice and soya bean, respectively (Matsukura et al., 2010; Mizoi et al., 2013). Yeast two‐hybrid assays revealed that the N‐terminal regions of OsDREB2B2 and GmDREB2A;2 were sufficient for the interaction with DPB3‐1 (Figure 2a). For the BiFC tests, we expressed one fusion protein consisting of each DREB2A homologue and the C‐terminal half of yellow fluorescent protein (YFP; OsDREB2B2‐YFPC or GmDREB2A;2‐YFPC) and one fusion protein consisting of DPB3‐1 and the N‐terminal half of YFP (DPB3‐1‐YFPN) in protoplasts prepared from Arabidopsis mesophyll cells. Fluorescent signals were detected in the nuclei after treatment with MG132, an inhibitor of the 26S proteasome that promotes the accumulation of DREB2A homologue proteins (Mizoi et al., 2013; Morimoto et al., 2013; Sato et al., 2014; Figure 2b). These results suggested that DPB3‐1 interacts directly with OsDREB2B2 and GmDREB2A;2 in the nuclei. The high homology between the N‐terminal regions of the DREB2A homologues might have resulted in the interaction with DPB3‐1 (Figure S2).
We further performed a protein interaction analysis between DPB3‐1 and OsDREB2B2 using rice mesophyll protoplasts. A fusion protein of green fluorescent protein (GFP) and DPB3‐1 localized to the nuclei of the rice protoplasts (Figure 3a). Coexpression of OsDREB2B2‐YFPC and DPB3‐1‐YFPN in rice protoplasts treated with MG132 also produced YFP fluorescent signals in the nuclei (Figure 3b). This result indicated that DPB3‐1 interacts with OsDREB2B2 in the nuclei of rice cells. We also found that OsDPB3‐2 was localized to the nuclei (Figure 3a) and interacted with OsDREB2B2 (Figure 3b) in rice protoplasts.
Figure 3.
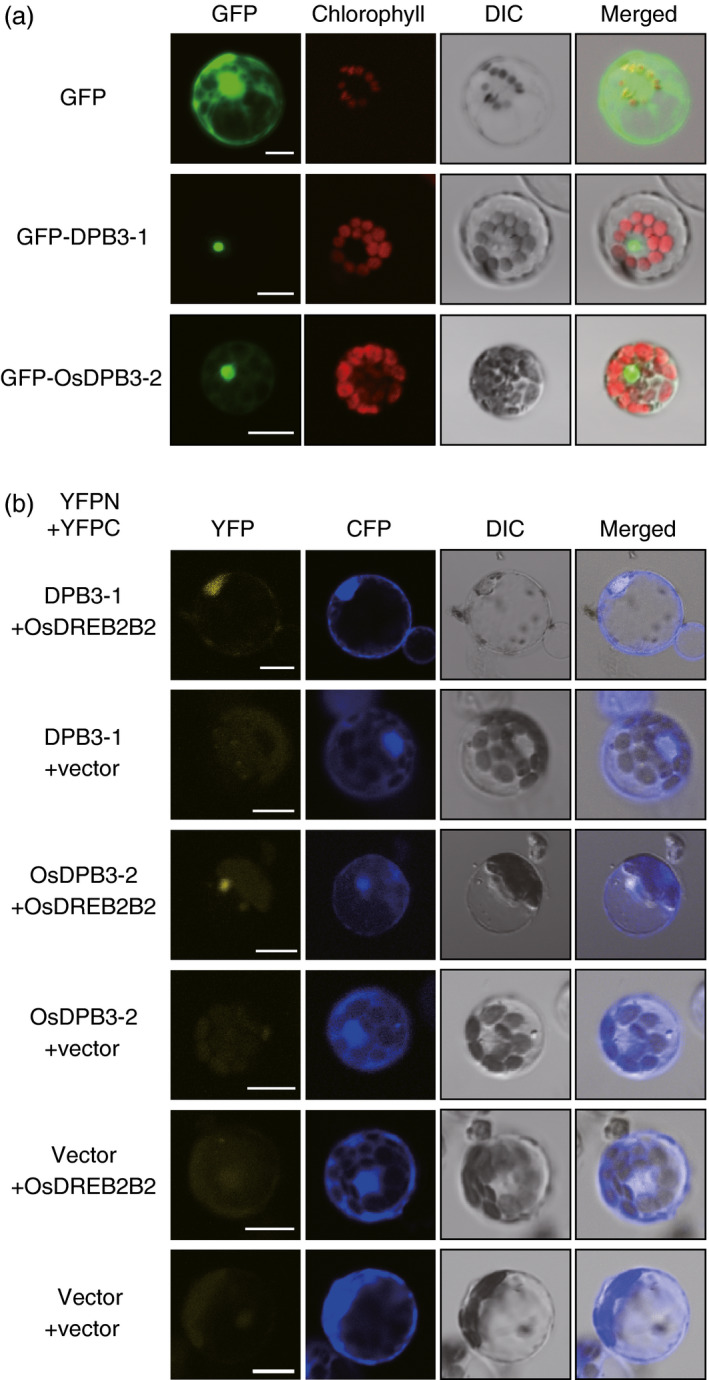
Subcellular localizations of DPB3‐1 and OsDPB3‐2 and the interaction between DPB3‐1 and OsDPB3‐2 with OsDREB2B2 in rice cells. (a) The subcellular localizations of DPB3‐1 and OsDPB3‐2 proteins fused to sGFP (GFP‐DPB3‐1 and GFP‐OsDPB3‐2) in rice mesophyll protoplasts. Protoplasts were transfected with the construct or the empty vector as a control. DIC images, confocal images of GFP fluorescence, confocal images of chlorophyll fluorescence and merged images are shown. Scale bars represent 10 μm. (b) Verification of the interaction between DPB3‐1 and OsDPB3‐2 with OsDREB2B2 using the BiFC system in rice mesophyll protoplasts. Rice mesophyll protoplasts were transfected with two constructs expressing OsDREB2B2‐YFPC and either DPB3‐1‐YFPN or OsDPB3‐2‐YFPN. The analysis was performed as described in Figure 2b. DIC images, confocal images of YFP and CFP fluorescence, and merged images are shown. Scale bars represent 10 μm.
A trimer composed of Arabidopsis NF‐YA2, NF‐YB3 and DPB3‐1 enhances reporter activity together with DREB2A homologues
To analyse the effect of DPB3‐1 on the transcriptional activity of the DREB2A homologues, we performed transactivation assays using Arabidopsis protoplasts. A trimer composed of Arabidopsis NF‐YA2, NF‐YB3 and DPB3‐1 has been reported to act as a positive regulator of DREB2A (Sato et al., 2014). The three subunits were coexpressed with OsDREB2B2 or GmDREB2A;2 in Arabidopsis mesophyll protoplasts using an Arabidopsis HsfA3 promoter‐GUS reporter (Figure 4a). The results showed that the coexpression of DPB3‐1, NF‐YA2 and NF‐YB3 with the DREB2A homologues significantly increased the transactivation of the reporter gene (Figure 4b,c). These data suggest that DPB3‐1 positively regulates the transcriptional activity of OsDREB2B2 and GmDREB2A;2 via the formation of trimers. A similar transactivation assay was also performed in rice mesophyll protoplasts using the same effector and reporter genes. Again, the coexpression of DPB3‐1, NF‐YA2 and NF‐YB3 significantly enhanced transactivation of the reporter gene together with OsDREB2B2 (Figure 4d). This result implies that DPB3‐1 functions as a positive regulator of OsDREB2B2 in rice cells in cooperation with NF‐YA2 and NF‐YB3 homologues. Moreover, the trimer formed by NF‐YA2, NF‐YB3 and rice OsDPB3‐2 also enhanced the reporter activity with OsDREB2B2 (Figure 4d). This result confirmed that the functions of DPB3 family proteins were conserved among land plants. Interestingly, the trimer formed by NF‐YA2, NF‐YB3 and OsDPB3‐2 enhanced reporter activity with OsDREB2B2 significantly more than the trimer formed by NF‐YA2, NF‐YB3 and DPB3‐1 (Figure 4d).
Figure 4.
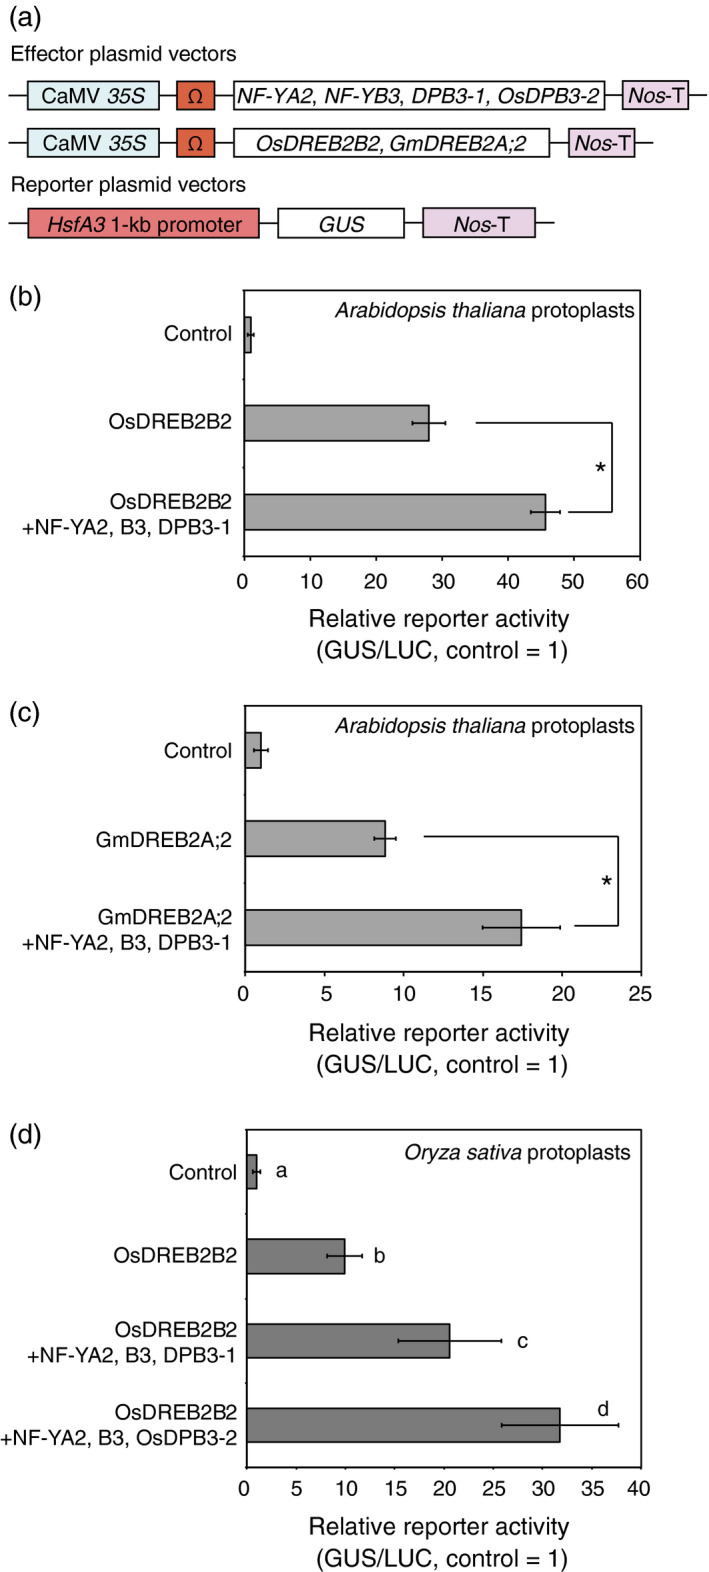
Transactivation of the HsfA3 promoter by DREB2A homologues with NF‐YA2, NF‐YB3, DPB3‐1 and OsDPB3‐2. (a) Schematic diagram of the effector and reporter constructs for the transactivation analysis. The plasmids containing the CaMV 35S promoter and the tobacco mosaic virus Ω sequence fused to the NF‐YA2, NF‐YB3, DPB3‐1, OsDPB3‐2, OsDREB2B2 and GmDREB2A;2 coding sequence were cotransfected into protoplasts with the reporter plasmids harbouring the HsfA3 1‐kb promoter: GUS fusion gene. Nos‐T indicates the terminator sequence of the gene for nopaline synthetase. (b–d) Transactivation analysis of the HsfA3 1‐kb promoter: GUS reporter gene by DREB2A homologous proteins in cooperation with NF‐YA2, NF‐YB3, DPB3‐1 and OsDPB3‐2. Bars indicate mean and SD values from assays performed in triplicate, and asterisks and letters indicate significant differences between the reporter activities (P < 0.05 according to Student's t‐test or Tukey's multiple range test). The 35S:LUC plasmid was also cotransfected in each experiment as an internal control. Transactivation analysis using OsDREB2B2 (b) or GmDREB2A;2 (c) with the trimer of NF‐YA2, NF‐YB3 and DPB3‐1 in Arabidopsis mesophyll protoplasts. (d) Transactivation analysis with OsDREB2B2 and the trimer of NF‐YA2, NF‐YB3 and DPB3‐1, or the trimer of NF‐YA2, NF‐YB3 and OsDPB3‐2 in rice mesophyll protoplasts.
Overexpression of DPB3‐1 does not have negative effects on normal vegetative, reproductive growth or yield in rice
To examine the effects of DPB3‐1 on growth and heat stress tolerance in rice, DPB3‐1‐overexpressing rice plants were generated (Ubi:DPB3‐1‐a, b, c; Figure 5a). The vegetative growth of the DPB3‐1‐overexpressing rice was compared to that of vector control plants at several developmental stages under nonstress conditions (Figure 5b,c, also see Figure S3a–d). No visible phenotypic differences were observed between the transgenic and control plants, and there were no differences in the heading date (Figure 5d). We measured the yield parameters of the DPB3‐1‐overexpressing rice under nonstress conditions. The tiller, panicle and effective grain numbers per plant of the DPB3‐1‐overexpressing rice were not significantly different from those of the vector control rice (Table 1, also see Figure S4a). The seed morphology was also not significantly changed in response to DPB3‐1 overexpression (Table 1, also see Figure S4a,b). These data suggest that the overexpression of DPB3‐1 in rice does not have negative effects on plant vegetative growth and reproductive development under nonstress conditions.
Figure 5.
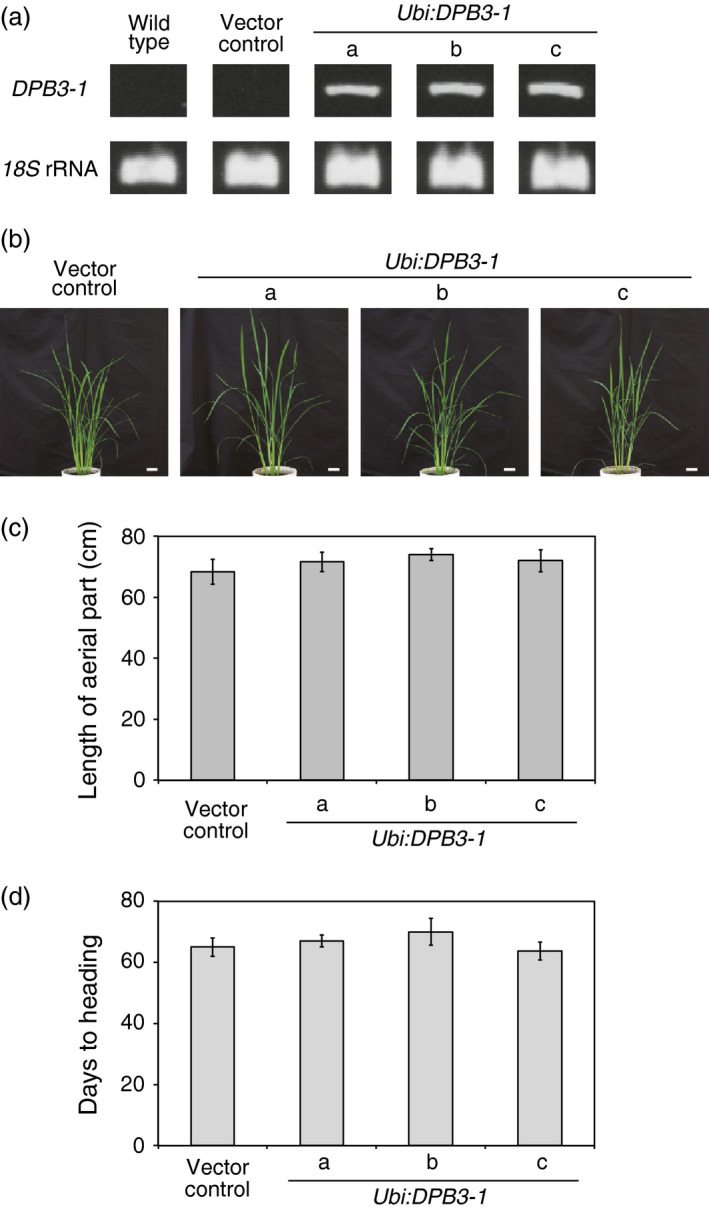
Phenotype of DPB3‐1‐overexpressing rice under nonstress conditions. (a) Confirmation of the expression of DPB3‐1 in wild‐type, vector control and Ubi:DPB3‐1 plants by RT‐PCR analysis. 18S rRNA was amplified as an internal control. The primers used for PCR are shown in Table S11. (b) Growth of DPB3‐1‐overexpressing plants under normal conditions. Photographs of 50‐day‐old plants are shown. Scale bars represent 5 cm. (c) Average length of the aerial portion of the vector control and DPB3‐1‐overexpressing plants calculated from the plants grown as in (b). The error bars indicate the SD (n = 12). The data were evaluated using one‐way ANOVA, and no significant differences were detected (P > 0.05). (d) Average days to heading in the vector control and DPB3‐1‐overexpressing plant under normal conditions. Days to heading were scored from sowing to emergence of panicles from the main culms. The error bars indicate the SD (n = 12). The data were evaluated using one‐way ANOVA, and no significant differences were detected (P > 0.05).
Table 1.
Yield parameters of vector control and DPB3‐1‐overexpressing rice under nonstress conditions
| Traits | Vector control (%) | Ubi:DPB3‐1‐a (%) | Ubi:DPB3‐1‐b (%) |
|---|---|---|---|
| Tiller number per plant | 31 ± 5 (100) | 36 ± 3 (117) | 28 ± 2 (92) |
| Panicle number per plant | 27 ± 5 (100) | 30 ± 4 (111) | 26 ± 2 (94) |
| Effective grain number per plant | 516 ± 136 (100) | 518 ± 146 (100) | 594 ± 127 (115) |
| Grain length (mm) | 4.9 ± 0.2 (100) | 5.0 ± 0.2 (102) | 4.7 ± 0.2 (96) |
| Grain width (mm) | 2.8 ± 0.1 (100) | 2.7 ± 0.1 (95) | 2.6 ± 0.1 (93) |
| Grain thickness (mm) | 2.0 ± 0.2 (100) | 2.1 ± 0.2 (104) | 2.1 ± 0.2 (104) |
| 1000‐grain weight (g) | 45.7 ± 2.3 (100) | 45.0 ± 2.1 (99) | 44.7 ± 3.7 (98) |
Various parameters involved in the yield and seed morphology were measured. Values represent the means and SD (n = 12). Relative percentages are shown in brackets. The data were evaluated using one‐way ANOVA, and no significant differences were detected (P > 0.05).
DPB3‐1‐overexpressing rice exhibit enhanced heat stress tolerance
We evaluated whether DPB3‐1‐overexpressing rice possessed enhanced heat stress tolerance. The vector control and DPB3‐1‐overexpressing plants were subjected to heat stress at 55 °C for 2 h. The length of the aerial portion of each plant was measured after 10 days under nonstress conditions. The growth of the vector control plants was clearly suppressed by heat stress even after 10 days of recovery, while the DPB3‐1‐overexpressing plants displayed significantly better growth (Figure 6a,b). Almost all of the DPB3‐1‐overexpressing plants grew to reproductive stage after heat stress treatment, while approximately half of the vector control plants did not generate reproductive organs (Figure 6c). These results suggest that the overexpression of DPB3‐1 in rice enhances heat stress tolerance and contributes to improved growth after heat stress treatment. Moreover, electrolyte leakage in the vector control and DPB3‐1‐overexpressing rice was measured to evaluate the extent of cell membrane damage after heat stress treatment. The results of the electrolyte leakage assays were similar in the vector control and DPB3‐1‐overexpressing rice under nonstress conditions; however, the DPB3‐1‐overexpressing rice maintained significantly lower levels of electrolyte leakage after heat stress treatment (42 °C, 24 h) compared with the vector control rice (Figure 6d), suggesting that the overexpression of DPB3‐1 increases heat stress tolerance at the cellular level.
Figure 6.
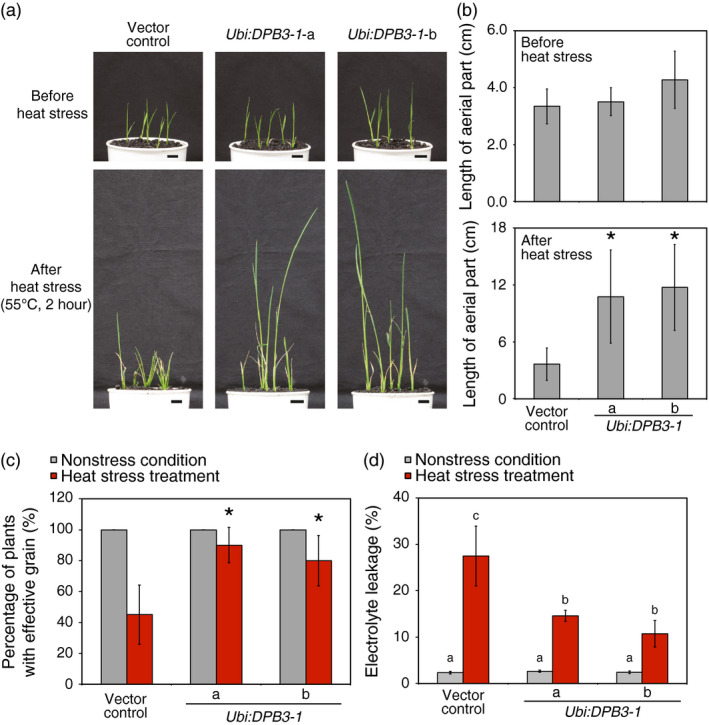
Heat stress tolerance of DPB3‐1‐overexpressing plants. (a) Photographs of plants before and after heat stress treatment. The seeds were germinated in water for 7 days at 28 °C, and after germination, the seedlings were grown on soil for 2 days. After heat stress treatment (55 °C, 2 h), the plants were grown under normal conditions. Photographs were taken before stress treatment and after a 10‐day recovery period at 28 °C. Scale bars represent 1 cm. (b) Average length of the aerial portion of the vector control and DPB3‐1‐overexpressing plants before and after heat stress treatment calculated from the plants grown as shown in (a). The error bars indicate the SD (n = 15). Asterisks indicate significant differences between the plants (P < 0.05 according to the Bonferroni‐corrected Student's t‐test). (c) Percentage of plants that grew to the reproductive stage under normal conditions or after heat stress treatment. The stress‐treated plants were grown continuously under normal conditions, and the percentages of plants that produced grains were scored. All of the plants without heat stress treatment produced grains. The error bars indicate the SD (n = 15). Asterisks indicate significant differences between the plants after heat stress treatment (P < 0.05 according to the Bonferroni‐corrected Student's t‐test). (d) Electrolyte leakage of plants with or without heat stress treatment (42 °C, 24 h). The error bars indicate the SD (n = 12). There were no significant differences between plants without heat stress (P > 0.05 according to one‐way ANOVA), and letters indicate significant differences between the plants after heat stress treatment (P < 0.05 according to Tukey's multiple range test).
The expression levels of several heat stress‐inducible genes are increased in DBP3‐1‐overexpressing rice under heat stress conditions
We analysed the expression levels of several heat stress‐inducible genes in DBP3‐1‐overexpressing plants under heat stress conditions (42 °C). A previous study revealed that the overexpression of DPB3‐1 in Arabidopsis increases the expression levels of Arabidopsis HsfA2, HsfA3 and At1g75860, the latter of which encodes an HSP20 family protein, under heat stress conditions (Sato et al., 2014). Therefore, the expression levels of several genes that encode proteins homologous to rice HsfA3, HsfA2 (Guo et al., 2008; Wang et al., 2009) and At1g75860 (Figure S5) were analysed. LOC_Os02g32590 (OsHsfA3), LOC_Os03g53340 (OsHsfA2a), LOC_Os01g39020 (OsHsfA7) and LOC_Os03g12370 (OsHsfA9) were examined as HsfA family genes, and LOC_Os01g04370, LOC_Os03g15960 and LOC_Os03g16020 were examined as HSP20 family genes based on their phylogenetic profiles. The expression levels of OsDREB2B1 and OsDREB2B2 were also analysed as controls. The results revealed that the expression levels of OsHsfA3, OsHsfA2a, LOC_Os03g15960 and LOC_Os03g16020 were significantly enhanced in two lines of DPB3‐1‐overexpressing plants (Ubi:DPB3‐1‐a and b) at several time points in comparison with those of the vector control, while the expression levels of OsHsfA7, OsHsfA9, LOC_Os01g04370, OsDREB2B1 and OsDREB2B2 were similar between DPB3‐1‐overexpressing and vector control plants (Figure 7). It was suggested that DPB3‐1 positively regulates the expression of those up‐regulated genes under heat stress conditions in rice. The number of abiotic stress‐related cis elements, DREs, CCAAT motifs (Sato et al., 2014), heat shock elements (HSEs; Yoshida et al., 2011) and ABA‐responsive elements (ABREs; Yoshida et al., 2015) on the 1‐kb promoters of each gene is shown in Table S2. The expression levels of several heat stress‐inducible genes might be enhanced by the overexpression of DPB3‐1 through these cis elements.
Figure 7.
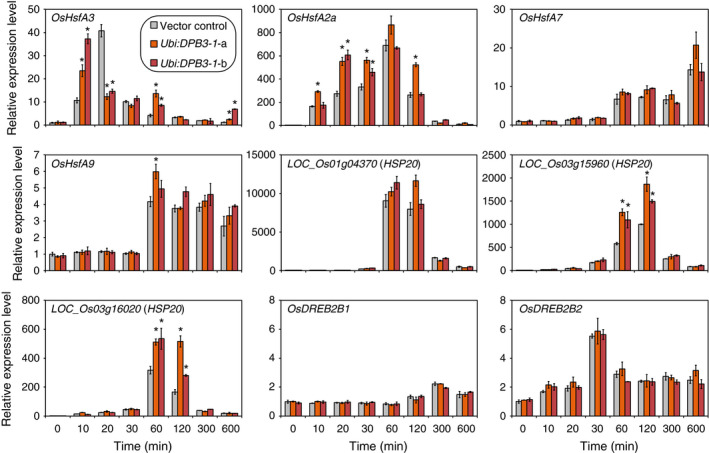
Gene expression patterns of the vector control and Ubi:DPB3‐1 plants under heat stress conditions. The expression levels of four HsfA family genes ( OsHsfA3 , OsHsfA2a , OsHsfA7 and OsHsfA9 ), three HSP20 family genes ( LOC_Os01g04370, LOC_Os03g15960 and LOC_Os03g16020) and two splicing variants of OsDREB2B in the vector control and DPB3‐1‐overexpressing plants (Ubi:DPB3‐1‐a and b) in response to heat stress conditions (42 °C) were calculated by quantitative RT‐PCR analysis. The expression levels of each gene in the vector control plants were defined as 1.0. The error bars indicate the SD (n = 3). Asterisks indicate significant differences between the plants at each time point (P < 0.05 according to the Bonferroni‐corrected Student's t‐test).
Microarray analysis reveals that the overexpression of DPB3‐1 enhances the expression levels of heat stress‐responsive genes in rice
To reveal the effects of DPB3‐1 overexpression on the rice transcriptome under control and heat stress conditions, we performed microarray analyses at 0‐ and 60‐min time points under heat stress conditions (42 °C) using vector control and DPB3‐1‐overexpressing rice (Ubi:DPB3‐1‐a). In the vector control rice, 962 and 918 genes were induced (Table S3) and repressed (Table S4), respectively, more than twofold in response to heat stress [VC (heat) vs. VC (control)]. Compared with the vector control rice, one gene was down‐regulated (Table S5) and no genes were up‐regulated more than twofold in the Ubi:DPB3‐1 plants under control conditions [Ubi:DPB3‐1 (control) vs. VC (control)]. Under heat stress conditions, however, 224 genes were up‐regulated (Table S6) and 161 genes down‐regulated (Table S7) more than twofold in Ubi:DPB3‐1 plants [Ubi:DPB3‐1 (heat) vs. VC (control)]. Among the 224 up‐regulated genes in Ubi:DPB3‐1 rice, 57 genes were heat stress‐inducible genes (Table S5). The proportion of heat stress‐inducible genes among the 224 up‐regulated genes in Ubi:DPB3‐1 rice (25%) was significantly higher than that in the entire rice genome (4%; P < 0.0001; Figure 8), while 8 among the 161 down‐regulated genes in Ubi:DPB3‐1 rice were heat stress‐suppressed genes (Table S6). There were no significant differences between the proportions of heat stress‐suppressed genes among the 161 down‐regulated genes (5%) and the entire rice genome (4%; P > 0.5; Figure S6). The expression levels of several heat stress‐inducible (Figure 9) or stress‐suppressed (Figure S7) genes identified by microarray were confirmed by quantitative RT‐PCR.
Figure 8.
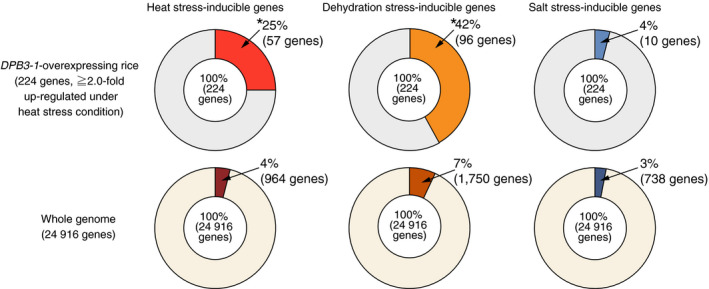
Proportions of abiotic stress‐inducible genes among the up‐regulated genes in DPB3‐1‐overexpressing rice under heat stress conditions or in the whole rice genome. The proportions of abiotic stress‐inducible genes were calculated according to the microarray analysis (Table S3) and previous papers (Maruyama et al., 2012; Venu et al., 2013). Asterisks indicate significant differences between the proportions of abiotic stress‐inducible genes among the up‐regulated genes in DPB3‐1‐overexpressing rice under heat stress conditions or in the whole rice genome (P < 0.0001, Fisher's exact test).
Figure 9.
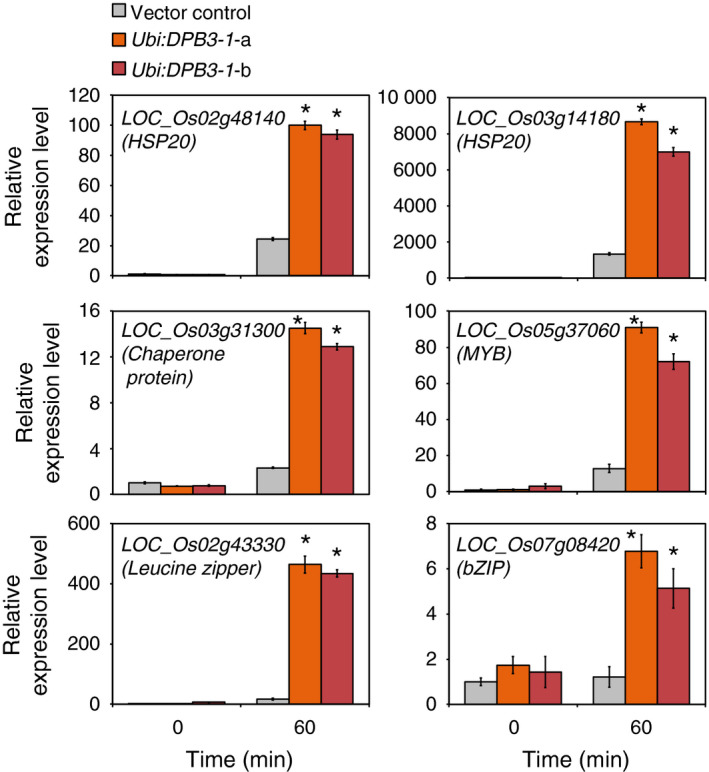
Confirmation of up‐regulated gene expression in Ubi:DPB3‐1 by microarray analysis. The expression levels of six up‐regulated genes in response to the overexpression of DPB3‐1 under heat stress conditions were analysed by quantitative RT‐PCR analysis. Five genes other than LOC_Os07g08420 ( bZIP family gene) could be induced by heat stress in the vector control rice. The expression levels of each gene in the vector control plants were defined as 1.0. The error bars indicate the SD (n = 3). Asterisks indicate significant differences between the plants at each time point (P < 0.05 according to the Bonferroni‐corrected Student's t‐test).
We also performed gene ontology (GO) enrichment analysis using the GO term enrichment tool available at the Gene Ontology Consortium (http://geneontology.org/; Blake et al., 2013; Gene Ontology Consortium, 2015). When the 224 up‐regulated genes were compared to the Oryza sativa genome background, we found that the term ‘response to heat’ was significantly enriched (P < 0.001; Table S8). This result coincides with a significant increase in heat stress‐inducible genes in the up‐regulated genes in Ubi:DPB3‐1 rice. The GO analysis using the 161 down‐regulated genes in Ubi:DPB3‐1 under heat stress conditions revealed the significant enrichment of terms related to several metabolic processes (P < 0.001; Table S9).
To analyse the expression patterns of genes affected by the overexpression of DPB3‐1 under heat stress conditions, a metaprofile analysis was performed using a public microarray database (Genevestigator; https://genevestigator.com/gv/) based on the top 100 up‐regulated or down‐regulated genes in Ubi:DPB3‐1 plants in response to heat stress conditions. The results indicated that many of the genes that were up‐regulated in Ubi:DPB3‐1 were induced by drought as well as heat stress treatment (Figure S8a). The results also revealed that many of the genes that were up‐regulated in Ubi:DPB3‐1 plants under heat stress conditions were down‐regulated in germination (Figure S8a), while the genes that were down‐regulated in Ubi:DPB3‐1 plants showed the opposite trend (Figure S8b). In comparison with a previous transcriptome analysis of rice treated with dehydration stress, we found that 96 genes among the 224 up‐regulated genes were induced in response to dehydration stress (Maruyama et al., 2012). The proportions of these drought stress‐inducible genes among the 224 up‐regulated genes (42%) were significantly higher than their proportions in the entire Oryza sativa genome (7%; P < 0.0001), while the proportion of salt stress‐inducible genes among the 224 up‐regulated genes (4%) did not differ significantly from that of the entire Oryza sativa genome (3%; P > 0.1; Venu et al., 2013; Figure 8).
To reveal the mechanisms by which DPB3‐1 controls the expression levels of its target genes under heat stress conditions, we compared the frequency of each hexamer sequence in the promoter of the top 100 up‐regulated or down‐regulated genes in DBP3‐1‐overexpressing rice in response to heat stress conditions with their normalized frequencies in the promoters of the entire Oryza sativa genome. The Z‐scores of all hexamer sequences are presented in scatter plots. In the promoters of the up‐regulated genes in DPB3‐1‐overexpressing plants, the ABRE sequence (ACGTGT) was the most conserved sequence, and other ABRE (CCACGT) and ABRE‐like sequences (GCCACG and CGTGTC) were highly conserved (Figure S8c). The G box sequence (CACGTG), coupling element 3 (CE3; CACGCG) and CE3‐like sequences (ACGCGT) were also highly conserved in the up‐regulated genes (Figure S8c). However, these cis elements were not conserved in the down‐regulated genes in Ubi:DPB3‐1 plants (Figure S8d). The ABRE was identified on the promoter of ABA‐responsive genes, and bZIP transcription factors are thought to bind to these sequences (Fujita et al., 2005; Yang et al., 2011; Yoshida et al., 2015). Moreover, the bZIP transcription factors also bound to the G box (De Jong, 2013; Jakoby et al., 2002), and CE3 has been reported to strongly co‐localize with the ABRE motif on rice promoters of ABA‐ or drought‐responsive genes (Gómez‐Porras et al., 2007; Maruyama et al., 2012). These results suggest that DPB3‐1 positively regulates the transcriptional activation of bZIP transcription factors as a coactivator or that DPB3‐1 increases the expression levels of genes encoding a bZIP transcription factor as a downstream target (Table S6; Figure 9). Considering the enhanced expression levels of drought stress‐inducible genes in Ubi:DPB3‐1 rice under heat stress conditions and the significant enrichment of ABRE‐related cis elements on the promoters of up‐regulated genes, we evaluated the drought stress tolerance of Ubi:DPB3‐1 rice. However, there were no differences between the vector control and Ubi:DPB3‐1 plants in terms of plant growth, leaf wilting and electrolyte leakage after drought stress treatment (Figure S9a,b).
We also assessed the frequency of the DRE, CCAAT and HSE motifs in the promoters of the top 100 up‐regulated genes in DPB3‐1‐overexpressing plants under heat stress conditions. One of the DRE motifs (ACCGAC) was relatively highly conserved (Z‐score > 3, P < 0.001) among the DRE sequences (Table S10). However, the CCAAT and HSE motifs were not significantly enriched in the promoters of the up‐regulated genes in Ubi:DPB3‐1 rice. It is possible that DPB3‐1 interacts with OsDREB2B2 and positively regulates its transcriptional activity. They may then enhance the expression levels of target genes through the DRE (ACCGAC) sequences in the promoters of rice under heat stress conditions.
Discussion
Losses of crop production as a consequence of extreme heat stress events have been reported in various regions of the world (Ciais et al., 2005; Smith and Katz, 2013; Tian et al., 2009). The generation of heat‐tolerant crops by genetic engineering is a key challenge to improving global food security. The utility of DPB3‐1 was suggested in a previous study because the overexpression of DPB3‐1 improved heat stress tolerance in Arabidopsis without growth retardation. In the present study, we generated DPB3‐1‐overexpressing transgenic rice and evaluated tolerance to heat stress. DPB3‐1‐overexpressing rice displayed enhanced heat stress tolerance compared to vector control rice (Figure 6a,b). Moreover, a greater proportion of DPB3‐1‐overexpressing rice plants grew to the reproductive stage after the heat stress treatment (Figure 6c). Because the overexpression of DPB3‐1 showed no negative effects on vegetative and reproductive growth or yield in rice under control conditions (Figure 5; Table 1, and also see Figures S3 and S4), the DPB3‐1 gene was considered to be a useful target for generating crops with enhanced heat stress tolerance.
One of the advantages associated with increasing heat stress tolerance via DPB3‐1 is the high conservation of DPB3 family proteins among land plants. A previous study revealed that DPB3‐1 belongs to a monophyletic subgroup that is conserved among land plants, including rice and soya bean (Sato et al., 2014). The rice gene OsDPB3‐2 also had heat stress‐inducible expression similar to DPB3‐1 in Arabidopsis (Figure 1). This result suggests that DPB3‐1 and its homologues share similar functions in land plants. Interaction and transactivation analyses using DREB2 family proteins in rice and soya bean further support this hypothesis (Figures 1, 2, 3). These findings raise the possibility of increasing heat stress tolerance in various crop plants, including soya bean, by overexpressing DPB3‐1. Moreover, further analyses of DPB3‐1 homologues in rice, soya bean (GmDPB3‐3; Glyma12g07390, GmDPB3‐4; Glyma11g20740) and other plants will reveal conserved roles and species‐specific functions of DPB3 family proteins. OsDPB3‐2 showed specific expression profiles (Figure 1), and the trimer including OsDPB3‐2 enhanced the transcriptional activity of OsDREB2B2 more than the trimer including DPB3‐1 (Figure 4d). A comparison of heat stress tolerances between Ubi:DPB3‐1 and Ubi:OsDPB3‐2 rice should provide interesting insight into the enhancement of heat stress tolerance in monocots.
Our approach is unique in that DPB3‐1 is not a transcriptional activator; instead, it acts as a coactivator. The DPB3‐1 protein itself does not possess transcriptional activity. Therefore, the overexpression of DPB3‐1 had almost no effect on gene expression patterns under nonstress conditions (Table S5). The DPB3‐1 protein affected gene expression only in the presence of its interacting transcription activators, which were induced under heat stress conditions (Tables S6 and S7). This characteristic of DPB3‐1 should be advantageous in agricultural applications. The overexpression of functional transcriptional activators often causes unexpected and negative effects on plant growth and agricultural productivity under normal growth conditions (Ito et al., 2006; Tang et al., 2012; Wu et al., 2009a). DPB3‐1 and its homologous proteins should be useful in enhancing heat stress tolerance in crops without growth retardation.
A microarray analysis of DPB3‐1‐overexpressing rice under heat stress conditions clearly indicated that the overexpression of DPB3‐1 contributed to heat stress tolerance through enhanced gene expression of many heat stress‐inducible genes (Figure 8; Table S6). Moreover, GO analysis also confirmed that the heat stress‐related genes were significantly enriched among the up‐regulated genes (Table S8). However, the GO analysis suggested that genes related to primary metabolic processes were enriched among the down‐regulated genes in the DPB3‐1‐overexpressing plants (Table S9), and the expression profile analysis revealed that many of the down‐regulated genes in DPB3‐1‐overexpressing rice under heat stress conditions were induced during germination (Figure S8b). Numerous previous works have suggested that there is a trade‐off relationship between the stress response and growth in plants (Koehler et al., 2012; Lozano‐Durán et al., 2013; Zhang et al., 2014). It is possible that the suppression of metabolic‐ or growth‐related genes under heat stress conditions might contribute to the enhanced heat stress tolerance, but further analysis is required to reveal the effect of the down‐regulated genes during heat stress in DPB3‐1‐overexpressing rice.
In a previous work, DPB3‐1 was identified as a coactivator of DREB2A under heat stress conditions (Sato et al., 2014). Similarly, DPB3‐1 interacted with OsDREB2B2 (Figures 2 and 3) and significantly increased reporter activity in rice protoplasts together with OsDREB2B2 (Figure 4). Moreover, our over‐representation analysis of all hexamers revealed that the DRE sequence (ACCGAC) was highly enriched on the promoters of the up‐regulated genes in DPB3‐1‐overexpressing rice under heat stress conditions (Table S10). Quantitative RT‐PCR also indicated that the expression levels of genes homologous to DREB2A target genes in Arabidopsis were significantly enhanced in DPB3‐1‐overexpressing rice, and DRE sequences were found in their promoters (Figure 7; Table S2). DPB3‐1 was predicted to enhance the transcriptional activity of OsDREB2B2 and increase the expression levels of its target genes through DRE. The future identification of OsDREB2B2 target genes under heat stress conditions by microarray or ChIP‐seq analyses might aid in assessing the detailed role of OsDREB2B2 and DPB3‐1 during the heat stress response in rice.
Our microarray analysis also suggested that the overexpression of DPB3‐1 enhanced heat stress tolerance through unknown transcription factors other than OsDREB2B2. The promoter analysis clearly indicated that ABRE and ABRE‐related cis elements were highly conserved in the up‐regulated genes in DPB3‐1‐overexpressing rice under heat stress conditions (Figure S8c). The ABRE motif is known to be recognized by several bZIP transcription factors in plants (Fujita et al., 2005; Yang et al., 2011; Yoshida et al., 2015). These results suggest that DPB3‐1 positively regulates bZIP transcription factors under heat stress conditions. Our microarray analysis of vector control rice (Table S3) and several previous studies (Jung et al., 2012; Zhang et al., 2013) indicate that bZIP family genes are induced under heat stress conditions. These heat stress‐responsive bZIP transcription factors might be candidates for the cofactor of DPB3‐1. The search for novel interacting bZIP transcription factors with DPB3‐1 may be necessary to reveal the mechanisms by which DPB3‐1 increases heat stress tolerance in rice.
Although our results clearly demonstrate that the overexpression of DPB3‐1 enhances heat stress tolerance in rice without growth retardation, additional experiments are important to confirm its usability for agricultural applications. First, the heat stress response and tolerance of reproductive stages should be analysed in future studies. Many previous works have reported that plants are more sensitive to abiotic stresses, including high temperature, during the reproductive stage (Kim et al., 2001; Omae et al., 2012; Tunc‐Ozdemir et al., 2013; Zinn et al., 2010). The expression profiles of HSF, HSP and DREB family genes were conserved between the vegetative and reproductive stages in rice, and the ABRE motif has been suggested to be important for gene induction in response to heat stress in reproductive organs (Chauhan et al., 2011; Jagadish et al., 2010; Zhang et al., 2012). These data imply that the overexpression of DPB3‐1 may also confer enhanced heat stress tolerance during reproductive stages. Furthermore, microarray analysis revealed that the expression levels of drought stress‐responsive genes were also enhanced in the DPB3‐1‐overexpressing rice under heat stress conditions (Figure 8 and Figure S8a); however, there were no significant differences between the vector control and DPB3‐1‐overexpressing rice in response to drought stress alone (Figure S9), which suggests that DPB3‐1 could contribute to the induction of drought stress‐responsive genes only under heat stress conditions. Previous studies have revealed that the combination of heat and drought stress had more severe effects on plant growth and development (Mittler, 2006; Rizhsky et al., 2004; Smith and Katz, 2013). Further studies are required to elucidate the mechanisms by which DPB3‐1 enhances the expression levels of drought stress‐inducible genes under heat stress conditions and whether DPB3‐1 might be a useful factor for increasing combined heat and drought stress tolerance in crops.
Experimental procedures
Plant materials, growth conditions and the generation of transgenic rice
Rice (Oryza sativa cv. Nipponbare) was grown as described previously (Ito et al., 2006) with minor modifications. After the seeds were exposed to 42 °C for 3 days, they were selected and germinated in water containing 50 mg/L hygromycin for 7–9 days at 28 °C day/25 °C night under 12‐h light/12‐h dark cycles at a photon flux density of 150 μmol/m2/s. After germination, the plants were transferred to soil in a plastic pot with a diameter of 6 cm and grown for 14 days under the conditions described above. Subsequently, the plants were transferred to a plant pot with a size of 1/50 m2 and grown at 28 °C day/25 °C night under natural light conditions. Transgenic rice was generated using Agrobacterium‐mediated transformation as described previously (Hiei et al., 1994). T1 and T2 seeds were used for subsequent experiments.
Yeast two‐hybrid assays
Yeast two‐hybrid assays were performed as described in the user manual supplied with the Matchmaker Gold Two‐Hybrid System using strain AH109 (Clontech, Palo Alto, CA, USA).
Transient expression in Arabidopsis and rice mesophyll protoplasts
Transient transformation of Arabidopsis and rice mesophyll protoplasts was performed as described previously (Chen et al., 2006; Yoo et al., 2007). Fluorescence observation using Arabidopsis or rice mesophyll protoplasts and transactivation assays using Arabidopsis protoplasts were performed as described previously (Sato et al., 2014). The transactivation assays using rice protoplasts were performed with minor modifications compared with the Arabidopsis protoplasts. The transformed rice protoplasts were disrupted in 50 μL of lysis buffer [50 mm Tris‐HCl (pH 7.5), 30% (v/v) glycerol and 10 mm 2‐mercaptoethanol] with a vortex mixer, and the solution was centrifuged at 20 000 g for 5 min. Luciferase activity was measured with a Picagene BrillianStar‐LT Luminescence Kit (Toyo B‐Net, Tokyo, Japan) according to the user manual. For the GUS assays, 30 μL of the protoplast lysate was added to 30 μL of reaction buffer [50 mm Tris‐HCl (pH 7.5), 30% (v/v) glycerol, 10 mm 2‐mercaptoethanol and 0.04% (w/v) MU glucuronide] and incubated at 37 °C for 2 h. To stop the reaction, 60 μL of 1 m Na2CO3 was added to the mixture, and LUC luminescence and MU fluorescence were measured using an ARVO MX plate reader (Perkin‐Elmer, Waltham, MA, USA).
Heat and dehydration stress treatments
For the heat stress tolerance test, 9‐day‐old plants on soil were subjected to 55 °C for 2 h in an incubator (Yamato Scientific Co., Tokyo, Japan). For the electrolyte leakage assays, 16‐day‐old plants on soil were transferred to 42 °C for 24 h in an incubator. For the gene expression analysis, 9‐day‐old plants in sterilized water were transferred to an incubator at 42 °C for heat stress treatment; plants were transferred to petri dishes for dehydration stress treatment.
RNA preparation and analysis of gene expression
Total RNA was isolated from 9‐day‐old plants using RNAiso plus (TaKaRa, Otsu, Shiga, Japan) according to the supplier's instructions. Syntheses of cDNA and quantitative RT‐PCR analysis were conducted as described previously (Sato et al., 2014).
Microarray analysis
Microarray analysis was performed using a custom gene expression microarray for rice (Maruyama et al., 2014; Agilent Technologies, Palo Alto, CA, USA) as described previously (Mizoi et al., 2013) with minor modifications. Total RNA (200 ng) was labelled with a Low Input Quick Amp Labeling Kit (Agilent Technologies), and two sets of microarray analysis were performed using a Cy3 and Cy5 dye swap. After hybridization, the microarray slides were scanned with a G2505 scanner using scan control software, version A.8.4 (Agilent Technologies) and processed using Feature Extraction software (11.5.1.1; Agilent Technologies). Integration, normalization and statistical analysis of the data were performed using Subio Platform 1.16 (Subio, Tokyo, Japan), and global normalization of the ratios was performed using the Lowess method. The P‐values for differences in gene expression were corrected according to the Benjamini Hochberg false discovery rate (FDR) method, and probes with a P‐value of less than 0.05 were used for the analysis. Because the array was designed according to a former gene mode, probes that perfectly matched current gene models were used for the analysis (release 7 of the MSU Rice Genome Annotation Project). All of the microarray data are available at array express (http://www.ebi.ac.uk/arrayexpress/) under accession numbers E‐MTAB‐3756.
Electrolyte leakage assays
Electrolyte leakage assays were performed as described previously (Lee et al., 2007) with modifications. One gram of rice leaves was cut into a width of 5 cm and submerged into 10 mL of sterilized water, and the samples were incubated at room temperature for 3 h with gentle rotation. The electrical conductivity of the solution with (E a ) or without (E b ) rice leaves was measured after incubation. Next, the samples were autoclaved, and the electrical conductivity of the solution with (E 1) or without (E 2) rice leaves was measured again. The relative electrolyte leakage was calculated according to the following formula: (E a − E b )/(E 1 − E 2) × 100 (%).
Supporting information
Table S1 Yield parameters of the vector control and DPB3‐1‐overexpressing Arabidopsis under nonstress conditions.
Table S2 Number of cis elements on the promoters of genes which expression levels were analysed in Figure 6.
Table S3 Up‐regulated genes in the vector control rice under the heat stress condition.
Table S4 Down‐regulated genes in the vector control rice under the heat stress condition.
Table S5 Down‐regulated gene in DPB3‐1‐overexpressing rice under the nonstress condition.
Table S6 Up‐regulated gene in DPB3‐1‐overexpressing rice under the heat stress condition.
Table S7 Down‐regulated gene in DPB3‐1‐overexpressing rice under the heat stress condition.
Table S8 GO analysis of the genes up‐regulated in the DPB3‐1‐overexpressing plants under the heat stress condition.
Table S9 GO analysis of the genes down‐regulated in the DPB3‐1‐overexpressing plants under the heat stress condition.
Table S10 Overrepresentation analysis of DRE, CCAAT and HSE sequences in the promoters of the top 100 up‐regulated genes in Ubi:DPB3‐1 rice under the heat stress condition.
Table S11 Sequences of primers used in this study.
Figure S1 Phenotypes of the vector control and DPB3‐1‐overexpressing Arabidopsis under non‐stress conditions after ripening.
Figure S2 Alignment of DREB2A, OsDREB2B2 and GmDREB2A;2.
Figure S3 Additional phenotypic analysis of the DPB3‐1‐overexpressing rice under nonstress conditions.
Figure S4 Plant phenotype and seed morphology of the DPB3‐1‐overexpressing rice after desiccation.
Figure S5 Phylogenetic tree lf HSP20 family proteins in Arabidopsis thaliana and Oryza sativa based on amino acids sequences of the conserved domain.
Figure S6 Proportions of abiotic stress‐repressive genes among the down‐regulated genes in the DPB3‐1‐overexpressing rice under heat stress condition or rice whole genome.
Figure S7 Confirmation of down‐regulated gene expression in Ubi:DPB3‐1 identified by microarray analysis.
Figure S8 Microarray analysis of up‐regulated or down‐regulated genes in Ubi:DPB3‐1 plants under heat stress conditions.
Figure S9 Drought stress tolerance of the DPB3‐1‐overexpressing rice.
Acknowledgements
We thank Y. Tanaka and S. Murasaki for technical assistance and E. Toma for editorial assistance. This work was supported by a Grants‐in‐Aid for JSPS Fellows (25‐4185 to H.S.), Scientific Research on Innovative Areas (no. 15H05960 to K. Y.‐S.) and Scientific Research (A) (no. 25251031 to K. Y.‐S.) from the Ministry of Education, Culture, Sports, Science and Technology of Japan. This research was also supported by the Program for the Promotion of Basic Research Activities for Innovative Biosciences (BRAIN) of Japan (to K. Y.‐S.).
References
- Ashraf, M. and Hafeez, M. (2004) Thermotolerance of pearl millet and maize at early growth stages: growth and nutrient relations. Biol. Plant. 48, 81–86. [Google Scholar]
- Blake, J.A. , Dolan, M. , Drabkin, H. , Hill, D.P. , Li, N. , Sitnikov, D. , Bridges, S. et al. (2013) Gene Ontology annotations and resources. Nucleic Acids Res. 41, D530–D535. [DOI] [PMC free article] [PubMed] [Google Scholar]
- Chauhan, H. , Khurana, N. , Agarwal, P. and Khurana, P. (2011) Heat shock factors in rice (Oryza sativa L.): genome‐wide expression analysis during reproductive development and abiotic stress. Mol. Genet. Genomics, 286, 171–187. [DOI] [PubMed] [Google Scholar]
- Chen, S. , Tao, L. , Zeng, L. , Vega‐Sanchez, M.E. , Umemura, K. and Wang, G.L. (2006) A highly efficient transient protoplast system for analyzing defence gene expression and protein–protein interactions in rice. Mol. Plant Pathol. 7, 417–427. [DOI] [PubMed] [Google Scholar]
- Ciais, P. , Reichstein, M. , Viovy, N. , Granier, A. , Ogée, J. , Allard, V. , Aubinet, M. et al. (2005) Europe‐wide reduction in primary productivity caused by the heat and drought in 2003. Nature, 437, 529–533. [DOI] [PubMed] [Google Scholar]
- De Jong, A.T.‐J. (2013) Interaction of bZIP and bHLH transcription factors with the G‐box. Doctoral Dissertation. Toronto, Canada: University of Toronto. [Google Scholar]
- Deryng, D. , Conway, D. , Ramankutty, N. , Price, J. and Warren, R. (2014) Global crop yield response to extreme heat stress under multiple climate change futures. Environ. Res. Lett. 9, 034011. [Google Scholar]
- Foreman, J. , Johansson, H. , Hornitschek, P. , Josse, E.M. , Fankhauser, C. and Halliday, K.J. (2011) Light receptor action is critical for maintaining plant biomass at warm ambient temperatures. Plant J. 65, 441–452. [DOI] [PubMed] [Google Scholar]
- Fujita, Y. , Fujita, M. , Satoh, R. , Maruyama, K. , Parvez, M.M. , Seki, M. , Hiratsu, K. et al. (2005) AREB1 is a transcription activator of novel ABRE‐dependent ABA signaling that enhances drought stress tolerance in Arabidopsis . Plant Cell, 17, 3470–3488. [DOI] [PMC free article] [PubMed] [Google Scholar]
- Gene Ontology Consortium . (2015) Gene Ontology Consortium: going forward. Nucleic Acids Res. 43, D1049–D1056. [DOI] [PMC free article] [PubMed] [Google Scholar]
- Gómez‐Porras, J.L. , Riaño‐Pachón, D.M. , Dreyer, I. , Mayer, J.E. and Mueller‐Roeber, B. (2007) Genome‐wide analysis of ABA‐responsive elements ABRE and CE3 reveals divergent patterns in Arabidopsis and rice. BMC Genom. 8, 260. [DOI] [PMC free article] [PubMed] [Google Scholar]
- Guo, J. , Wu, J. , Ji, Q. , Wang, C. , Luo, L. , Yuan, Y. , Wang, Y. et al. (2008) Genome‐wide analysis of heat shock transcription factor families in rice and Arabidopsis . J. Genet. Genomics, 35, 105–118. [DOI] [PubMed] [Google Scholar]
- Hasanuzzaman, M. , Nahar, K. , Alam, M.M. , Roychowdhury, R. and Fujita, M. (2013) Physiological, biochemical, and molecular mechanisms of heat stress tolerance in plants. Int. J. Mol. Sci. 14, 9643–9684. [DOI] [PMC free article] [PubMed] [Google Scholar]
- Hiei, Y. , Ohta, S. , Komari, T. and Kumashiro, T. (1994) Efficient transformation of rice (Oryza sativa L.) mediated by Agrobacterium and sequence analysis of the boundaries of the T‐DNA. Plant J. 6, 271–282. [DOI] [PubMed] [Google Scholar]
- Intergovernmental Panel on Climate Change, Working Group II (2014) Climate Change 2014: Impacts, Adaptation, and Vulnerability. https://www.ipcc-wg2.gov/index.html.
- Ito, Y. , Katsura, K. , Maruyama, K. , Taji, T. , Kobayashi, M. , Seki, M. , Shinozaki, K. et al. (2006) Functional analysis of rice DREB1/CBF‐type transcription factors involved in cold‐responsive gene expression in transgenic rice. Plant Cell Physiol. 47, 141–153. [DOI] [PubMed] [Google Scholar]
- Jagadish, S.V. , Muthurajan, R. , Oane, R. , Wheeler, T.R. , Heuer, S. , Bennett, J. and Craufurd, P.Q. (2010) Physiological and proteomic approaches to address heat tolerance during anthesis in rice (Oryza sativa L.). J. Exp. Bot. 61, 143–156. [DOI] [PMC free article] [PubMed] [Google Scholar]
- Jakoby, M. , Weisshaar, B. , Dröge‐Laser, W. , Vicente‐Carbajosa, J. , Tiedemann, J. , Kroj, T. , Parcy, F. et al. (2002) bZIP transcription factors in Arabidopsis . Trends Plant Sci. 7, 106–111. [DOI] [PubMed] [Google Scholar]
- Jung, K.‐H. , Ko, H.‐J. , Nguyen, M.X. , Kim, S.‐R. , Ronald, P. and An, G. (2012) Genome‐wide identification and analysis of early heat stress responsive genes in rice. J. Plant Biol. 55, 458–468. [Google Scholar]
- Katiyar‐Agarwal, S. , Agarwal, M. and Grover, A. (2003) Heat‐tolerant basmati rice engineered by over‐expression of hsp101. Plant Mol. Biol. 51, 677–686. [DOI] [PubMed] [Google Scholar]
- Kim, S.Y. , Hong, C.B. and Lee, I. (2001) Heat shock stress causes stage‐specific male sterility in Arabidopsis thaliana . J. Plant. Res. 114, 301–307. [Google Scholar]
- Koehler, K. , Center, A. and Cavender‐Bares, J. (2012) Evidence for a freezing tolerance‐growth rate trade‐off in the live oaks (Quercus series Virentes) across the tropical‐temperate divide. New Phytol. 193, 730–744. [DOI] [PubMed] [Google Scholar]
- Lee, D.G. , Ahsan, N. , Lee, S.H. , Kang, K.Y. , Bahk, J.D. , Lee, I.J. and Lee, B.H. (2007) A proteomic approach in analyzing heat‐responsive proteins in rice leaves. Proteomics, 7, 3369–3383. [DOI] [PubMed] [Google Scholar]
- Lobell, D.B. , Schlenker, W. and Costa‐Roberts, J. (2011) Climate trends and global crop production since 1980. Science, 333, 616–620. [DOI] [PubMed] [Google Scholar]
- Lozano‐Durán, R. , Macho, A.P. , Boutrot, F. , Segonzac, C. , Somssich, I.E. and Zipfel, C. (2013) The transcriptional regulator BZR1 mediates trade‐off between plant innate immunity and growth. Elife, 2, e00983. [DOI] [PMC free article] [PubMed] [Google Scholar]
- Maruyama, K. , Todaka, D. , Mizoi, J. , Yoshida, T. , Kidokoro, S. , Matsukura, S. , Takasaki, H. et al. (2012) Identification of cis‐acting promoter elements in cold‐ and dehydration‐induced transcriptional pathways in Arabidopsis, rice, and soybean. DNA Res. 19, 37–49. [DOI] [PMC free article] [PubMed] [Google Scholar]
- Maruyama, K. , Urano, K. , Yoshiwara, K. , Morishita, Y. , Sakurai, N. , Suzuki, H. , Kojima, M. et al. (2014) Integrated analysis of the effects of cold and dehydration on rice metabolites, phytohormones, and gene transcripts. Plant Physiol. 164, 1759–1771. [DOI] [PMC free article] [PubMed] [Google Scholar]
- Matsukura, S. , Mizoi, J. , Yoshida, T. , Todaka, D. , Ito, Y. , Maruyama, K. , Shinozaki, K. et al. (2010) Comprehensive analysis of rice DREB2‐type genes that encode transcription factors involved in the expression of abiotic stress‐responsive genes. Mol. Genet. Genomics, 283, 185–196. [DOI] [PubMed] [Google Scholar]
- Mittler, R. (2006) Abiotic stress, the field environment and stress combination. Trends Plant Sci. 11, 15–19. [DOI] [PubMed] [Google Scholar]
- Mizoi, J. , Ohori, T. , Moriwaki, T. , Kidokoro, S. , Todaka, D. , Maruyama, K. , Kusakabe, K. et al. (2013) GmDREB2A;2, a canonical DEHYDRATION‐RESPONSIVE ELEMENT‐BINDING PROTEIN2‐type transcription factor in soybean, is posttranslationally regulated and mediates dehydration‐responsive element‐dependent gene expression. Plant Physiol. 161, 346–361. [DOI] [PMC free article] [PubMed] [Google Scholar]
- Morimoto, K. , Mizoi, J. , Qin, F. , Kim, J.S. , Sato, H. , Osakabe, Y. , Shinozaki, K. et al. (2013) Stabilization of arabidopsis DREB2A is required but not sufficient for the induction of target genes under conditions of stress. PLoS One, 8, e80457. [DOI] [PMC free article] [PubMed] [Google Scholar]
- Omae, H. , Kumar, A. and Shono, M. (2012) Adaptation to high temperature and water deficit in the common bean (Phaseolus vulgaris L.) during the reproductive period. J. Bot. 2012, 1–6. [Google Scholar]
- Patel, D. and Franklin, K.A. (2009) Temperature‐regulation of plant architecture. Plant Signal. Behav. 4, 577–579. [DOI] [PMC free article] [PubMed] [Google Scholar]
- Rizhsky, L. , Liang, H. , Shuman, J. , Shulaev, V. , Davletova, S. and Mittler, R. (2004) When defense pathways collide. The response of Arabidopsis to a combination of drought and heat stress. Plant Physiol. 134, 1683–1696. [DOI] [PMC free article] [PubMed] [Google Scholar]
- Rodríguez, M. , Canales, E. and Borrás‐Hidalgo, O. (2005) Molecular aspects of abiotic stress in plants. Biotecnol. Apl. 22, 1–10. [Google Scholar]
- Rosenzweig, C. , Elliott, J. , Deryng, D. , Ruane, A.C. , Müller, C. , Arneth, A. , Boote, K.J. et al. (2014) Assessing agricultural risks of climate change in the 21st century in a global gridded crop model intercomparison. Proc. Natl Acad. Sci. USA, 111, 3268–3273. [DOI] [PMC free article] [PubMed] [Google Scholar]
- Sakuma, Y. , Maruyama, K. , Osakabe, Y. , Qin, F. , Seki, M. , Shinozaki, K. and Yamaguchi‐Shinozaki, K. (2006a) Functional analysis of an Arabidopsis transcription factor, DREB2A, involved in drought‐responsive gene expression. Plant Cell, 18, 1292–1309. [DOI] [PMC free article] [PubMed] [Google Scholar]
- Sakuma, Y. , Maruyama, K. , Qin, F. , Osakabe, Y. , Shinozaki, K. and Yamaguchi‐Shinozaki, K. (2006b) Dual function of an Arabidopsis transcription factor DREB2A in water‐stress‐responsive and heat‐stress‐responsive gene expression. Proc. Natl Acad. Sci. USA, 103, 18822–18827. [DOI] [PMC free article] [PubMed] [Google Scholar]
- Sato, H. , Mizoi, J. , Tanaka, H. , Maruyama, K. , Qin, F. , Osakabe, Y. , Morimoto, K. et al. (2014) Arabidopsis DPB3‐1, a DREB2A interactor, specifically enhances heat stress‐induced gene expression by forming a heat stress‐specific transcriptional complex with NF‐Y subunits. Plant Cell, 26, 4954–4973. [DOI] [PMC free article] [PubMed] [Google Scholar]
- Schlenker, W. and Roberts, M.J. (2009) Nonlinear temperature effects indicate severe damages to US crop yields under climate change. Proc. Natl Acad. Sci. USA, 106, 15594–15598. [DOI] [PMC free article] [PubMed] [Google Scholar]
- Singh, B.P. , Dua, V.K. , Govindakrishnan, P.M. and Sharma, S. (2013) Impact of climate change on potato. In Climate‐Resilient Horticulture: Adaptation and Mitigation Strategies ( Singh, H.C.P. , Rao, N.K.S. and Shivashankar, K.S. , eds), pp. 125–135. New Delhi: Springer. [Google Scholar]
- Smith, A.B. and Katz, R.W. (2013) US billion‐dollar weather and climate disasters: data sources, trends, accuracy and biases. Nat. Hazards, 67, 387–410. [Google Scholar]
- Tang, N. , Zhang, H. , Li, X. , Xiao, J. and Xiong, L. (2012) Constitutive activation of transcription factor OsbZIP46 improves drought tolerance in rice. Plant Physiol. 158, 1755–1768. [DOI] [PMC free article] [PubMed] [Google Scholar]
- Tian, X. , Luo, H. , Zhou, H. and Wu, C. (2009) Research on heat stress of rice in China: progress and prospect. Chin. Agric. Sci. Bull, 25, 166–168. [Google Scholar]
- Tunc‐Ozdemir, M. , Tang, C. , Ishka, M.R. , Brown, E. , Groves, N.R. , Myers, C.T. , Rato, C. et al. (2013) A cyclic nucleotide‐gated channel (CNGC16) in pollen is critical for stress tolerance in pollen reproductive development. Plant Physiol. 161, 1010–1020. [DOI] [PMC free article] [PubMed] [Google Scholar]
- Venu, R.‐C. , Sreerekha, M.V. , Madhav, M.S. , Nobuta, K. , Mohan, K.M. , Chen, S. , Jia, Y. et al. (2013) Deep transcriptome sequencing reveals the expression of key functional and regulatory genes involved in the abiotic stress signaling pathways in rice. J. Plant Biol. 56, 216–231. [Google Scholar]
- Wang, C. , Zhang, Q. and Shou, H.X. (2009) Identification and expression analysis of OsHsfs in rice. J. Zhejiang Univ. Sci. B, 10, 291–300. [DOI] [PMC free article] [PubMed] [Google Scholar]
- Wu, X. , Kishitani, S. , Ito, Y. and Toriyama, K. (2009a) Accumulation of raffinose in rice seedlings overexpressing OsWRKY11 in relation to desiccation tolerance. Plant Biotechnol. 26, 431–434. [Google Scholar]
- Wu, X. , Shiroto, Y. , Kishitani, S. , Ito, Y. and Toriyama, K. (2009b) Enhanced heat and drought tolerance in transgenic rice seedlings overexpressing OsWRKY11 under the control of HSP101 promoter. Plant Cell Rep. 28, 21–30. [DOI] [PubMed] [Google Scholar]
- Yang, X. , Yang, Y.N. , Xue, L.J. , Zou, M.J. , Liu, J.Y. , Chen, F. and Xue, H.W. (2011) Rice ABI5‐Like1 regulates abscisic acid and auxin responses by affecting the expression of ABRE‐containing genes. Plant Physiol. 156, 1397–1409. [DOI] [PMC free article] [PubMed] [Google Scholar]
- Yoo, S.D. , Cho, Y.H. and Sheen, J. (2007) Arabidopsis mesophyll protoplasts: a versatile cell system for transient gene expression analysis. Nat. Protoc. 2, 1565–1572. [DOI] [PubMed] [Google Scholar]
- Yoshida, T. , Ohama, N. , Nakajima, J. , Kidokoro, S. , Mizoi, J. , Nakashima, K. , Maruyama, K. et al. (2011) Arabidopsis HsfA1 transcription factors function as the main positive regulators in heat shock‐responsive gene expression. Mol. Genet. Genomics, 286, 321–332. [DOI] [PubMed] [Google Scholar]
- Yoshida, T. , Fujita, Y. , Maruyama, K. , Mogami, J. , Todaka, D. , Shinozaki, K. and Yamaguchi‐Shinozaki, K. (2015) Four Arabidopsis AREB/ABF transcription factors function predominantly in gene expression downstream of SnRK2 kinases in abscisic acid signalling in response to osmotic stress. Plant Cell Environ. 38, 35–49. [DOI] [PMC free article] [PubMed] [Google Scholar]
- Zhang, X. , Li, J. , Liu, A. , Zou, J. , Zhou, X. , Xiang, J. , Rerksiri, W. et al. (2012) Expression profile in rice panicle: insights into heat response mechanism at reproductive stage. PLoS One, 7, e49652. [DOI] [PMC free article] [PubMed] [Google Scholar]
- Zhang, X. , Rerksiri, W. , Liu, A. , Zhou, X. , Xiong, H. , Xiang, J. , Chen, X. et al. (2013) Transcriptome profile reveals heat response mechanism at molecular and metabolic levels in rice flag leaf. Gene, 530, 185–192. [DOI] [PubMed] [Google Scholar]
- Zhang, G.B. , Yi, H.Y. and Gong, J.M. (2014) The Arabidopsis ethylene/jasmonic acid‐NRT signaling module coordinates nitrate reallocation and the trade‐off between growth and environmental adaptation. Plant Cell, 26, 3984–3998. [DOI] [PMC free article] [PubMed] [Google Scholar]
- Zinn, K.E. , Tunc‐Ozdemir, M. and Harper, J.F. (2010) Temperature stress and plant sexual reproduction: uncovering the weakest links. J. Exp. Bot. 61, 1959–1968. [DOI] [PMC free article] [PubMed] [Google Scholar]
Associated Data
This section collects any data citations, data availability statements, or supplementary materials included in this article.
Supplementary Materials
Table S1 Yield parameters of the vector control and DPB3‐1‐overexpressing Arabidopsis under nonstress conditions.
Table S2 Number of cis elements on the promoters of genes which expression levels were analysed in Figure 6.
Table S3 Up‐regulated genes in the vector control rice under the heat stress condition.
Table S4 Down‐regulated genes in the vector control rice under the heat stress condition.
Table S5 Down‐regulated gene in DPB3‐1‐overexpressing rice under the nonstress condition.
Table S6 Up‐regulated gene in DPB3‐1‐overexpressing rice under the heat stress condition.
Table S7 Down‐regulated gene in DPB3‐1‐overexpressing rice under the heat stress condition.
Table S8 GO analysis of the genes up‐regulated in the DPB3‐1‐overexpressing plants under the heat stress condition.
Table S9 GO analysis of the genes down‐regulated in the DPB3‐1‐overexpressing plants under the heat stress condition.
Table S10 Overrepresentation analysis of DRE, CCAAT and HSE sequences in the promoters of the top 100 up‐regulated genes in Ubi:DPB3‐1 rice under the heat stress condition.
Table S11 Sequences of primers used in this study.
Figure S1 Phenotypes of the vector control and DPB3‐1‐overexpressing Arabidopsis under non‐stress conditions after ripening.
Figure S2 Alignment of DREB2A, OsDREB2B2 and GmDREB2A;2.
Figure S3 Additional phenotypic analysis of the DPB3‐1‐overexpressing rice under nonstress conditions.
Figure S4 Plant phenotype and seed morphology of the DPB3‐1‐overexpressing rice after desiccation.
Figure S5 Phylogenetic tree lf HSP20 family proteins in Arabidopsis thaliana and Oryza sativa based on amino acids sequences of the conserved domain.
Figure S6 Proportions of abiotic stress‐repressive genes among the down‐regulated genes in the DPB3‐1‐overexpressing rice under heat stress condition or rice whole genome.
Figure S7 Confirmation of down‐regulated gene expression in Ubi:DPB3‐1 identified by microarray analysis.
Figure S8 Microarray analysis of up‐regulated or down‐regulated genes in Ubi:DPB3‐1 plants under heat stress conditions.
Figure S9 Drought stress tolerance of the DPB3‐1‐overexpressing rice.