

SUMMARY
Most in vitro culture conditions are less‐than‐optimal for embryo development. Here, we used a transcriptional‐profiling database to identify culture‐induced differences in gene expression in porcine blastocysts compared to in vivo‐produced counterparts. Genes involved in glycine transport (SLC6A9), glycine metabolism (GLDC, GCSH, DLD, and AMT), and serine metabolism (PSAT1, PSPH, and PHGDH) were differentially expressed. Addition of 10 mM glycine to the culture medium (currently containing 0.1 mM) reduced the abundance of SLC6A9 transcript and increased total cell number, primarily in the trophectoderm lineage (P = 0.003); this was likely by decreasing the percentage of apoptotic nuclei. As serine and glycine can be reversibly metabolized by serine hydroxymethyltransferase 2 (SHMT2), we assessed the abundance of SHMT2 transcript as well as its functional role by inhibiting it with aminomethylphosphonic acid (AMPA), a glycine analog, during in vitro culture. Both AMPA supplementation and elevated glycine decreased the mRNA abundance of SHMT2 and tumor protein p53 (TP53), which is activated in response to cellular stress, compared to controls (P ≤ 0.02). On the other hand, mitochondrial activity of blastocysts, mtDNA copy number, and abundance of mitochondria‐related transcripts did not differ between control and 10 mM glycine culture conditions. Despite improvements to these metrics of blastocyst quality, transfer of embryos cultured in 10 mM glycine did not result in pregnancy whereas the transfer of in vitro‐produced embryos cultured in control medium yielded live births. Mol. Reprod. Dev. 83: 246–258, 2016. © 2016 The Authors.
Abbreviations
- AMPA
aminomethylphosphonic acid
- mtDNA
mitochondrial DNA
- MU1
porcine zygote medium 3 plus 1.69 mM arginine
- TUNEL
terminal deoxynucleotidyl transferase dUTP nick end labeling
Genes
- AMT
aminomethyltransferase, glycine cleavage T
- ATIC
5‐aminoimidazole‐4‐carboxamide ribonucleotide formyltransferase/IMP BAD, B‐cell CLL/lymphoma 2‐associated agonist of cell death
- CCNB1
cyclin B1
- CCND3
cyclin D3
- DLD
dihydrolipoamide dehydrogenase
- GCSH
glycine cleavage system protein H
- GLDC
glycine dehydrogenase (decarboxylating)
- GPX6
gluthatione peroxidase 6
- GSS
glutathione synthetase
- IMMT
inner membrane protein, mitochondrial
- MFN2
mitofusin 2
- MTHFD1[L]
methylenetetrahydrofolate dehydrogenase (NADP+ dependent) 1, methenyltetrahydrofolate cyclohydrolase, formyltetrahydrofolate synthetase [like]
- PAM16
presequence translocase‐associated motor 16 homolog
- PARP2
poly(ADP‐ribose) polymerase 2
- PINK1
PTEN induced putative kinase 1
- PCNA
proliferating‐cell nuclear antigen
- PHGDH
phosphoglycerate dehydrogenase
- PSAT1
phosphoserine aminotransferase
- PSPH
phosphoserine phosphatase 1
- SHMT2
serine hydroxymethyltransferase 2
- SLC6A9
solute carrier family 6 member 9
- SMUG1
single‐strand‐selective monofunctional uracil‐DNA glycosylase 1
- SSBP1
single stranded DNA binding protein 1, mitochondrial
- TP53
tumor protein p53
- TXNRD1
thioredoxin reductase 1
INTRODUCTION
In vitro embryo culture environments remain suboptimal to those found in vivo. The process of oocyte maturation and subsequent embryo culture, in particular, is inefficient for producing developmentally competent embryos. While in vitro‐produced embryos do develop under sub‐standard conditions, these environments have negative consequences on development. For example, high rates of loss occur for many mammalian embryos, with up to 80% of in vitro‐matured and inseminated oocytes failing to progress to the blastocyst stage (Watson et al., 2004). Recent adaptations have been made to culture systems that improve embryo development and subsequent in vivo development (Bauer et al., 2010a,2010b; Spate et al., 2010; Lee et al., 2013; Redel et al., 2015; Spate et al., 2015), but these improvements have not kept up with the demands associated with the increasing use of nuclear transfer and genetic editing technology to produce animal models for human clinical applications, such as for xenotransplantation and cystic fibrosis (Lai et al., 2002; Rogers et al., 2008), and to protect agricultural animal production by creating pigs resistant to the porcine reproductive and respiratory syndrome virus (Whitworth et al., 2016).
One approach to improve in vitro culture conditions is to identify the metabolic requirements of preimplantation embryos so the culture environment can be tailored to increase the number and viability of embryos that develop to the blastocyst stage, and will lead to subsequent offspring. Mammalian preimplantation embryos are proposed to utilize metabolism similar to that of many cancers—for example, the Warburg Effect, which favors anaerobic glycolysis involving lactic acid‐dependent production of ATP rather than oxidative glycolysis involving pyruvate (Krisher and Prather 2012; Redel et al., 2012). This hypothesis stems from the rapid proliferation of cells that is a hallmark of both cancer and preimplantation embryos, and provided a framework to better understand the metabolism of preimplantation embryos.
Glycine, a non‐essential amino acid, is an essential precursor for the synthesis of proteins and nucleic acids, and is required for the rapid proliferation of cells. Indeed, Jain et al. (2012) found that glycine consumption correlated with proliferation rates of 60 human cancer cell lines, based on the metabolic profile of their spent media. Thus, the glycine demand likely exceeds the endogenous capacity of these highly proliferative cancer cells to de novo synthesize glycine. Zhang et al. (2012) also found that tumor‐initiating cells rely on glycine metabolism, and that glycine decarboxylase (GLDC) activity can drive tumorigenesis. The hypothesized shared metabolic profiles between proliferating cancer cells and preimplantation embryos was reinforced by the number of genes predicted to be involved with glycine metabolism, as identified by RNA sequencing, that were found to be mis‐regulated in in vitro‐cultured embryos compared to their in vivo counterparts (Table 1) (Bauer et al., 2010a). We therefore focused on the effects of glycine on embryo development, specifically addressing how glycine supplementation to our culture medium affects development, alters gene expression, and affects mitochondrial function. We further asked how glycine contributes to development by culturing embryos with aminomethylphosphonic acid (AMPA), a glycine analog that inhibits serine hydroxymethyl transferase 2 (SHMT2), thereby reducing the catalysis of glycine to serine. Finally, embryo transfers were conducted to assess the potential of blastocysts created by glycine‐supplemented culture to implant and produce offspring.
Table 1.
Relative Abundance of Message for Selected Genes in Day‐6 Blastocysts Cultured In Vitro or Produced In Vivo
| Number of aligned reads (mean ± standard error) | |||
|---|---|---|---|
| Glycine‐related genes | In vitro | In vivo | P‐value |
| Solute carrier family 6 member 9 (SLC6A9) | 46.6 ± 4.2 | 1.7 ± 0.6 | 0.003 |
| Glycine dehydrogenase (GLDC) | 127.8 ± 24.3 | 241.5 ± 35.3 | 0.002 |
| Aminomethyltransferase, glycine cleavage T (AMT) | 128.1 ± 13.2 | 248.9 ± 26.3 | 0.02 |
| Glycine cleavage system protein H (GCSH) | 563.9 ± 240.3 | 1047.1 ± 50.2 | 0.13 |
| Dihydrolipoamide dehydrogenase (DLD) | 297.7 ± 59.2 | 503.7 ± 47.2 | 0.07 |
| Phosphoglycerate dehydrogenase (PHGDH) | 249.8 ± 64.7 | 12.6 ± 9.4 | 0.05 |
| Phosphoserine phosphatase 1 (PSPH) | 61.3 ± 2.8 | 1.5 ± 0.7 | 0.003 |
| Phosphoserine aminotransferase (PSAT1) | 188.5 ± 46.3 | 1.1 ± 0.6 | 0.06 |
RNA sequencing data were normalized, from Bauer et al. (2010a).
RESULTS
Effect of Glycine on Embryo Development
A study by Li et al. (2007) previously revealed that glycine concentrations ranged from 1.7 mM to 5.4 mM in porcine oviductal and uterine fluid on Days 3 and 5 post‐insemination. Our current culture medium (MU1, porcine zygote medium 3 containing 1.69 mM arginine; the control condition) is formulated to have a 0.1 mM glycine, so we first tested if additional glycine affected in vitro embryo development. Glycine supplementation did not improve the percent of presumptive zygotes that developed to the blastocyst stage compared to the basal concentration of 0.1 mM glycine (Fig. 1); however, increasing glycine concentrations (≥5 mM) resulted in blastocyst rates that were indistinguishable from suboptimal conditions without any glycine (0 mM).
Figure 1.
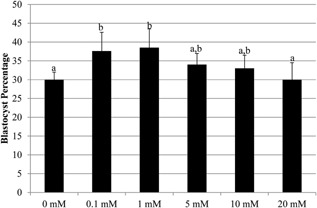
Percentage of embryos developing to the blastocyst stage after culture in different concentrations of glycine. Values were determined from 7 replicates (0, 0.1, 1, 5, and 10 mM treatments; n = 298 embryos per treatment) or 5 replicates (20 mM glycine; n = 218 embryos). Data show mean ± standard error. Different letters indicate statistical differences (P < 0.05).
A significant increase in the number of nuclei in Day‐6 blastocysts was observed when embryos were cultured with 5 mM, 10 mM, or 20 mM glycine compared to controls (Fig. 2; Table 2). Specifically, embryos cultured in 10 mM glycine tended to have the highest number of nuclei, with an average of 72 per blastocyst. There was no difference in the number of nuclei associated with the inner cell mass among treatments, whereas the number of trophectoderm nuclei and the trophectoderm‐to‐inner‐cell‐mass ratio was higher for embryos cultured with 10 mM glycine (MU1 + 10 mM glycine) (Table 2). Thus, in vitro glycine supplementation promotes cell proliferation primarily in the trophectoderm lineage.
Figure 2.

Total number of nuclei in blastocyst‐stage embryos cultured in different concentrations of glycine. Values were determined from three replicates (n = 20, 22, 23, 27, 21, and 15 for 0, 0.10, 1, 5, 10, and 20 mM glycine, respectively). Data show mean ± standard error. Different letters indicate statistical differences (P < 0.04).
Table 2.
Differential Staining Results From Embryos Cultured in MU1 or MU1 + 10 mM Glycine
| Treatment | Number of inner cell mass nuclei | Number of trophectoderm nuclei | Total cell number | Trophectodem‐to‐inner cell mass ratio |
|---|---|---|---|---|
| MU1 | 13.7 ± 1.6 | 32.7 ± 2.2a | 48.6 ± 2.9 | 2.4 ± 0.3a |
| MU1 + 10 mM Gly | 15.8 ± 1.3 | 42.2 ± 2.2b | 55.9 ± 2.8 | 3.9 ± 0.4b |
Data are aggregated from five experimental replicates (n = 22 to 26). Means ± standard error are reported. Different letters indicate statistical differences (P < 0.01).
Effects of Osmolality on Embryo Culture
Changes in amino acid composition can impact the osmolality of culture media, thus indirectly affecting embryo development. We therefore tested how control MU1 or MU1 + 10 mM glycine, at three different osmolalities—achieved with adjustments to sodium chloride concentration—affected blastocyst development. No change in blastocyst rates was observed among under different osmolalities (Fig. 3), although the same glycine‐dependent increase in the number of nuclei was observed under all three osmolalities (P ≤ 0.08) (Fig. 4)—which turns out to be due to glycine alone since a significant increase in the number of nuclei (P = 0.003) was observed in this dataset after removing variation due to osmolality as an effect in the statistical model.
Figure 3.
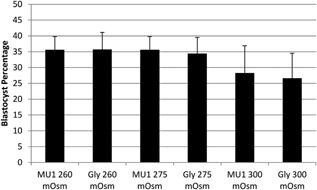
The effect of osmolality on blastocyst development in embryos cultured in MU1 or MU1 + 10 mM glycine (Gly). Values were determined from 5 replicates (n = 253, 254, 297, 297, 255, and 258 from left to right, respectively). Data show mean ± standard error. No differences in development were observed between treatments P > 0.05.
Figure 4.

Effect of osmolality on total cell number in embryos cultured in MU1 or MU1 + 10 mM glycine (Gly). Values were determined from 5 replicates (n = 44, 43, 54, 58, 35, and 34 from left to right, respectively). Data show mean ± standard error. The main effect of glycine was different (P = 0.003).
Effect of Glycine on Apoptosis
The number of apoptotic nuclei in embryos cultured in MU1 and MU1 + 10 mM glycine was determined by terminal deoxynucleotidyl transferase dUTP nick‐end labeling (TUNEL) staining (Fig. 5). Embryos cultured in control MU1 had more (P = 0.003) (14 ± 1.5%) TUNEL‐positive nuclei compared to embryos cultured with 10 mM glycine (8 ± 1.4%), but the absolute number of TUNEL‐positive cells between treatments did not differ: MU1 (5.3 ± 0.5) versus MU1 + 10 mM glycine (4.7 ± 0.6) (P = 0.46).
Figure 5.

Representative images of TUNEL staining of Day‐6 blastocysts cultured in (A) MU1 or (B) MU1 + 10 mM glycine. Scale bars, 50 μm.
Effect of Glycine on Gene Expression
We next used quantitative reverse‐transcription PCR to assess how glycine supplementation affected gene expression of components needed to handle the increased glycine load. The functions addressed included glycine transport (SLC6A9), glycine metabolism (GLDC, GCSH, DLD, AMT), serine metabolism (PSAT1, PSPH, SHMT2, PHGDH), cell cycle (PCNA, CCND3, CCNB1), reactive oxygen species (GSS, TXNRD1, GPX6), apoptosis (PARP2, BAD, TP53), and one‐carbon metabolism (MTHFD1, MTHFD1L, ATIC, SMUG1). Based on the relationship between glycine and serine metabolism, we expected that embryos cultured in increased glycine would show some changes in gene expression. Indeed, significant decreases in the transcript abundance of SLC6A9, GLDC, GCSH, PSAT1, and PSPH (all related to glycine or serine metabolic processes) were observed in the 10 mM glycine‐treated group (Figs. 6 and 7). TXNRD1 and SMUG1 levels were also significantly decreased following culture with glycine, and a lower abundance of BAD was observed in the same group (P = 0.08) (Fig. 8). Transcript abundance of all the other genes showed no change between treatment groups.
Figure 6.

Relative abundance of transcripts involved with glycine transport and glycine metabolism from embryos cultured in MU1 or MU1 + 10 mM glycine. Data show mean ± standard error. Different letters indicate statistical differences (P < 0.05).
Figure 7.

Relative abundance of transcripts involved with serine metabolism from embryos cultured in MU1 or MU1 + 10 mM glycine. Data show mean ± standard error. Different letters indicate statistical differences (P < 0.02). Note that the Y axis on the left is for SHMT2, PSAT1, and PSPH; while the Y axis on the right is for PHGDH.
Figure 8.

Relative abundance of transcripts involved with cell cycle, apoptosis, reactive oxygen species, and one‐carbon pool from embryos cultured in MU1 or MU1 + 10 mM glycine. Data show mean ± standard error. Different letters indicate statistical differences (P < 0.04).
Effect of AMPA on Embryo Development and Gene Expression
The reciprocal relationship between overabundance of glycine and reduced expression of genes involved in glycine and serine metabolism (Fig 6) lead us to ask if glycine supplement promoted the increased cell proliferation through SHMT2 activity. Culture with 50 mM AMPA, an inhibitor of SHMT2, completely abolished blastocyst development, but 10 mM AMPA did not affect blastocyst development (data not shown); therefore, 10 mM was used for the experiment. While embryos cultured in MU1 + 10 mM glycine had significantly more cells than control embryos produced in MU1 (P = 0.01), MU1 + 10 mM AMPA resulted in a phenotype that was indistinguishable from either MU1 or MU1 + 10 mM glycine groups (Fig. 9). Quantitative reverse‐transcription PCR revealed that AMPA does not alter the abundance of BAD mRNA, but did decrease the expression of SHMT2 and TP53 compared to control embryos (Fig. 10). We predicted the reduction in SHMT2 due to feedback from the inhibitor, but were surprised by the change in TP53 levels.
Figure 9.

Effect of culture with AMPA on the number of nuclei in blastocysts. Data were from 3 replicates (n = 28, 31, and 30 for MU1, MU1 + 10 mM glycine, and MU1 + 10 mM AMPA, respectively). Data show mean ± standard error. Different letters indicate statistical differences (P = 0.02).
Figure 10.

Effect of AMPA on the transcript abundance for genes involved with serine metabolism and apoptosis. Data show mean ± standard error. Different letters indicate statistical differences (P < 0.02).
Effect of Glycine on Mitochondria
Metabolism also depends on mitochondrial function, so we evaluated different metrics of the embryos' mitochondrial health following their culture in 10 mM glycine. Mitochondrial activity, as measured by MitoTracker Red CMXRos staining in live embryos (Fig. 11), was not different between blastocysts cultured in MU1 (2,212,748 ± 514,749 fluorescence units) or MU1 + 10 mM glycine (2,853,625 ± 489,377 fluorescence units) (P = 0.93). Mitochondrial DNA (mtDNA) copy number, a proxy for the quantity of these organelles, showed a trending increase in embryos cultured with glycine across seven replicates of MU1− (609,700 ± 95,520 mitochondrial genomes among 41 individual blastocysts) versus MU1 + 10 mM glycine‐cultured embryos (984,236 ± 200,058 mitochondrial genomes among 42 individual blastocysts) (P = 0.12). An F‐test indicated that the variation between treatments was different (P = 0.01)—that is, there was more variation within the glycine‐treated embryos than within the control embryos. On the other hand, no differences were observed in the transcript abundance of mitochondria‐related genes—IMMT, SSBP1, MFN2, PAM16, and PINK1—in three 10‐blastocyst pools of embryos cultured in MU1 + 10 mM glycine compared to MU1 (Fig. 12).
Figure 11.
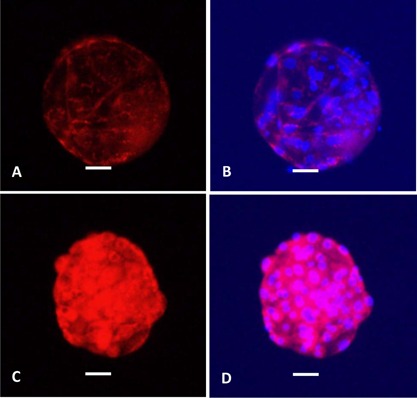
MitoTracker Red CMXRos staining of Day‐6 blastocysts culture in either (A, B) MU1 or (C, D) MU1 + 10 mM glycine. Left images (A, C) show MitoTracker staining alone; right images (B, D) show MitoTracker staining merged with stained nuclei. Scale bars, 50 μm.
Figure 12.
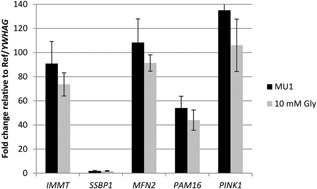
Effect of glycine on abundance of mitochondria‐related transcript abundance.
Embryo Transfer
Eleven embryo transfers were completed, involving 22–57 in vitro‐produced blastocysts cultured in MU1 + 10 mM glycine, to test the competency of these glycine‐enhanced blastocysts produce live offspring. Each of the recipient gilt's estrus cycle was extended past 21 days, but there was never a pregnancy detected and thus no live births. One additional animal was flushed on Day 15 to observe the MU1 + 10 mM glycine‐cultured embryos when attachment normally occurs; a clump of elongated embryos was obtained. In contrast, 14 control in vitro‐fertilized transfers were completed during this same period: 4 recipients contained viable fetuses (5, 6, 7, and 10 fetuses) on Day 45 of gestation, and 4 maintained pregnancy to term (delivering 4, 4, 5, and 5 live piglets).
DISCUSSION
Cancer cells and embryos utilize a metabolism that is distinct from the system used by most somatic cells. Highly proliferative cancer cells preferentially use the pentose phosphate pathway and glycolysis, regardless of the oxygen tension; this bias is characteristic of the Warburg Effect (Levine and Puzio‐Kuter 2010), and is thought to be important for the production of macromolecules, for the protection against reactive oxygen species, and to support proliferation and growth. One attribute of the metabolic profile of cancer and tumor‐initiating cells is their reliance on glycine for proliferation and tumorigenesis: Jain et al. (2012) reported that isotope‐labeled glycine is directly incorporation into the purine backbone of nucleotides. Zhang et al. (2012) found that glycine decarboxylase (GLDC), which converts glycine to 5, 10‐methylenetetrahydrofolate for thymidine synthesis from deoxyuridine in concert with pyrimidine biosynthesis, metabolized most of the available glycine. Indeed, up‐regulation of GLDC alone promotes cellular transformation by overcoming a deficiency in nucleotides. By analogy, exogenous glycine is likely needed to sustain the rapid cellular proliferation occurring in early embryos.
Many zygotes do not develop to blastocysts in vitro; those that do are often developmentally delayed or have an altered developmental program that may impact later development. Mining a previous transcription‐profiling comparison of blastocysts that were in vivo‐fertilized and in vivo‐cultured or in vivo‐fertilized and in vitro‐cultured (Bauer et al., 2010a) revealed differentially expressed genes involved with glycine and serine metabolism (Table 1). Culturing fertilized oocytes with different concentrations of glycine profoundly affected pre‐implantation development (Fig. 2), which is consistent with the predicted impairment in glycine metabolism. Indeed, embryos cultured in 10 mM glycine possessed 1.5‐fold more cells per blastocyst than our current optimized medium (72 vs. 42 cells per blastocyst). This elevated proliferation in response to glycine is consistent with reports for cancer and tumorigenic cells grown in the presence of additional glycine. Another study found that adding glycine and glucose together in a chemically defined medium lacking bovine serum albumin (PZM5) resulted in increased pig blastocyst development, increased hatching of blastocysts, increased cell number, and decreased apoptotic index compared to control embryos; unfortunately, no embryo‐transfer results were reported (Mito et al., 2012). Surprisingly, these authors did not find any difference with glycine alone.
Glycine was previously shown to benefit mouse embryo development by acting as an organic osmolyte (Van Winkle et al., 1990; Dawson et al., 1998; Steeves et al., 2003; Moravek et al., 2012). In porcine embryos, high and low osmolalities tended to yield blastocysts with more cells from the glycine‐supplemented media compared to control media; indeed, media at 275 mOsm with additional glycine was associated with a significant increase in the total embryonic cell number (Fig. 4). After correcting for variation due to osmolality, glycine was found to significantly affect overall blastocyst cell number, and thus likely promotes proliferation through a mechanism that is independent of osmolality (Fig. 13).
Figure 13.

Potential effects of glycine on embryonic cells. Adapted from Tomita and Kami (2012).
Glycine can contribute to many processes during embryo development, and its availability likely influences de novo glycine and serine metabolism. The decreased expression of SLC6A9, which encodes glycine transporter, in embryos cultured with MU1 + 10 mM glycine is consistent with the hypothesis that control MU1‐cultured embryos are up‐regulating SLC6A9 expression in response to insufficient available glycine—and mirrors the response previously reported for low availability of arginine (Bauer et al., 2010a,2010b). Expression of genes encoding glycine cleavage enzymes GLDC and GCSH are similarly lower because of the abundance of glycine. Genes related to de novo serine metabolism—PHGDH, PSAT1, and PSPH—were also down‐regulated in the presence of supplemental glycine, which is consistent with the model that more available free glycine requires less conversion of serine to glycine.
Physiological levels of reactive oxygen species (ROS) are essential for regulating transcription factors and serving as second messengers in signal transduction (Peng et al., 2014). Under metabolic stress, however, ROS can induce large amounts of cellular damage to proteins, lipids, and nucleic acids. Two small‐thiol systems, utilizing glutathione or thioredoxin, protect against damage associated with excess ROS. Thioredoxin reductase 1 (TXNRD1) was recently found to be critical for protecting mouse embryonic fibroblasts from glucose‐induced hydrogen peroxide production (Peng et al., 2014). We observed a decrease in TXNRD1 transcript abundance in porcine blastocysts cultured in MU1 + 10 mM glycine, suggesting that supplemental glycine may be reducing the accumulation of ROS in these embryos, thus requiring less thioredoxin to protect against oxidative stress.
DNA replication requires sufficient levels of one‐carbon units for the de novo synthesis of purine or thymidylate, a pyrimidine precursor; a shortage of these one‐carbon units could suppress mitotic rates and retard DNA repair, thereby reducing cellular proliferation and promoting genomic instability (Beaudin and Stover 2007). One‐carbon units may be limiting in in vitro‐cultured embryos since they possess higher expression of single‐strand‐selective monofunctional uracil‐DNA glycosylase (SMUG1), a DNA base‐excision‐repair enzyme that removes mis‐incorporated uracil from DNA (Vinson and Hales 2002), compared to their in vivo‐produced counterparts (Bauer et al., 2010a). This phenotype suggests that concentrations of 5, 10‐methylenetetrahydrofolate are disrupted or depleted in in vitro‐cultured embryos. Increasing glycine in the culture medium lowered SMUG1 transcript levels, suggesting that thymidylate may no longer be limiting, thus implying an abundance of purine and pyrimidine nucleotides that ultimately results in less mis‐incorporation of uracil into DNA. This hypothesis is consistent with the lower percentage of apoptotic nuclei and reduction in pro‐apoptotic BAD transcript in blastocysts cultured in MU1 + 10 mM glycine compared to controls cultured in MU1. Overall, these metrics point to healthier embryos.
SHMT2 is important for production of glycine from serine in the mitochondria, and its abundance is associated with the proliferation rate of cancer cells (Jain et al., 2012; Amelio et al., 2014). The glycine analog AMPA inhibits SHMT2, and selectively retards proliferation of cancer cells, but not normal somatic cells, at 25 mM (Li et al., 2013). When embryos were cultured with the less‐toxic concentration of 10 mM AMPA, the resulting blastocysts contained a total cell number that fell between and did not differ from embryos cultured in control or glycine‐supplemented conditions. Both glycine‐ and AMPA‐treated embryos did, however, exhibit reduced SHMT2 abundance compared to controls, which is consistent with the model that increased availability of glycine in the medium decreases the need for SHMT2 to convert serine to glycine, thereby reducing expression of the SHMT2 gene.
Respiration in rapidly proliferating cancer cells is hypothesized to rely on endogenous glycine synthesis via SHMT2 located in the mitochondria (di Salvo et al., 2013). Glycine also condenses with succinyl‐CoA in mitochondria to form 5‐aminolevulinate, the universal precursor of heme that is required for cytochrome function. Considering the importance of glycine for mitochondrial function, we asked if supplemental glycine affected the function of this organelle in blastocysts. Although numerically higher fluorescence intensity was observed in embryos cultured with 10 mM glycine, the level did not differ from the control group due to the high variation in intensity among embryos cultured under either condition. Similarly, mtDNA copy number tended to be higher in embryos cultured with 10 mM glycine, but the variation within this experimental group confounded the detection of any significant change. Only small amounts of mitochondrial DNA replication occur during porcine preimplantation development, although a slight increase in this metric was reported at the blastocyst stage (Spikings et al., 2007). The high variation observed in mtDNA levels following culture with glycine supplement could therefore indicate the first movement of this measure away from baseline; perhaps a difference in mitochondrial function and replication would be detected later in development. On the other hand, quantitative reverse‐transcription PCR for the mitochondria‐related genes IMMT, SSBP1, MFN2, PAM16, and PINK1 revealed no difference in the abundance in embryos cultured in 10 mM glycine versus control conditions (Fig. 12), suggesting that these trends may be a consequence of the generally higher variation observed in cultured embryos compared to their in vivo counterparts (Bauer et al., 2010a). Consequently, significant differences are more difficult to detect under this expanded variance.
None of the eleven embryo transfers conducted with embryos cultured in 10 mM glycine resulted in a successful pregnancy, indicating that in vitro glycine supplementation may ultimately have had a detrimental effect on establishing and maintaining pregnancy in vivo. GLDC was found to be significantly down‐regulated under 10 mM glycine compared to control conditions, but reduced GLDC activity could also cause an accumulation of excess glycine that may have ultimately proved to be lethal due to the formation of the toxic intermediates aminoacetone and methylglyoxal (Kim et al., 2015). Instead, these results reinforce the possibility that total cell number and overall appearance of an embryo may not be good indicators of developmental capabilities in vivo (Spate et al., 2012). Given the failure to achieve pregnancy or live birth, supplemental glycine could be considered as a contraceptive.
Glycine is utilized in many ways in an early embryo (Fig. 13). Our results indicate that this amino acid does not contribute solely as an osmolyte in pig embryo culture: it is a precursor to nucleotide synthesis—as suggested by decreased SMUG1 levels, which correlate with increased uracil incorporation to DNA—and dramatically influences the expression of serine‐ and glycine‐metabolism genes without affecting the expression of mitochondria‐related genes. Glycine‐cultured embryos also undergo less apoptosis than control embryos. How glycine promotes these improvements in preimplantation development and why these embryos are not able to establish pregnancy and produce live piglets still need to be determined.
MATERIALS AND METHODS
Chemical Components
All the chemical components were purchased from Sigma Chemical Company (St. Louis, MO), unless indicated otherwise.
In Vitro Production of Embryos
Ovaries were obtained from pre‐pubertal gilts according to the study protocol and standard operating procedures reviewed and approved by the Institutional Animal Care and Use Committee of the University of Missouri. Cumulus‐oocyte complexes were aspirated from follicles 2–8 mm in diameter, and subjected to in vitro maturation, as described previously (Zhang et al., 2010). Cumulus cells were denuded from matured oocytes by vortexing briefly in 0.03% hyaluronidase in Tyrode's Lactate (TL)‐Hepes buffered saline (Lai and Prather 2003). Metaphase‐II oocytes were selected based on the extrusion of the first polar body, and were subsequently used for in vitro fertilization.
Mature oocytes were washed in IVF medium (modified Tris‐buffered medium containing 2 mg/mL bovine serum albmin (BSA) and 2 mM caffeine). Thirty oocytes were placed into 50‐μL droplets of IVF medium, covered with a mineral oil overlay, and incubated at 38.5°C until sperm were added. The sperm used for fertilization was obtained from a single boar, and used for all experiments. For in vitro fertilization, a 0.1‐mL frozen semen pellet was thawed in 3 mL of sperm washing medium (Dulbecco's phosphate‐buffered saline (Gibco) supplemented with 0.1% BSA and 10 μg/mL gentamicin). The sperm were washed twice by centrifugation: first in a 45% Percoll solution, and then in modified Tris‐buffered medium. The spermatozoa pellet was resuspended with IVF medium to 0.5 × 10⁶ cells/mL. Finally, 50 μL of the sperm suspension was added to the oocytes in the IVF medium, giving a final concentration of 0.25 × 10⁶ cells/mL. Gametes were incubated together for 4–5 hr.
Effect of Glycine on Embryo Development Embryo Culture
Inseminated oocytes were removed from the droplets and washed in PZM3 (Yoshioka et al., 2002) containing 1.69 mM arginine (MU1) (Bauer et al., 2010b; Redel et al., 2015). Fifty presumptive zygotes were then cultured in MU1 with 0, 0.1 (the concentration of glycine normally in MU1; our control), 1, 5, 10, or 20 mM glycine in a four‐well dish in humidified atmosphere with 5% CO2 in air for 28–30 hr at 38.5°C. After 28–30 hr of culture, the embryos were moved to a humidified atmosphere of 5% CO2, 90% N2, and 5% O2 at 38.5°C until Day 6 post‐fertilization, when blastocysts from each treatment group were collected and the percent of embryos that developed to the blastocyst stage was recorded. To determine the effect that each concentration of glycine had on development, the percentage of blastocysts in each treatment group was analyzed by using a general linear model PROC GENMOD in SAS (V9.3, SAS Institute, Cary, NC). A Least Significant Difference (LSD) post‐test comparison was completed to determine if significant differences existed between treatment groups (P < 0.05).
Embryos for all subsequent experiments were cultured in either MU1 + 0.1 mM glycine (referred to as MU1, or the control condition) or MU1 + 10 mM glycine. The blastocysts were then collected and used for RNA isolation or stained to quantify cell numbers.
Differential Nuclear Staining
The number of trophectoderm and inner cell mass nuclei for embryos cultured in either MU1 or MU1 + 10 mM glycine were assessed by differential nuclear staining (Machaty et al., 1998; Bauer et al., 2010a). Zona pellucidae were removed using a physiological saline lowered to a pH of 1.79. Zona‐free embryos were exposed for 60 min to a 1:7 dilution of rabbit anti‐pig whole serum (Bauer et al., 2010a), and then washed three times for 5 min in TL‐Hepes buffered saline. Finally, embryos were incubated for 35 min in a 1:10 dilution of guinea pig complement, propidium iodide (10 μg/mL), and bisbenzimide (10 μg/mL). This complement‐mediated lysis causes trophectoderm cells to lyse, which allows them to take up propidium iodide, whereas cells of the inner cell mass should remain alive. All cells take up bisbenzimide. The embryos were then observed with ultraviolet light under 40× magnification using a Nikon Eclipse E600 inverted microscope (Nikon Corp., Tokyo, Japan). Inner‐cell‐mass nuclei stained only with bisbenzimide (blue) while trophectoderm nuclei stained with both propidium iodide and bisbenzimide (pink). The number of nuclei belonging to the inner cell mass, trophectoderm, total embryo (total cell number), and the ratio of trophectoderm‐to‐inner cell mass were first analyzed for normality by using the UNIVARIATE procedure in SAS. The data were then transformed and analyzed by analysis of variance using the mixed‐linear model procedure in SAS. An LSD post‐test comparison was completed for each variable to determine if significant differences (P < 0.05) existed between the groups.
Effects of Osmolality on Embryo Culture
An experiment assessing the effects of high and low osmolality of culture medium was conducted to assess if glycine is acting as an osmolyte in our culture system, as it does for other species. Fertilized embryos were cultured in media with low (260 mOsm), normal (275 mOsm), or high (300 mOsm) osmolalities, which were obtained by adjusting the concentration of NaCl. Presumptive zygotes were cultured in one of six treatments: MU1 ± 10 mM glycine at 260 mOsm; MU1 ± 10 mM glycine at 275 mOsm; or MU1 ± 10 mM glycine at 300 mOsm. The number of embryos that developed to the blastocyst stage and the total number of nuclei were counted for each treatment group.
RNA Extraction and cDNA Synthesis for Quantitative PCR
Three biological replicates of Day‐6 blastocysts were obtained for both MU1 and MU1 + 10 mM glycine conditions. Total RNA was extracted from pools of 10 embryos per replicate for the glycine and serine metabolism genes or from pools of 40 embryos per replicate for the remaining genes, using an RNeasy micro kit (Qiagen, Germantown, MD). Total RNA was suspended in 12 μL, and was then converted to cDNA using the SuperScript VILO kit (Life Technologies, Carlsbad, CA).
Relative Quantitative PCR
Relative quantitative PCR was conducted on each of the samples for the genes involved with glycine metabolism, serine metabolism, glutathione production, cell cycle, folate‐related metabolism, and apoptosis‐related genes using IQ SYBR Green Supermix (Bio‐Rad Laboratories) and unamplified cDNA from each biological replicate as template. Primers were designed using Integrated DNA Technology software (Idtdna.com; Coralville, IA), and real‐time PCR was run in triplicate for every biological replicate on the MyiQTM Single‐Color Real‐Time PCR Detection System (Bio‐Rad Laboratories) to verify the differential expression of the chosen transcripts (Table 3). Primer efficiency tests were completed for each primer set by generating a standard curve using 10 ng dilutions of our 5 ng/μL reference cDNA pool. Quantitative PCR was run in triplicate at each concentration (50 ng/μL, 5 ng/μL, 0.5 ng/μL, 0.05 ng/μL, 0.005 ng/μL) to validate each primer set.
Table 3.
Transcripts Selected for Real‐Time Quantitative PCR
| Gene | Forward primer | Reverse primer | Accession number |
|---|---|---|---|
| SLC6A9 | 5′‐TGCGGCCACCTGACTAGTGTT | 5′‐GAGGAGGTGGCAACCACAGATAAT | XM_005656191 |
| GLDC | 5′‐CCAGGTGCTGATCTCCATA | 5′‐AGAGAGGTGGCAGCATT | NM_000170.2 |
| GCSH | 5′‐GGTGCTTTGGAAAGTGTGAAAGCTGC | 5′‐CATCCAGTTCTGAAGGGTTACTGA | XR_130503.3 |
| DLD | 5′‐GGACTAGAAGAGCTTGGAATTG | 5′‐CATCCCTTCCACACAGATAATG | NM_214062.1 |
| AMT | 5′‐TCCCACATGCTGCAGACCAAGATA | 5′‐CCCTGATTTGGCTTTAACTCGGCA | NM_001244426.1 |
| SHMT2 | 5′‐GAGAGTCTATCAGACAGTGACC | 5′‐CGAGTACTTGTTGTTCAGACAG | XM_005663918.1 |
| PSAT1 | 5′‐TGGCAACACCAAAGGAGATGATGC | 5′‐TGCTCATAGCTGGTGCATCTCCAA | XM_001928079.3 |
| PSPH | 5′‐AAGCCTGTCCTCCTGCTGATGTTT | 5′‐TGATGTACCATTCCGCGTTGTCCT | NM_001243221.1 |
| PHGDH | 5′‐CTTCCATGAAGGATGGCAAAT | 5′‐AGACCTCTGGAGCAATGATAG | NM_001123162 |
| PCNA | 5′‐GGCTCCCAAGATCGAAGATGAA | 5′‐AGTATGTGCTGGCATCACCGAA | NM_182649.1 |
| CCND3 | 5′‐GATTTCCTGGCTCTGATTCTC | 5′‐GGTACATGGCAAAGGTGTAA | NM_001078678.1 |
| CCNB1 | 5′‐ACTGGCTAGTGCAGGTTCAGAT | 5′‐AACATGGCAGTGACACCAACCA | NM_031966.2 |
| PARP2 | 5′‐CGTGTACAGGAGCTGATAAAG | 5′‐GCCCGAAT CAATCCTCAAT | XM_005656314.1 |
| BAD | 5′‐TTGCCAGCCGAGATTAACCCTAAC | 5′‐CACGCGGGCTTTATTAGCACGTTT | XM_003122573.2 |
| TP53 | 5′‐GGAACAGCTTTGAGGTGCGTGTTT | 5′‐ATACTCGCCATCCAGTGGCTTCTT | NM_213824.3 |
| MTHFD1 | 5′‐AGTGGAGAGTGCAGAGCATTTCCT | 5′‐CAGGTTACCAATGGGCTTTGGCTT | XM_001924329.3 |
| MTHFD1L | 5′‐AGTACCGCAGGTGGAAACTTCACT | 5′‐ACGTACTTTGGCTTTGCTTCTGCC | XR_300085.1 |
| ATIC | 5′‐TCCATGCTGGAATCTTGGCTCGTA | 5′‐ACATCTGGAGAAGCCACTGTCTC | NM_001130736.1 |
| SMUG1 | 5′‐AGGGAGAGAGAATTCAGTGTGGCA | 5′‐TTGGAGAGGTCGGTCAACTCATCT | XM_001927219.3 |
| GSS | 5′‐GCCAAGATCCTCTCCAATAATC | 5′‐GGCCAGTAGCTCATTCTCTA | NM_001244625.1 |
| TXNRD1 | 5′‐CTCAAGTGGGAGAAGGAAAC | 5′‐GATCGTCCATTCCACAAAGA | NM_214154.3 |
| GPX6 | 5′‐AAACAAGAACCAGCAAAGAAC | 5′‐GGAGTTCTTCAGGAAGGTAAAG | NM_001137607.1 |
| IMMT | 5′‐GGTGGAAAGGGATGAGTATTT | 5′‐CAGCCTGTATCTCACTTCTAT | XM_003481170.2 |
| SSBP1 | 5′‐GAAAGTAGACTATGGCGAATACA | 5′‐TCAGAGATCCCAGCTTCTT | XM_003134602.4 |
| MFN2 | 5′‐ATGCTCTGGGACAAAGTGCTGC | 5′‐TTGACGCTCCTCTTCTCCTCTGA | XM_005665006.1 |
| PAM16 | 5′‐AGGCCCAGCAGATTCTCAATGTCT | 5′‐TTTGACTGCAGGTAGAAGGAGCCA | XM_003124646 |
| PINK1 | 5′‐GATGGAGTCAGAGGGTCTAA | 5′‐GATCTGTATGCAGAGACCTAATC | XM_005665091.1 |
| CYTB (for standard) | 5′‐GGAATCTCATCAGACATAGAC | 5′‐GAGGTCTGCTACTAGTATTC | KJ789952 |
| CYTB (for samples) | 5′‐ACCTACTAGGAGACCCAGACAACT | 5′‐TGAACGTAGGATAGCGTAGGCGAA | KJ789952 |
The abundance of each mRNA transcript was calculated relative to the reference sample and the housekeeping gene YWHAG (tyrosine 3‐monooxygenase/tryptophan 5‐monooxygenase activation protein, gamma polypeptide) (Whitworth et al., 2005; Bauer et al., 2010a). The reference sample was pooled from four biological replicates of in vivo‐fertilized/in vivo‐cultured blastocysts and in vivo‐fertilized/in vitro‐cultured blastocysts (Bauer et al., 2010a). Transcript abundance between treatments was determined using the comparative threshold cycle (CT) method for each gene. The 2−ΔΔCT values were analyzed for normality, and log transformed if not normally distributed. The resulting values were then analyzed using the general linear model (PROC GLM) in SAS. Differences in expression were determined by using the Least Squares Means (LSMeans) generated by PROC GLM, and P < 0.05 was considered significant.
TUNEL Staining
Apoptotic cells in Day‐6 blastocysts were identified using the In Situ Cell Death Detection Kit Fluorescein (Roche Diagnostics). Embryos were fixed in 4% paraformaldehyde, and then permeabilized with 0.1% Triton X‐100 for 30 min at room temperature. A positive‐control group was achieved using 32 Kunitz units of DNase I and 25 μL of the TUNEL solution. A negative control was obtained by incubating with only the “label” solution. The permeabilized blastocysts were washed in TL‐Hepes buffered saline with 0.1% polyvinyl alcohol (PVA). Embryos were then incubated in 25 μL of this solution at 38.5°C for 1 hr in a dark, humidified atmosphere. Embryos were washed with TL‐Hepes buffered saline with PVA, and the nuclei were stained with 10 μg /mL bisbenzimide for 20–30 min. The embryos were then washed and mounted on a glass slide for viewing by epifluorescence illumination.
Culture AMPA
SHMT2 reversibly catalyzes the conversion of serine to glycine, and may be responsible for the intracellular glycine content. AMPA, a glycine analog, inhibits more than 95% of nuclear thymidylate synthesis, suggesting that this compound inhibits SHMT2 (Li et al., 2013). We, therefore, used AMPA to test if glycine was promoting cell proliferation through SHMT2. Oocytes were collected and fertilized as described above. Presumptive zygotes were then cultured for 28–30 hr in a four‐well dish incubated in a humidified atmosphere with 5% CO2 in air at 38.5°C, in either MU1, MU1 + 10 mM glycine, or MU1 + 10 mM or 50 mM AMPA. After 28–30 hr, embryos were moved to a humidified atmosphere of 5% CO2, 90% N2, and 5% O2 at 38.5°C until Day 6 post‐fertilization, when blastocysts from each treatment group were collected and the percent of embryos that developed to the blastocyst stage was recorded. The blastocyst percentage for each treatment group was analyzed by using PROC GENMOD in SAS. An LSD post‐test comparison was completed to determine if significant differences existed between treatment groups (P < 0.05). Total number of nuclei was also counted from Day‐6 embryos, as described above. Three replicates of 28, 31, and 30 blastocysts were counted for MU1, MU1 + 10 mM glycine, and MU1 + 10 mM AMPA, respectively. Day‐6 blastocysts were then collected for gene expression analysis. Three replicates of pools of 10 blastocysts for each treatment were collected and processed for quantitative PCR, as described above, for SHMT2, TP53, and BAD.
MitoTracker Red CMXRos Staining
The effect glycine had on mitochondrial membrane activity was evaluated because glycine is the precursor to heme, a critical component for cytochrome synthesis and oxidative phosphorylation. Live embryos were stained with 125 nM MitoTracker Red CMXRos (Life Technologies). Six replicates were performed, generating 17 blastocysts from MU1 and 16 blastocysts from MU1 + 10 mM glycine conditions. A control group of embryos was left unstained to capture background levels. Each treatment group was then fixed in 4% paraformaldehyde, and stained with bisbenzimide to count total nuclei in each embryo. Embryos were mounted on slides and imaged using a fluorescent microscope. The sum intensity was collected for each stained blastocyst, and background intensity was subtracted from each embryo. This adjusted‐sum‐intensity value was imported into SAS, and a mixed‐linear procedure was used to determine if differences existed between culture groups. The data were log transformed before the analysis due to their non‐normal distribution. The raw mean intensity is presented in the text, but the statistical analysis was derived from the log‐transformed values.
Mitochondrial DNA Copy Number
Analysis of mtDNA copy number in Day‐6 blastocysts cultured in either MU1 or MU1 + 10 mM glycine was performed in a manner similar to described previously (Mao et al., 2012). The zona pellucidae were removed from the blastocysts using a physiological saline solution at pH 1.79, and then the embryos were washed in TL‐Hepes‐buffered saline. An individual blastocyst in 1 μL diethylpyrocarbonate‐treated phosphate‐buffered saline with 1% PVA was then placed in a 0.5‐mL tube and snap frozen in liquid N2. An external standard was generated to create a standard curve for PCR quantification. Primers were designed to amplify a 369‐bp fragment of the mitochondrial cytochrome B gene (CYTB) (Table 3). Reactions included 7.5 μL GeneAmp Fast PCR Master Mix (ABI, Foster City, CA), 0.5 mM of each primer, and 1 μL DNA template in 15 μL. Plasmid‐standard concentrations were determined on a NanoDrop 1000 Spectrophotometer (NanoDrop products, Wilmington, DE); 1 ng of the plasmid standard (3 kb vector + 0.369 kb PCR product) was assumed to contain 2.72 × 10⁸ molecules. Serial 10‐fold dilutions were used to construct a standard curve for PCR quantification (Mao et al., 2012).
mtDNA was quantified from embryos in the same manner as Mao et al. (2012). Primers were designed that anneal inside of the amplified 369‐bp CYTB fragment (see Table 3). Single‐embryo lysates were used as a template, and quantitative PCR reactions were completed as described above. A linear‐regression analysis of all standard curves for samples with copy numbers between 102 and 107 showed a high correlation coefficient (r2 = 0.999). A water control was included within each assay. Absolute mtDNA copy number in a single blastocyst was calculated from the standard curve derived from the quantitative PCR amplifications using Microsoft Excel 2010 (Microsoft Corporation, Redmond, WA). Statistical analysis was completed by first assessing the data for normality by using the Shapiro–Wilks test. The mtDNA copy number for each embryo was then analyzed using the mixed linear procedure in SAS.
Embryo Transfer
On Day 6 after fertilization, blastocysts cultured in MU1 + 10 mM glycine were selected and placed in 3 mL of manipulation medium (9.50 g TCM‐199, 0.05 g NaHCO3, 0.75 g Hepes, 1.76 g NaCl, 3.00 g BSA, 1 mL gentamicin, and 1000 mL Milli Q H2O) in polystyrene tubes (BD Falcon 352054, San Jose, CA). Embryos were transported at 37°C to the University of Missouri Swine Research Complex, where they were loaded into a tomcat catheter and surgically transferred to the ampullary‐isthmic junction of a cycling gilt on Day 5 or 6 of her estrous cycle (Spate et al., 2010; Lee et al., 2013). Pregnancy was determined by heat checking and monitored by ultrasound after Day 25. Pigs were checked weekly until the gilt returned to estrus or farrowed.
ACKNOWLEDGMENTS
The authors would like to thank Dr. Clifton Murphy, Lonnie Dowell, and Jason Dowell for their assistance with the embryo transfers. We would also like to thank Jennifer Hamm and Alyssa Davis for their help with quantitative PCR.
REFERENCES
- Amelio I, Cutruzzola F, Antonov A, Agostini M, Melino G. 2014. Serine and glycine metabolism in cancer. Trends Biochem Sci 39:191–198. [DOI] [PMC free article] [PubMed] [Google Scholar]
- Bauer BK, Isom SC, Spate LD, Whitworth KM, Spollen WG, Blake SM, Springer GK, Murphy CN, Prather RS. 2010a. Transcriptional profiling by deep sequencing identifies differences in mRNA transcript abundance in in vivo‐derived versus in vitro‐cultured porcine blastocyst stage embryos. Biol Reprod 83:791–798. [DOI] [PubMed] [Google Scholar]
- Bauer BK, Spate LD, Murphy CN, Prather RS. 2010b. 1 Arginine supplemtation in vitro increases porcine embryo development and affects mRNA transcript expression. Reprod Fertil Dev 23:107–107. [Google Scholar]
- Beaudin AE, Stover PJ. 2007. Folate‐mediated one‐carbon metabolism and neural tube defects: Balancing genome synthesis and gene expression. Birth Defects Res C Embryo Today 81:183–203. [DOI] [PubMed] [Google Scholar]
- Dawson KM, Collins JL, Baltz JM. 1998. Osmolarity‐dependent glycine accumulation indicates a role for glycine as an organic osmolyte in early Preimplantation mouse embryos. Biol Reprod 59:225–232. [DOI] [PubMed] [Google Scholar]
- di Salvo ML, Contestabile R, Paiardini A, Maras B. 2013. Glycine consumption and mitochondrial serine hydroxymethyltransferase in cancer cells: The heme connection. Med Hypotheses 80:633–636. [DOI] [PubMed] [Google Scholar]
- Jain M, Nilsson R, Sharma S, Madhusudhan N, Kitami T, Souza AL, Kafri R, Kirschner MW, Clish CB, Mootha VK. 2012. Metabolite profiling identifies a key role for glycine in rapid cancer cell proliferation. Science 336:1040–1044. [DOI] [PMC free article] [PubMed] [Google Scholar]
- Kim D, Fiske BP, Birsoy K, Freinkman E, Kami K, Possemato RL, Chudnovsky Y, Pacold ME, Chen WW, Cantor JR, Shelton LM, Gui DY, Kwon M, Ramkissoon SH, Ligon KL, Kang SW, Snuderl M, Vander Heiden MG, Sabatini DM. 2015. SHMT2 drives glioma cell survival in ischaemia but imposes a dependence on glycine clearance. Nature 520:363–367. [DOI] [PMC free article] [PubMed] [Google Scholar]
- Krisher RL, Prather RS. 2012. A role for the Warburg effect in preimplantation embryo development: Metabolic modification to support rapid cell proliferation. Mol Reprod Devt 79:311–320. [DOI] [PMC free article] [PubMed] [Google Scholar]
- Lai L, Kolber‐Simonds D, Park KW, Cheong HT, Greenstein JL, Im GS, Samuel M, Bonk A, Rieke A, Day BN, Murphy CN, Carter DB, Hawley RJ, Prather RS. 2002. Production of alpha‐1,3‐galactosyltransferase knockout pigs by nuclear transfer cloning. Science 295:1089–1092. [DOI] [PubMed] [Google Scholar]
- Lee K, Redel BK, Spate L, Teson J, Brown AN, Park KW, Walters E, Samuel M, Murphy CN, Prather RS. 2013. Piglets produced from cloned blastocysts cultured in vitro with GM‐CSF. Mol Reprod Dev 80:145–154. [DOI] [PMC free article] [PubMed] [Google Scholar]
- Levine AJ, Puzio‐Kuter AM. 2010. The control of the metabolic switch in cancers by oncogenes and tumor suppressor genes. Science 330:1340–1344. [DOI] [PubMed] [Google Scholar]
- Li Q, Lambrechts MJ, Zhang Q, Liu S, Ge D, Yin R, Xi M, You Z. 2013. Glyphosate and AMPA inhibit cancer cell growth through inhibiting intracellular glycine synthesis. Drug Des Dev Ther 7:635–643. [DOI] [PMC free article] [PubMed] [Google Scholar]
- Li R, Whitworth K, Lai L, Wax D, Spate L, Murphy CN, Rieke A, Isom C, Hao Y, Zhong Z, Katayama M, Schatten H, Prather RS. 2007. Concentration and composition of free amino acids and osmolalities of porcine oviductal and uterine fluid and their effects on development of porcine IVF embryos. Mol Reprod Dev 74:1228–1235. [DOI] [PMC free article] [PubMed] [Google Scholar]
- Machaty Z, Day BN, Prather RS. 1998. Development of early porcine embryos in vitro and in vivo. Biol Reprod 59:451–455. [DOI] [PubMed] [Google Scholar]
- Mao J, Whitworth KM, Spate LD, Walters EM, Zhao J, Prather RS. 2012. Regulation of oocyte mitochondrial DNA copy number by follicular fluid, EGF, and neuregulin 1 during in vitro maturation affects embryo development in pigs. Theriogenology 78:887–897. [DOI] [PMC free article] [PubMed] [Google Scholar]
- Mito T, Yoshioka K, Yamashita S, Suzuki C, Noguchi M, Hoshi H. 2012. Glucose and glycine synergistically enhance the in vitro development of porcine blastocysts in a chemically defined medium. Reprod Fertil Dev 24:443–450. [DOI] [PubMed] [Google Scholar]
- Moravek M, Fisseha S, Swain JE. 2012. Dipeptide forms of glycine support mouse preimplantation embryo development in vitro and provide protection against high media osmolality. J Assist Reprod Genet 29:283–290. [DOI] [PMC free article] [PubMed] [Google Scholar]
- Peng X, Mandal PK, Kaminskyy VO, Lindqvist A, Conrad M, Arner ES. 2014. Sec‐containing TrxR1 is essential for self‐sufficiency of cells by control of glucose‐derived H2O2. Cell Death Dis 5:e1235. [DOI] [PMC free article] [PubMed] [Google Scholar]
- Redel BK, Brown AN, Spate LD, Whitworth KM, Green JA, Prather RS. 2012. Glycolysis in preimplantation development is partially controlled by the Warburg Effect. Mol Reprod Dev 79:262–271. [DOI] [PubMed] [Google Scholar]
- Redel BK, Tessanne KJ, Spate LD, Murphy CN, Prather RS. 2015. Arginine increases development of in vitro‐produced porcine embryos and affects the protein arginine methyltransferase?dimethylarginine dimethylaminohydrolase?nitric oxide axis. Reprod Fertil Dev 27:655–666. [DOI] [PMC free article] [PubMed] [Google Scholar]
- Rogers CS, Stoltz DA, Meyerholz DK, Ostedgaard LS, Rokhlina T, Taft PJ, Rogan MP, Pezzulo AA, Karp PH, Itani OA, Kabel AC, Wohlford‐Lenane CL, Davis GJ, Hanfland RA, Smith TL, Samuel M, Wax D, Murphy CN, Rieke A, Whitworth K, Uc A, Starner TD, Brogden KA, Shilyansky J, McCray PB, Jr. , Zabner J, Prather RS, Welsh MJ. 2008. Disruption of the CFTR gene produces a model of cystic fibrosis in newborn pigs. Science 321:1837–1841. [DOI] [PMC free article] [PubMed] [Google Scholar]
- Spate LD, Brown A, Redel BK, Whitworth KM, Prather RS. 2015. PS48 can replace bovine serum albumin in pig embryo culture medium, and improve in vitro embryo development by phosphorylating AKT. Mol Reprod Dev 82:315–320. [DOI] [PMC free article] [PubMed] [Google Scholar]
- Spate LD, Redel BK, Brown AN, Murphy CN, Prather RS. 2012. Replacement of bovine serum albumin with N‐methyl‐D‐aspartic acid and homocysteine improves development, but not live birth. Mol Reprod Dev 79:310. [DOI] [PubMed] [Google Scholar]
- Spate LD, Whitworth KM, Walker KA, Bauer BK, Murphy CN, Prather RS. 2010. Low‐density lipoprotein (LDL) receptor mRNA and protein may enable LDL to replace bovine serum albumin during the in vitro swine embryo development. Mol Reprod Dev 77:298. [DOI] [PubMed] [Google Scholar]
- Spikings EC, Alderson J, St John JC. 2007. Regulated mitochondrial DNA replication during oocyte maturation is essential for successful porcine embryonic development. Biol Reprod 76:327–335. [DOI] [PubMed] [Google Scholar]
- Steeves CL, Hammer MA, Walker GB, Rae D, Stewart NA, Baltz JM. 2003. The glycine neurotransmitter transporter GLYT1 is an organic osmolyte transporter regulating cell volume in cleavage‐stage embryos. Proc Natl Acad Sci USA 100:13982–13987. [DOI] [PMC free article] [PubMed] [Google Scholar]
- Tomita M, Kami K. 2012. Cancer. Systems biology, metabolomics, and cancer metabolism. Science 336:990–991. [DOI] [PubMed] [Google Scholar]
- Van Winkle LJ, Haghighat N, Campione AL. 1990. Glycine protects preimplantation mouse conceptuses from a detrimental effect on development of the inorganic ions in oviductal fluid. J Exp Zool 253:215–219. [DOI] [PubMed] [Google Scholar]
- Vinson RK, Hales BF. 2002. Expression and activity of the DNA repair enzyme uracil DNA glycosylase during organogenesis in the rat conceptus and following methotrexate exposure in vitro. Biochem Pharmacol 64:711–721. [DOI] [PubMed] [Google Scholar]
- Watson AJ, Natale DR, Barcroft LC. 2004. Molecular regulation of blastocyst formation. Anim Reprod Sci 82–83:583–592. [DOI] [PubMed] [Google Scholar]
- Whitworth KM, Agca C, Kim JG, Patel RV, Springer GK, Bivens NJ, Forrester LJ, Mathialagan N, Green JA, Prather RS. 2005. Transcriptional profiling of pig embryogenesis by using a 15‐K member unigene set specific for pig reproductive tissues and embryos. Biolf Reprod 72:1437–1451. [DOI] [PubMed] [Google Scholar]
- Whitworth KM, Rowland RR, Ewen CL, Trible BR, Kerrigan MA, Cino‐Ozuna AG, Samuel MS, Lightner JE, McLaren DG, Mileham AJ, Wells KD, Prather RS. 2016. Gene‐edited pigs are protected from porcine reproductive and respiratory syndrome virus. Nat Biotechnol 34:20–22. [DOI] [PubMed] [Google Scholar]
- Yoshioka K, Suzuki C, Tanaka A, Anas IM, Iwamura S. 2002. Birth of piglets derived from porcine zygotes cultured in a chemically defined medium. Biol Reprod 66:112–119. [DOI] [PubMed] [Google Scholar]
- Zhang WC, Shyh‐Chang N, Yang H, Rai A, Umashankar S, Ma S, Soh BS, Sun LL, Tai BC, Nga ME, Bhakoo KK, Jayapal SR, Nichane M, Yu Q, Ahmed DA, Tan C, Sing WP, Tam J, Thirugananam A, Noghabi MS, Pang YH, Ang HS, Mitchell W, Robson P, Kaldis P, Soo RA, Swarup S, Lim EH, Lim B. 2012. Glycine decarboxylase activity drives non‐small cell lung cancer tumor‐initiating cells and tumorigenesis. Cell 148:259–272. [DOI] [PubMed] [Google Scholar]
- Zhang X, Miao Y, Zhao J‐G, Spate L, Bennett MW, Murphy CN, Schatten H, Prather RS. 2010. Porcine oocytes denuded before maturation can develop to the blastocyst stage if provided a cumulous cell‐derived coculture system. J Anim Sci 88:2604–2610. [DOI] [PubMed] [Google Scholar]