

Abstract
The task of specific gene knockdown in vitro has been facilitated through the use of short interfering RNA (siRNA), which is now widely used for studying gene function, as well as for identifying and validating new drug targets. We explored the possibility of using siRNA for dissecting cellular pathways by siRNA-mediated gene silencing followed by gene expression profiling and systematic pathway analysis. We used siRNA to eliminate the Rb1 gene in human cells and determined the effects of Rb1 knockdown on the cell by using microarray-based gene expression profiling coupled with quantitative pathway analysis using the GenMapp and MappFinder software. Retinoblastoma protein is one of the key cell cycle regulators, which exerts its function through its interactions with E2F transcription factors. Rb1 knockdown affected G1/S and G2/M transitions of the cell cycle, DNA replication and repair, mitosis, and apoptosis, indicating that siRNA-mediated transient elimination of Rb1 mimics the control of cell cycle through Rb1 dissociation from E2F. Additionally, we observed significant effects on the processes of DNA damage response and epigenetic regulation of gene expression. Analysis of transcription factor binding sites was utilized to distinguish between putative direct targets and genes induced through other mechanisms. Our approach, which combines the use of siRNA-mediated gene silencing, mediated microarray screening and quantitative pathway analysis, can be used in functional genomics to elucidate the role of the target gene in intracellular pathways. The approach also holds significant promise for compound selection in drug discovery.
INTRODUCTION
The process of RNA interference is mediated by double-stranded RNA, which is cleaved by the enzyme DICER into duplexes 21–23 nt in length containing a 2 nt overhang at the 3′ end of each strand (1). The task of specific gene knockdown in vitro has been facilitated through the use of short interfering RNA (siRNA) (2). The use of RNA interference (RNAi) for inhibiting gene expression represents a powerful tool for exploring gene function, identifying and validating new drug targets, and treating disease (3–8). siRNA may also prove to be a useful tool for dissecting cellular pathways, if siRNA-mediated gene knockdown is followed by a systematic analysis of downstream effects.
Here, we combined the use of siRNA, microarray technologies and quantitative pathway analysis to determine the effects of a gene knockdown on the cell. The combination of the siRNA and microarray technologies is a powerful tool in large-scale genomics experiments, particularly if the vast amount of gene expression data is systematically analyzed in the context of the biological pathways. We have previously used DNA microarrays to assess the consequences of gene silencing on a genome-wide scale (9). In this work, we used siRNA to silence the retinoblastoma gene (Rb1) in human cells and comprehensively analyzed the resulting transcriptional activation pattern using the Gene Ontology (GO) pathway classification (10).
The Rb1 gene was chosen because of its critical role in cell cycle progression (11–13) and the dependence of its function on interactions with members of the E2F family of transcription factors. During the G1 phase, Rb1 binds to and inactivates E2F-1, thus causing transcriptional repression of E2F-1 controlled genes. In the late G1 phase, the Rb1 protein is phosphorylated by cyclin-dependent kinases 4 and 6 (CDK 4/6), which results in the dissociation of the Rb1/E2F-1 complex and subsequent activation of transcription of E2F-1 target genes (13–15). Previously identified E2F-1-controlled genes in rodents are involved in DNA biosynthesis and control of cell cycle progression (16–19), which is consistent with the role of Rb1 in controlling the G1/S cell cycle transition.
A systematic pathway analysis of the gene expression signatures associated with the knockdown of the target gene revealed a pattern generally consistent with those observed earlier upon E2F overexpression (16–19) and identified a number of genes involved in the CDK4/6–pRb–E2F pathway. An analysis of E2F binding sites has been performed for the genes induced upon Rb1 knockdown to identify putative targets of the pathway. The proposed methodology may be used for systematic examination of intracellular pathways and selection of small molecule inhibitors in drug discovery.
MATERIALS AND METHODS
Cell culture and siRNA
Human non-small cell lung carcinoma cells H1299 were cultured in RPMI-1640 medium (Invitrogen Corp, Carlsbad, CA) supplemented with 10% fetal bovine serum (FBS) (Invitrogen). To maximize the specificity of targeting, siRNAs were designed using a previously described algorithm (9). The sense strand was included in the homology minimization algorithm together with the antisense strand, as it may influence the specificity of gene silencing (20,21). The sequences of the siRNAs used in this work are listed in Figure 1. Transfections were performed using the TransIT-TKO reagent (Mirus Corp., Madison, WI) according to the manufacturer's instructions. Cells were plated into 60 mm dishes (Corning) 24 h prior to transfections. At the time of transfection, the cell density was 5 × 10⁵ cells/ml. Briefly, 3 μl of 20 μM siRNA solution and 15 μl of the transfection reagent were incubated in 0.5 ml of serum-free RPMI-1640 media for 20 min to facilitate complex formation. The resulting mixture was added to the cells cultured in 2.5 ml of RPMI-1640. Each siRNA was transfected into two dishes of H1299 cells. The cells were lysed after 12 h to isolate total RNA.
Figure 1.
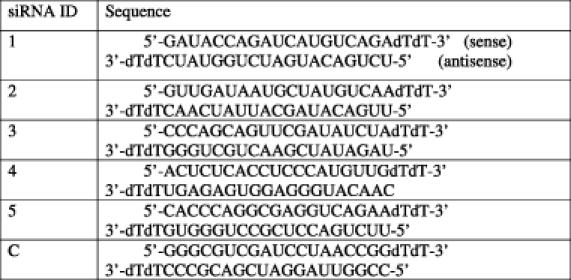
siRNA sequences used in this work.
Microarray profiling and pathway analysis
Total RNA was extracted using the Trizol reagent (Invitrogen) and purified on RNeasy columns (Qiagen). The quality of total RNA was monitored by using a BioAnalyzer (Agilent Technologies). Labeled cRNA was prepared according to the standard Affymetrix protocol using 5–10 μg of total RNA as starting material. The labeled cRNA was hybridized to Human Genome U95Av2 chips (Affymetrix, Inc., Santa Clara, CA) containing ∼12 000 genes and expressed sequence tags (ESTs). Microarray data were analyzed using Resolver™ software (Rosetta Inpharmatics, Kirkland, WA) and exported into Excel for pathway analysis.
For pathway analysis of the Rb1 knockdown signature, we used the GeneMapp and MappFinder software packages (www.GenMapp.org) (22,23). The GenMapp program contains dozens of pre-loaded pathway maps, which can be associated with an imported gene expression signature. To establish the associations between the Rb1 knockdown signature and the affected pathways, the MappFinder program was used, which links gene expression data to the Gene Ontology hierarchy (10). The GO hierarchy provides a structure for organizing genes into biologically relevant subcategories, with a parent–child relationship between its terms. The subcategories can serve as a basis for identifying those processes showing correlated gene expression changes in an experiment. MappFinder calculates the percentage of the genes measured that meet a user-defined criterion (≥1.5-fold change and P-value ≤0.05 in our analysis). This is done for each GO node and for the cumulative total of the number of genes in a parent GO term combined with all its children. Using this percentage, as well as the Z-score, the GO terms can be ranked by the relative amount of gene expression changes. The three highest-level branches in the GO tree are biological processes, cellular components and molecular functions. Our analysis was limited to the biological processes branch.
Analysis of promoter regions for putative E2F binding sites
To identify putative E2F regulatory sites in the promoter region of Rb1-regulated genes, we retrieved, in batch mode, the presumed promoter region (−1000 to +200 bp) for as many genes as possible using the Promoser server at http://biowulf.bu.edu/zlab/promoser/. Of the 469 genes that were positively regulated by siRNAs targeted to Rb1, we were able to retrieve 398 upstream regions using the following parameters: quality metric of at least 1 and supporting sequences of at least 2. Accuracy of the sequence retrieval was then assessed by BLAST analysis of the sequences against the GenCarta (Compugen) human sequence database. Additionally, the sequences were checked individually against the proposed region of transcription initiation defined in the DataBase of Transcriptional Start Sites (DBTSS) constructed by the University of Tokyo (http://dbtss.hgc.jp/). When there was ambiguity in the putative trascription start site (TSS), such as multiple distinct sites, the sequence was removed from consideration. Even though many genes have some degree of alternative transcription initiation, it was encouraging that for ∼90% of the Promoser recovered sequences there was good agreement (generally within ±100 bases) with the alignment of reference (e.g. NM_XXXXXX) and EST sequences in the DBTSS.
E2F transcription factor binding sites flanking the proposed transcription start site for each gene were predicted based on the rules determined previously by Kel et al. (24). Promoter sequences were analyzed using the E2F search site program (http://compel.bionet.nsc.ru/FunSite.html) established by Kel et al. with the following settings: weight matrix threshold of 0.8 and forbidden nucleotides at conserved positions not allowed. This approach was a compromise to permit the identification of as many sites as possible. We scanned nearly 500 000 bases of promoter sequence and found 1212 putative E2F sites. The average number of predicted E2F sites across all 398 up-regulated genes was 3.55 (range of 1–14) with an average Q-score of 0.87.
As shown previously by Kel et al. (24), we observed a distribution of E2F sites across our promoter regions that peaked at the start of transcription. To reduce false positives and maximize total positives, we filtered the data for E2F sites that had a Q-score of at least 0.86 and fell within −400 and +100 bases of the proposed start of transcription for each gene (24). This resulted in 238 sites distributed among 162 genes that represent high probability active E2F binding sites. As a check on our method, we examined genes from our list that were known to have E2F sites and found that many (e.g. cdc6, cdc2, mcm2–mcm7) were confirmed. Our analysis has identified a number of additional targets of the E2F-Rb1 pathway possessing E2F sites. Among them are many genes associated with DNA replication/repair and related cellular processes. For example, our analysis has confirmed and extended the observations of others (25) that the mini chromosome maintenance (MCM2–MCM7) family of proteins, involved in DNA replication and mitosis are regulated by E2F. All of the 6 MCM genes on the microarray contain at least one high probability site within 220 bases of the TSS and these sites have an average Q-score of 0.98.
RESULTS AND DISCUSSION
Gene expression signatures generated by siRNAs against Rb1
Initially, a total of eight siRNAs against Rb1 were designed using a previously described algorithm (9). Prior to the microarray experiments, all 8 siRNAs were transfected into H1299 cells and tested for mRNA and protein knockdown at 12 h by quantitative RT–PCR and western blot, respectively. Five out of the eight siRNAs were found to efficiently eliminate the target mRNA and protein (Figure 2). These five duplexes, as well as a control random-sequence siRNA were used in subsequent experiments. The gene expression changes were evaluated relative to the control siRNA-treated cells. The control siRNA was chosen based on the minimal potential for cross-hybridization to sequences represented in the RefSeq database, as indicated by BLAST results. The control random-sequence siRNA caused few gene expression changes versus untreated cells; none of the genes from the Rb knockdown signature was regulated by the control siRNA at the P-value cut-off of 0.05 (Supplementary Table 1). Since our goal was to examine the effects of Rb1 knockdown, we wanted to make sure that only the specific on-target effects of the Rb1 siRNA are analyzed. Therefore, we generated gene expression signatures for all five efficacious siRNAs (Supplementary Table 2) and then analyzed the common gene set. The use of multiple siRNAs is highly desirable as it allows one to eliminate potential non-specific effects unique to individual siRNAs. To increase the robustness of the microarray data analysis, biological duplicates were used for each siRNA, which brought the number of independent transfection experiments to 10. Human H1299 cells were transfected with the siRNAs and then lysed after 12 h. The 12 h time point was chosen based on our previous gene expression studies with Rb1 (data not shown) and earlier microarray studies of E2F-1 overexpression (18).
Figure 2.
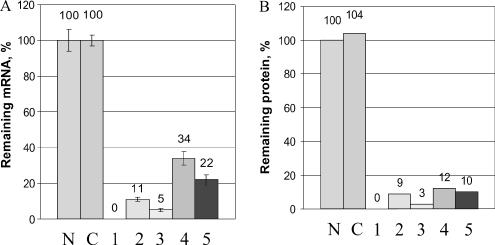
Elimination of the target mRNA (a) and protein (b) by siRNAs 1–5 against Rb1. In control assays, no siRNA was used (N) or a random-sequence control siRNA was used (C).
In our analysis of the data from the 10 Rb1 knockdown experiments, we took a conservative approach and defined the Rb1 knockdown signature as the overlap of the gene sets regulated by the individual Rb1 siRNAs at the confidence level of 95%. First, we exported into Excel all the genes regulated in at least 1 experiment with a P-value ≤ 0.05 and a fold change of ≥1.5. A combined redundant list of genes was then created for all 10 experiments. Only genes regulated by at least three siRNAs were retained for pathway analysis with MappFinder.
Pathway analysis of the Rb1 knockdown signature
To systematically examine the effects of the Rb1 knockdown on cellular processes, we used the GeneMapp and MappFinder software packages as described in Materials and Methods. Figure 3 presents the GO branches most significantly affected by Rb1 knockdown. It can be seen that within the Cell Growth and Maintenance node, the most affected processes are in the Cell Cycle branch. This is consistent with the role of Rb1 in the control of cell cycle and previously reported data on gene regulation by E2Fs (16–19,26). Among the child nodes within the Cell Cycle branch, the Mitotic Cell Cycle, DNA replication and Chromosome Maintenance, and Regulation of Cell Cycle processes are significantly associated with the elimination of the Rb1 protein (Z-scores > 2). It has been previously reported that overexpression of E2Fs induces genes involved in the G1/S transition, DNA replication and mitosis (16–19). Our observations are consistent with these data and thus indicate that elimination of Rb1 by siRNA-mediated silencing releases E2Fs and induces E2F-mediated transcription.
Figure 3.
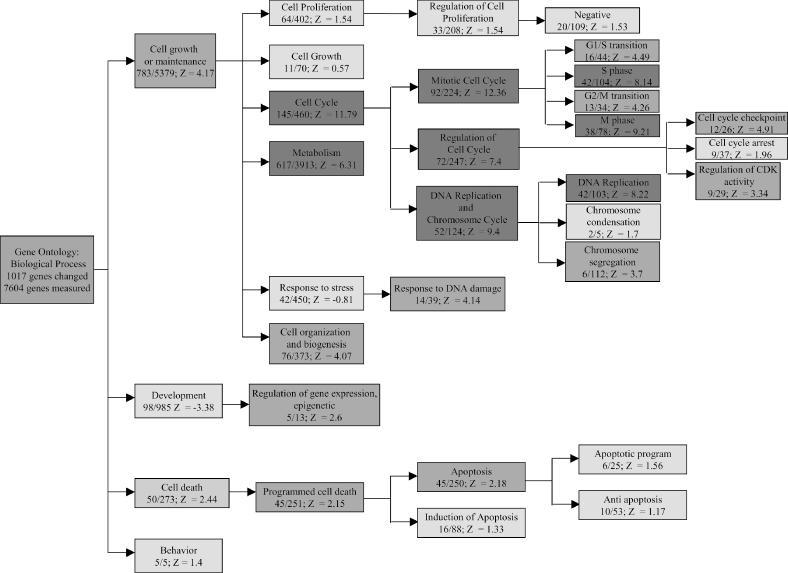
The pathway associations of the Rb knockdown signature. The Gene Ontology nodes strongly affected by the Rb1 silencing are shown, along with the number of genes affected, number of genes present on the chip (in the affected/present format), and the Z-score, which indicates the relatedness of the gene expression signature to the process. The color of the box reflects the Z-score for the node (red, Z ≥ 5; orange, 2 ≤ Z ≤ 5; yellow, Z ≤ 2).
Interestingly, although the Rb1/E2F mechanism is primarily known for its role in G1/S regulation, the M phase and mitosis-related nodes were among the most affected in our analysis. Ishida et al. (17) have observed induction of some mitotic genes upon overexpression of E2Fs in mouse fibroblasts. The authors also showed that the induction of these genes is not simply a consequence of induced cell cycle progression. However to prove this hypothesis, it is important to establish these genes as direct targets of the CDK4/6–pRb–E2F pathway. This problem can be approached by identifying E2F-binding sites in the promoter regions of these genes (next subsection of Results and Table 1).
Table 1. Selected genes induced upon Rb knockdown.
| Gene description | Primary name | Accession no. | Mean FC | SD | Reference | E2F site | ||||
|---|---|---|---|---|---|---|---|---|---|---|
| (19) | (16) | (17) | (18) | (26) | ||||||
| Cell cycle | ||||||||||
| Serum-inducible kinase | SNK | AF059617 | 2.11 | 0.24 | ||||||
| Cyclin B2 | CCNB2 | AL080146 | 3.66 | 0.22 | Yes | Yes | ||||
| Ras association (RalGDS/AF-6) domain family 1 | RASSF1 | AF061836 | 2.18 | 0.31 | ||||||
| Cyclin-dependent kinase inhibitor 2C (p18) | CDKN2C | AF041248 | 2.06 | 0.17 | Yes | Yes | + | |||
| CDC28 protein kinase 2 | CKS2 | X54942 | 4.25 | 0.42 | + | |||||
| Cyclin F | CCNF | Z36714 | 3.43 | 0.13 | ||||||
| Minichromosome maintenance deficient 4 | MCM4 | X74794 | 7.38 | 2.09 | Yes | Yes | + | |||
| Minichromosome maintenance deficient 2 | MCM2 | D21063 | 2.19 | 0.13 | Yes | Yes | + | |||
| Transcription factor Dp-1 | TFDP1 | L23959 | 10.69 | 2.31 | Yes | Yes | Yes | + | ||
| Homo sapiens DNA sequence from PAC 150O5 | E2F2 | AL021154 | 2.46 | 0.10 | + | |||||
| CHK1 (checkpoint, Schizosaccharomyces pombe) homolog | CHEK1 | AF016582 | 2.61 | 0.10 | + | |||||
| Cyclin A2 | CCNA2 | X51688 | 5.99 | 0.16 | Yes | |||||
| Cyclin A1 | CCNA1 | U66838 | 5.61 | 0.50 | ||||||
| Cell division cycle 2, G1 to S and G2 to M | CDC2 | Y00272 | 4.16 | 0.61 | Yes | Yes | + | |||
| Cyclin E2 | CCNE2 | AF091433 | 5.27 | 0.81 | Yes | Yes | + | |||
| Cyclin-dependent kinase inhibitor 3 | CDKN3 | L25876 | 4.61 | 0.43 | ||||||
| Activator of S phase kinase | ASK | AB028069 | 3.03 | 0.30 | + | |||||
| G1 to S phase transition 1 | GSPT1 | X17644 | 1.84 | 0.11 | + | |||||
| Cyclin C | CCNC | M74091 | 1.87 | 0.18 | ||||||
| Cyclin D3 | CCND3 | M92287 | 1.63 | 0.10 | ||||||
| Baculoviral IAP repeat-containing 5 (survivin) | BIRC5 | U75285 | 2.79 | 0.49 | ||||||
| Serine/threonine kinase 15 | STK15 | AF011468 | 5.17 | 0.40 | + | |||||
| Cyclin B1 | CCNB1 | M25753 | 5.30 | 0.17 | Yes | Yes | + | |||
| Polo (Drosophila)-like kinase | PLK | U01038 | 4.12 | 0.64 | Yes | |||||
| Minichromosome maintenance deficient 3 | MCM3 | D38073 | 3.95 | 0.29 | Yes | + | ||||
| CDC20 (Saccharomyces cerevisiae, homolog) | CDC20 | U05340 | 4.55 | 0.49 | Yes | + | ||||
| TTK protein kinase | TTK | M86699 | 3.63 | 0.44 | + | |||||
| Serine/threonine kinase 12 | STK12 | AF015254 | 3.12 | 0.22 | ||||||
| Serine/threonine kinase 18 | STK18 | Y13115 | 2.60 | 0.14 | Yes | + | ||||
| Budding uninhibited by benzimidazoles 1 | BUB1 | AF053305 | 5.02 | 0.46 | Yes | Yes | ||||
| Pituitary tumor-transforming 1 | PTTG1 | AA203476 | 4.19 | 0.35 | Yes | |||||
| Cell division cycle 25C | CDC25C | M34065 | 2.32 | 0.28 | ||||||
| Cyclin-dependent kinase 2 | CDK2 | M68520 | 1.58 | 0.04 | Yes | Yes | ||||
| CDC28 protein kinase 1 | CKS1 | AA926959 | 1.64 | 0.08 | ||||||
| BTG family, member 3 | BTG3 | D64110 | 1.67 | 0.08 | Yes | Yes | + | |||
| Putative lymphocyte G0/G1 switch gene | G0S2 | M69199 | 1.78 | 0.07 | ||||||
| DNA biosynthesis | ||||||||||
| Methylenetetrahydrofolate dehydrogenase | MTHFD1 | J04031 | 1.79 | 0.07 | + | |||||
| Ribonucleotide reductase M2 polypeptide | RRM2 | X59618 | 21.37 | 6.37 | Yes | Yes | Yes | Yes | + | |
| CDC6 (cell division cycle 6, S.cerevisiae) homolog | CDC6 | U77949 | 9.25 | 1.90 | + | |||||
| CDC45 (cell division cycle 45 homolog)-like | CDC45L | AJ223728 | 5.36 | 0.63 | + | |||||
| Polymerase (DNA directed), epsilon 2 | POLE2 | AF025840 | 4.37 | 0.41 | + | |||||
| Thymidine kinase 1, soluble | TK1 | M15205 | 5.07 | 0.52 | Yes | |||||
| Proliferating cell nuclear antigen | PCNA | M15796 | 4.59 | 0.20 | Yes | Yes | Yes | Yes | ||
| Thymidylate synthetase | TYMS | X02308 | 5.17 | 0.53 | Yes | Yes | ||||
| Ribonuclease HI, large subunit | RNASEHI | Z97029 | 3.31 | 0.39 | ||||||
| Thymidine kinase 1, soluble | TK1 | K02581 | 3.27 | 0.14 | ||||||
| Replication protein A3 (14 kDa) | RPA3 | L07493 | 3.18 | 0.17 | Yes | + | ||||
| Topoisomerase (DNA) II alpha (170 kDa) | TOP2A | AI375913 | 3.02 | 0.27 | Yes | Yes | Yes | |||
| Ribonucleotide reductase M1 polypeptide | RRM1 | X59543 | 2.84 | 0.16 | Yes | Yes | Yes | |||
| H.sapiens clone 24767 mRNA | AF070552 | 2.65 | 0.20 | + | ||||||
| Vaccinia related kinase 1 | VRK1 | AB000449 | 2.72 | 0.24 | Yes | + | ||||
| Minichromosome maintenance deficient 5 | MCM5 | X74795 | 2.56 | 0.12 | Yes | + | ||||
| Deoxythymidylate kinase (thymidylate kinase) | DTYMK | L16991 | 2.52 | 0.22 | + | |||||
| Replication factor C (activator 1) 5 (36.5 kDa) | RFC5 | L07540 | 2.43 | 0.18 | + | |||||
| Topoisomerase (DNA) II alpha (170 kDa) | TOP2A | J04088 | 2.60 | 0.12 | Yes | Yes | ||||
| Polymerase (DNA directed), gamma | POLG | W74442 | 2.43 | 0.32 | + | |||||
| Primase, polypeptide 2A (58 kDa) | PRIM2A | X74331 | 2.25 | 0.45 | Yes | Yes | Yes | + | ||
| Primase, polypeptide 1 (49 kDa) | PRIM1 | X74330 | 2.22 | 0.13 | Yes | + | ||||
| Replication factor C (activator 1) 3 (38 kDa) | RFC3 | L07541 | 2.07 | 0.14 | Yes | Yes | + | |||
| Phosphoribosyl pyrophosphate synthetase 2 | PRPS2 | Y00971 | 1.97 | 0.12 | ||||||
| Replication factor C (activator 1) 2 (40 kDa) | RFC2 | NM_002914 | 2.03 | 0.11 | ||||||
| Chromatin assembly factor 1, subunit A (p150) | CHAF1A | U20979 | 1.89 | 0.11 | Yes | + | ||||
| Replication factor C (activator 1) 4 (37 kDa) | RFC4 | M87339 | 1.87 | 0.17 | Yes | Yes | ||||
| Guanine monphosphate synthetase | GMPS | U10860 | 2.36 | 0.23 | + | |||||
| Topoisomerase (DNA) II binding protein | TOPBP1 | D87448 | 1.85 | 0.16 | + | |||||
| Non-metastatic cells 1, protein (NM23A) | NME1 | X17620 | 1.86 | 0.06 | ||||||
| CTP synthase | CTPS | X52142 | 1.65 | 0.07 | ||||||
| Phosphoribosyl pyrophosphate synthetase 1 | PRPS1 | D00860 | 1.68 | 0.09 | ||||||
| Replication protein A1 (70 kDa) | RPA1 | M63488 | 1.66 | 0.09 | Yes | + | ||||
| Replication factor C (activator 1) 4 (37 kDa) | RFC4 | M87339 | 1.64 | 0.09 | Yes | |||||
| Uridine monophosphate kinase | UMPK | D78335 | 1.66 | 0.10 | ||||||
| Uridine monophosphate synthetase | UMPS | J03626 | 1.62 | 0.07 | ||||||
| Minichromosome maintenance deficient 6 | MCM6 | D84557 | 1.72 | 0.12 | Yes | Yes | + | |||
| Nucleoside phosphorylase | NP | X00737 | 1.61 | 0.11 | ||||||
| Adenosine kinase | ADK | U50196 | 1.66 | 0.16 | + | |||||
| Minichromosome maintenance deficient 7 | MCM7 | D55716 | 1.60 | 0.08 | Yes | Yes | Yes | + | ||
| Cell line HL-60 alpha topoisomerase | 904_s_at | L47276 | 2.95 | 0.21 | Yes | Yes | ||||
| Putative dimethyladenosine transferase | HSA9761 | AF091078 | 1.79 | 0.08 | ||||||
| Putative dimethyladenosine transferase | HSA9761 | AF091078 | 1.81 | 0.20 | ||||||
| Origin recognition complex, subunit 3-like | ORC3L | AL080116 | 1.69 | 0.12 | + | |||||
| Chromosome 11, BAC CIT-HSP-311e8 | FEN1 | AC004770 | 3.30 | 0.18 | ||||||
| Rad2 | RAD2 | NM_004111 | 4.07 | 0.55 | Yes | |||||
| DNA repair | ||||||||||
| H.sapiens DNA from chromosome 19p13.2 | EKLF | AD000092 | 11.21 | 1.35 | ||||||
| Apurinic/apyrimidinic endonuclease-like 2 protein | APEXL2 | AJ011311 | 4.86 | 1.25 | + | |||||
| X-ray repair, defective repair in CH cells 3 | XRCC3 | AF035586 | 3.00 | 0.32 | ||||||
| RAD51-interacting protein | PIR51 | AF006259 | 3.02 | 0.20 | ||||||
| High-mobility group, chromosomal protein 2 | HMG2 | X62534 | 2.74 | 0.22 | Yes | Yes | + | |||
| Bloom syndrome | BLM | U39817 | 2.20 | 0.22 | Yes | + | ||||
| RAD51 (S.cerevisiae) homolog C | RAD51C | AF029669 | 2.15 | 0.20 | Yes | Yes | ||||
| Nudix-type motif 1 | NUDT1 | D16581 | 2.26 | 0.13 | + | |||||
| Xq28, 2000 bp sequence contig open reading frame (ORF) | HSXQ28ORF | X99270 | 2.08 | 0.13 | + | |||||
| Uracil-DNA glycosylase | UNG | Y09008 | 2.11 | 0.20 | Yes | Yes | + | |||
| H.sapiens DNA from chromosome 19p13.2 | EKLF | AD000092 | 1.94 | 0.21 | ||||||
| RuvB (E.coli homolog)-like 2 | RUVBL2 | AB024301 | 1.82 | 0.11 | ||||||
| Damage-specific DNA-binding protein 2 (48 kDa) | DDB2 | U18300 | 1.74 | 0.13 | + | |||||
| Ubiquitin-conjugating enzyme E2N | UBE2N | D83004 | 1.80 | 0.09 | + | |||||
| RecQ protein-like (DNA helicase Q1-like) | RECQL | D37984 | 1.88 | 0.19 | ||||||
| NAD+; poly (ADP-ribose) polymerase | ADPRT | J03473 | 1.61 | 0.10 | + | |||||
| RAD1 (S.pombe) homolog | RAD1 | AF084513 | 1.84 | 0.18 | ||||||
| DNA (cytosine-5-)-methyltransferase 1 | DNMT1 | X63692 | 1.60 | 0.06 | Yes | |||||
| Mitosis | ||||||||||
| Kinesin-like 4 | KNSL4 | AB017430 | 18.92 | 2.02 | + | |||||
| Kinesin-like 5 (mitotic kinesin-like protein 1) | KNSL5 | X67155 | 5.44 | 0.85 | Yes | |||||
| Mitotic spindle coiled-coil related protein | DEEPEST | AF063308 | 4.68 | 0.26 | ||||||
| MAD2 (mitotic arrest deficient, yeast, homolog)-like 1 | MAD2L1 | AJ000186 | 4.16 | 0.95 | + | |||||
| H.sapiens lamin B1 gene, exon 11 | lamin B1 | L37747 | 4.68 | 0.38 | Yes | Yes | ||||
| ZW10 interactor | ZWINT | AF067656 | 3.64 | 0.24 | + | |||||
| Budding uninhibited by benzimidazoles 1, beta | BUB1B | AF053306 | 3.48 | 0.41 | Yes | Yes | ||||
| Centromere protein E (312 kDa) | CENPE | Z15005 | 3.76 | 0.41 | ||||||
| Kinesin-like 1 | KNSL1 | U37426 | 3.73 | 0.31 | Yes | + | ||||
| Chromosome-associated polypeptide C | CAP-C | AB019987 | 3.18 | 0.43 | + | |||||
| Chromosome-associated protein E (SMC family) | CAP-E | AF092563 | 3.56 | 0.52 | + | |||||
| Extra spindle poles, S.cerevisiae, homolog of | KIAA0165 | D79987 | 2.67 | 0.21 | + | |||||
| Centromere protein A (17 kDa) | CENPA | U14518 | 2.85 | 0.10 | ||||||
| KIAA0042 gene product | KIAA0042 | D26361 | 2.51 | 0.16 | ||||||
| Post-meiotic segregation increased 2-like 6 | PMS2L6 | AI341574 | 2.62 | 0.25 | ||||||
| Kinesin-like 6 (mitotic kinesin) | KNSL6 | U63743 | 2.44 | 0.12 | + | |||||
| Chromosome 20 (ORF) 1 | C20ORF1 | AB024704 | 2.66 | 0.07 | + | |||||
| Kinesin-like 2 | KNSL2 | D14678 | 2.62 | 0.24 | Yes | + | ||||
| NIMA (never in mitosis gene a)-related kinase 2 | NEK2 | Z29066 | 2.67 | 0.22 | ||||||
| M-phase phosphoprotein 1 | MPHOSPH1 | L16782 | 2.25 | 0.13 | ||||||
| Tubulin, gamma 1 | TUBG1 | M61764 | 2.18 | 0.09 | + | |||||
| Centromere protein F (350/400 kDa, mitosin) | CENPF | U30872 | 2.05 | 0.18 | + | |||||
| Nucleolar phosphoprotein p130 | P130 | D21262 | 1.83 | 0.13 | + | |||||
| Chromosome segregation 1 (yeast homolog)-like | CSE1L | AF053641 | 1.76 | 0.07 | + | |||||
| Sjogren's syndrome/scleroderma autoantigen 1 | SSSCA1 | AB001740 | 1.70 | 0.08 | ||||||
| Chromosome condensation-related protein 1 | KIAA0159 | D63880 | 1.86 | 0.22 | ||||||
| Highly expressed in cancer, leucine heptad repeats | HEC | AF017790 | 4.95 | 0.32 | Yes | + | ||||
| MAD2 (mitotic arrest deficient, yeast, homolog)-like 1 | MAD2L1 | U65410 | 5.20 | 0.90 | + | |||||
| Structural maintenance of chromosomes 1-like 1 | SMC1L1 | D80000 | 1.72 | 0.14 | + | |||||
| Signal transduction | ||||||||||
| Mitogen-activated protein kinase kinase kinase 14 | MAP3K14 | Y10256 | 4.41 | 0.92 | ||||||
| Transforming growth factor, beta receptor III | TGFBR3 | L07594 | 3.22 | 0.46 | ||||||
| Transmembrane 4 superfamily member 1 | TM4SF1 | AI445461 | 3.25 | 0.19 | ||||||
| Mitogen-activated protein kinase kinase 3 | MAP2K3 | L36719 | 2.64 | 0.29 | ||||||
| Low-density lipoprotein receptor gene, exon 18 | LDLR | L00352 | 2.69 | 0.11 | ||||||
| Protein phosphatase 2A, regulatory subunit B′ | PPP2R4 | X73478 | 2.25 | 0.18 | ||||||
| Mitogen-activated protein kinase kinase 3 | MAP2K3 | D87116 | 2.33 | 0.25 | ||||||
| Protein tyrosine phosphatase, non-receptor type 1 | PTPN1 | M31724 | 2.01 | 0.22 | ||||||
| Phosphoglycerate kinase {alternatively spliced} | PGK | S81916 | 1.99 | 0.32 | ||||||
| Citron (rho-interacting, serine/threonine kinase 21) | CIT | AB023166 | 2.51 | 0.37 | ||||||
| Interleukin enhancer binding factor 1 | ILF1 | U58198 | 1.96 | 0.18 | + | |||||
| Protein kinase (cAMP-dependent) inhibitor alpha | PKIA | S76965 | 2.11 | 0.10 | ||||||
| G-protein-coupled receptor 19 | GPR19 | U64871 | 1.83 | 0.08 | ||||||
| Protein phosphatase 1G, gamma isoform | PPM1G | Y13936 | 1.81 | 0.10 | ||||||
| SFRS protein kinase 1 | SRPK1 | U09564 | 1.65 | 0.13 | + | |||||
| Protein phosphatase 2, reg. subunit B, delta isoform | PPP2R5D | L76702 | 1.58 | 0.05 | ||||||
| Tyrosine Kinase, receptor Axl, Alt. Splice 2 | AXL | NM_001699 | 1.83 | 0.18 | ||||||
| Transcription | ||||||||||
| c-myc binding protein | MYCBP | D50692 | 3.47 | 0.43 | ||||||
| v-myb homolog-like 1 | MYBL1 | X66087 | 3.03 | 0.36 | ||||||
| Thyroid hormone receptor interactor 13 | TRIP13 | U96131 | 3.09 | 0.12 | Yes | |||||
| c-myc binding protein | MYCBP | AB007191 | 2.05 | 0.10 | ||||||
| TATA box binding protein (TBP)-associated factor | TAF2N | U51334 | 1.83 | 0.13 | ||||||
| Small nuclear RNA activating complex, polypeptide 1 | SNAPC1 | U44754 | 2.07 | 0.22 | + | |||||
| Putative DNA-binding protein | M96 | AJ010014 | 1.83 | 0.09 | + | |||||
| Regulatory factor X, 5 | RFX5 | AL050135 | 1.77 | 0.11 | ||||||
| NF-κB2 light polypeptide gene enhancer 2 | NFKB2 | X61498 | 1.77 | 0.14 | ||||||
| Polymerase (RNA) II (DNA-directed) polypeptide D | POLR2D | U89387 | 1.87 | 0.20 | ||||||
| NF-κB inhibitor, epsilon | NFKBIE | U91616 | 1.66 | 0.10 | ||||||
| Forkhead box M1 | FOXM1 | U74612 | 3.82 | 0.26 | + | |||||
| Interleukin enhancer binding factor 1 | ILF1 | U58198 | 1.96 | 0.18 | + | |||||
| Associated with cancer | ||||||||||
| Antigen identified by monoclonal antibody Ki-67 | MKI67 | X65550 | 7.32 | 2.11 | Yes | Yes | + | |||
| Transmembrane 4 superfamily member 1 | TM4SF1 | M90657 | 3.93 | 0.24 | ||||||
| BRCA1-associated RING domain 1 | BARD1 | U76638 | 2.82 | 0.18 | Yes | |||||
| Neurofibromin 2 (bilateral acoustic neuroma) | NF2 | L11353 | 6.24 | 1.18 | ||||||
| RAB5C, member RAS oncogene family | RAB5C | U18420 | 4.50 | 1.02 | ||||||
| Ras-like protein Tc21 | TC21 | NM_012250 | 2.37 | 0.20 | ||||||
| Oncogene Aml1-Evi-1, fusion activated | Aml1-Evi-1 | 2.01 | 0.13 | |||||||
| Prostate tumor overexpressed gene 1 | PTOV1 | U79287 | 1.79 | 0.18 | + | |||||
| Muts homolog 2 (colon cancer, non-polyposis type 1) | MSH2 | U03911 | 1.82 | 0.13 | Yes | + | ||||
| Non-metastatic cells 1, protein (NM23A) | NME1 | AL038662 | 1.96 | 0.19 | ||||||
| Non-metastatic cells 1, protein (NM23A) | NME1 | X73066 | 2.00 | 0.19 | ||||||
| Ras-GTPase-activating protein | G3BP | U32519 | 1.91 | 0.21 | + | |||||
| ras homolog gene family, member E | ARHE | S82240 | 1.76 | 0.14 | ||||||
| Human fibroblast growth factor-5 (FGF-5) mRNA | FGF5 | M37825 | 5.16 | 0.34 | ||||||
| Inhibitor of DNA binding 1 | ID1 | X77956 | 4.04 | 0.20 | ||||||
| Cysteine and glycine-rich protein 2 | CSRP2 | U57646 | 2.66 | 0.20 | ||||||
| Nuclear RNA helicase | DDXL | U90426 | 2.19 | 0.17 | ||||||
| FGFR1 oncogene partner | FOP | Y18046 | 2.01 | 0.09 | + | |||||
| pim-2 oncogene | PIM2 | U77735 | 1.89 | 0.10 | ||||||
It can also be seen in Figure 3 that silencing of the Rb1 gene induces apoptotic pathways, as evidenced by the Z-scores for the Programmed Cell Death/Apoptosis branch of the GO. This observation is consistent with the finding that overexpression of E2Fs leads to apoptosis (13,27). Thus, elimination of the Rb1 protein and analysis of the transcriptional consequences allowed us to observe the global pattern associated with a cell cycle transition and apoptosis. Elimination of the Rb1 protein by siRNA thus mimics the process of Rb1 phosphorylation and E2F release that occurs at the G1/S transition.
Our analysis also reveals some potential novel pathway effects. For example, the Response to DNA damage node is significantly affected (Z-scores of 4.14), mostly due to the regulation of Chk1, ATM, ABL and BRCA1. It has been previously shown that overexpression of E2Fs induces genes, whose products execute DNA repair, such as MSH2, MSH6 and UNG (18). The most obvious explanation for this induction was that it was related to initiation of DNA replication. Indeed, DNA repair function is complementary to DNA replication, as the latter process is not error-free and produces mismatches that need to be repaired. However, here we report that elimination of Rb1 affects the upstream regulators of the DNA damage pathway, such as ATM, Chk1 and ABL. These data suggest that Rb1 is involved in the control of the DNA damage response in addition to the regulation of DNA replication and concurrent DNA repair. This is consistent with several earlier reports. In particular, it has been reported that DNA-damaging agents cause an increase in the E2F protein expression and its DNA binding capacity (28–30). Ren et al. (31) have suggested a role for E2Fs in checkpoint control based on results from a novel promoter binding assay. It has been suggested that both pRb and p53 may play a role in DNA damage-induced G1 arrest (31,32).
Another node affected by Rb1 knockdown is the Epigenetic Regulation of Gene Expression node. The Z-score of 2.6 reflects the regulation of 5 out of 13 genes in the node; specifically, DNA (cytosine-5)-methyltransferase 1 (NM_001379) was up-regulated 1.7-fold and STK-1 was up-regulated 3.1-fold, while the transcriptional regulator ATRX was down-regulated 2.2-fold relative to control.
Mueller et al. (16) have reported that E2Fs induce the differentiation and development pathways, in particular, by upregulation of TGFβ signaling genes. In our system, we did not observe any effect on these pathways (Figure 3). While the functional classification certainly affects the conclusion as to which pathways are affected (we used GO while Mueller et al. used GeneCards), in this case the low Z-score for the Cell Differentiation node (Z = −0.7) suggests that these processes are not affected in our experimental system.
It is likely that synchronization of cells prior to Rb knockdown would result in a stronger signal for the Rb knockdown signature (in the current system, the signal is diluted by those cells in the baseline experiment that are undergoing normal G1/S transition). However our preliminary experiments have shown that synchronization methods, such as serum starvation, cause additional changes in gene expression, thus complicating the interpretation of the treatment-specific changes (data not shown).
Identification of putative targets of the CDK4/6–pRb–E2F pathway
As the first step in identifying targets of the CDK4/6–pRb–E2F pathway, we selected genes up-regulated ≥1.5-fold (P-value ≤ 0.05) from the Rb1 knockdown signature. This procedure generated a list of 469 genes (Supplementary Table 3), approximately half of which fall into the functional categories of cell cycle control, mitosis, DNA replication, DNA repair and signal transduction. We calculated the average fold changes and standard deviations for these genes across all 10 experiments (5 siRNAs × 2 replicates). Table 1 lists the genes falling into the aforementioned categories, along with the average fold changes and standard deviations. The low values of standard deviations indicate that the genes were similarly regulated by 5 different siRNAs in 10 independent experiments, which supports their association with the Rb1 knockdown.
Our experiments produced a list of putative E2F targets. However, the fact that our genes are induced upon Rb1 knockdown or the fact that some of them were induced upon E2F overexpression does not necessarily establish them as direct targets of the CDK4/6–pRb–E2F pathway. To further triage our list of putative targets, we analyzed the promoter sequences of these genes to identify E2F binding motifs.
Several reports have been recently published on putative E2F targets (16–19). In a recent study, Vernell et al. (19) have performed a cross-comparison of the gene list generated by overexpression of E2F with a gene list obtained by expression of a phosphorylation-site mutant of Rb1 or p16. The authors have identified 74 genes that are up-regulated upon overexpression of E2F and down-regulated upon expression of Rb1 and p16. Many of these genes contained sequences enriched in the E2F-binding motif and therefore are good candidates for CDK4/6–pRb–E2F pathway targets. However, other reports (17,18,31,33) pointed out under-representation of cell cycle and checkpoint regulators in the target lists of Vernell et al.
Ishida et al. (17) have synchronized a mouse embryonic fibroblast (MEF) cell line at G1/S, overexpressed E2F-1, E2F-2 and E2F-3 genes in these cells using an adenoviral vector, and performed microarray analysis. The study yielded a list of 65 putative targets, which have not been subjected to promoter analysis. Polager et al. (18) generated rat cell lines containing inducible E2F-1 and E2F-3 and generated gene expression profiles associated with E2F overexpression. The list of genes up-regulated upon E2F-1 and E2F-3 expression contained 72 genes and ESTs, many of which were associated with the S and M phases of the cell cycle. Black et al. (26) have generated expression profiles for serum-starved mouse embryonic fibroblasts null for Rb1, p107 and p130, and applied the statistical tools developed for expression-based tumour classification. The results indicated clear differences in the expression patterns.
We compared the lists of genes reported in these studies with our set of putative targets. The results summarized in Table 1 reveal that only 53 out of 178 (30%) genes identified in our experiments have previously been suggested as putative targets of the CDK4/6–pRb–E2F pathway. Furthermore, our analysis reveals a small degree of overlap between the datasets obtained in the previous studies (16–19,26). This could be attributed to the fact that the previous studies involved different experimental systems, namely, ectopic overexpression of E2Fs or introduction of a mutant pRb. Our approach using a transient Rb1 knockdown mimics the normal progression of the cells cycle, when Rb1 is inactivated by phosphorylation at the G1/S transition. The variance in the published results can also be due to the fact that different timepoints and different organisms were used. Another possible explanation is that the E2F overexpression studies utilized E2F1 and E2F3 constructs, while Rb1 is known to bind to E2Fs 1 through 4 and also interact with chromatin-remodeling complexes [for reviews, see (11–13)].
In Table 1, the putative CDK4/6–pRb–E2F pathway targets are classified into functional categories. It can be seen that majority of the genes previously implicated in the pathway are in the categories of DNA biosynthesis (21 out of 46), cell cycle (17 out of 36) and DNA repair (5 out of 18). The novel genes in the cell cycle category are CDC25C, CDC28, Chk1, cyclins C, D3 and F, STK12, STK15 (Aurora 2 kinase), TTK protein kinase, CDKN3, ASK, GSPT1, SNK and RASSF1. Among these genes, only STK15, TTK, GSPT1, CDC28, E2F2 and Chk1 have E2F-binding sites. Thus, they are likely to be direct targets of the CDK4/6–pRb–E2F pathway, while cyclins C, D3 and F, and CDC25C, CDC28, STK12, RASSFF1, SNK, CDKN3 and G0S2 may be induced through different mechanisms. It is known that Rb1 can regulate transcription through chromatic modification mechanisms by forming complexes with HDACs [reviewed in (11,34)].
The STK15/STK6 (Aurora A kinase) is known to be induced at the G2/M transition and during mitosis, and to be involved in cell cycle checkpoint and chromosome segregation. However, it has not been previously implicated in the CDK4/6–pRb–E2F pathway. It has previously been shown (35) that the E2 ubiquitin-conjugating enzyme (UBE2N) binds to STK15/STK6 in human cells resulting in co-localization of the two enzymes in the centrosomes during mitosis. In our experiments, both STK15/STK6 and UBE2N were concurrently induced (Table 1), which is consistent with their involvement in the same mitotic complex. STK15/STK6 has also been shown (36) to bind protein phosphatase type 1, another gene induced in our experiments, in a cell-cycle-dependent manner. Thus, the associations between STK15/STK6 and other members of the Rb1 knockdown signature support the finding that this enzyme is a novel target of the CDK4/6–pRb–E2F pathway.
Chk1 is another gene implicated in this study as a potential direct target of the CDK4/6–pRb–E2F pathway. This gene has previously been reported to have E2F1 functional sites (31), but has not been identified in microarray screens (16–19) as a target of the pathway. Our finding is consistent with the involvement of Rb1 in the DNA damage response pathway (discussed in the previous section).
The Transcription and Signal Transduction categories in Table 1 are relatively rich in genes that have not been previously associated with the Rb1 pathway. One of the most interesting findings here is the possibility that the forkhead transcription factor is a direct target of the CDK4/6–pRb–E2F pathway. The FOXM1 gene is induced 3.8-fold upon Rb1 knockdown, and it has an E2F site. Wang et al. (37) have shown that the FOXM1B transcription factor regulates expression of cell cycle proteins essential for hepatocyte entry into DNA replication and mitosis. It is possible that the forkhead transcription factor may be the link that connects the CDK4/6–pRb–E2F pathway with the multiple mitotic targets that are not directly induced by E2Fs.
The MYCBP (AMY-1) gene (2.1-fold induction; no E2F site) encodes a protein that binds to the N-terminal region of MYC and stimulates the activation of E-box-dependent transcription by MYC (38). This target may serve as a link between the CDK4/6–pRb–E2F pathway and MYC-mediated proliferation control, which includes induction of CDC25A, another indirect target of the CDK4/6–pRb–E2F pathway identified in our analysis.
CONCLUSIONS
We applied siRNA-mediated gene silencing coupled with microarray screening and systematic pathway analysis to obtain insights into the pathways controlled by the target gene. This approach represents a promising strategy in functional genomics, as it allows the researcher to determine the role of the target gene in intracellular pathways. In the future, this approach may be used to create a database of gene expression signatures for various perturbations, such as siRNA-mediated gene knockdowns and treatments with small-molecule inhibitors. This database would then be used as a reference table to analyze new profiles obtained for novel inhibitors, thus providing value in drug target identification and candidate compound selection. Classification based on expression signatures has been applied to cancer and resulted in new drug targets (39–41).
By applying Gene Ontology-based pathway analysis tools, we identified the effects of Rb1 knockdown on cellular pathways. Consistent with previous microarray studies of E2F overexpression, Rb1 knockdown affected G1/S and G2/M transitions of the cell cycle, DNA replication and repair, mitosis, and apoptosis, indicating that siRNA-mediated transient elimination of Rb1 mimics the control of cell cycle through Rb1 dissociation from E2F. Additionally, we observed significant effects on the processes of DNA damage response and epigenetic regulation of gene expression. Our data suggest that Rb1 is involved in the control of the DNA damage response in addition to the regulation of DNA replication and concurrent DNA repair. Analysis of E2F-binding sites is suggested as a method to distinguish between putative direct targets and genes induced through other mechanisms. Another promising approach is to obtain a time course of expression changes and distinguish between direct targets and secondary effects based on the timing of gene expression changes in response to the knockdown of the target.
SUPPLEMENTARY MATERIAL
Supplementary Material is available at NAR Online.
Acknowledgments
ACKNOWLEDGEMENTS
We thank Aparna Sarthy, Xiaoli Huang and Leigh Frost for expert technical assistance, Joel Leverson and Mark Schurdak for helpful and stimulating discussions, and Haiying Zhang and Yan Luo for critical reading of the manuscript.
REFERENCES
- 1.Elbashir S.M., Lendeckel,W. and Tuschl,T. (2001) RNA interference is mediated by 21- and 22-nucleotide RNAs. Genes Dev., 15, 188–200. [DOI] [PMC free article] [PubMed] [Google Scholar]
- 2.Elbashir S.M., Harborth,J., Lendeckel,W., Yalcin,A., Weber,K. and Tuschl,T. (2001) Duplexes of 21-nucleotide RNAs mediate RNA interference in cultured mammalian cells. Nature, 411, 494–498. [DOI] [PubMed] [Google Scholar]
- 3.Zamore P.D. (2001) RNA interference: listening to the sound of silence. Nature Struct. Biol., 8, 746–750. [DOI] [PubMed] [Google Scholar]
- 4.Sharp P.A. (2001) RNA interference—2001. Genes Dev., 15, 485–490. [DOI] [PubMed] [Google Scholar]
- 5.McManus M.T. and Sharp,P.A. (2002) Gene silencing in mammals by small interfering RNAs. Nature Rev. Genet., 3, 737–747. [DOI] [PubMed] [Google Scholar]
- 6.Bernstein E., Denli,A.M. and Hannon,G.J. (2001) The rest is silence. RNA, 7, 1509–1521. [PMC free article] [PubMed] [Google Scholar]
- 7.Dykxhoorn D.M., Novina,C.D. and Sharp,P.A. (2003) Killing the messenger: short RNAs that silence gene expression. Nature Rev. Mol. Cell. Biol., 4, 457–467. [DOI] [PubMed] [Google Scholar]
- 8.Wall N.R. and Shi,Y. (2003) Small RNA: can RNA interference be exploited for therapy? Lancet, 362, 1401–1403. [DOI] [PubMed] [Google Scholar]
- 9.Semizarov D., Frost,L., Sarthy,A., Kroeger,P., Halbert,D.N. and Fesik,S.W. (2003) Specificity of short interfering RNA determined through gene expression signatures. Proc. Natl Acad. Sci. USA, 100, 6347–6352. [DOI] [PMC free article] [PubMed] [Google Scholar]
- 10.Ashburner M., Ball,C.A., Blake,J.A., Botstein,D., Butler,H., Cherry,J.M., Davis,A.P., Dolinski,K., Dwight,S.S., Eppig,J.T. et al. (2000) Gene ontology: tool for the unification of biology. The Gene Ontology Consortium. Nature Genet., 25, 25–29. [DOI] [PMC free article] [PubMed] [Google Scholar]
- 11.Classon M. and Harlow,E. (2002) The retinoblastoma tumour suppressor in development and cancer. Nature Rev. Cancer, 2, 910–917. [DOI] [PubMed] [Google Scholar]
- 12.Kaelin W.G. Jr (1999) Functions of the retinoblastoma protein. Bioessays, 21, 950–958. [DOI] [PubMed] [Google Scholar]
- 13.Dyson N. (1998) The regulation of E2F by pRB-family proteins. Genes Dev., 12, 2245–2262. [DOI] [PubMed] [Google Scholar]
- 14.Qin X.Q., Livingston,D.M., Ewen,M., Sellers,W.R., Arany,Z. and Kaelin,W.G.,Jr (1995) The transcription factor E2F-1 is a downstream target of RB action. Mol. Cell. Biol., 15, 742–755. [DOI] [PMC free article] [PubMed] [Google Scholar]
- 15.Nevins J.R. (1992) E2F: a link between the Rb tumor suppressor protein and viral oncoproteins. Science, 258, 424–429. [DOI] [PubMed] [Google Scholar]
- 16.Muller H., Bracken,A.P., Vernell,R., Moroni,M.C., Christians,F., Grassilli,E., Prosperini,E., Vigo,E., Oliner,J.D. and Helin,K. (2001) E2Fs regulate the expression of genes involved in differentiation, development, proliferation, and apoptosis. Genes Dev., 15, 267–285. [DOI] [PMC free article] [PubMed] [Google Scholar]
- 17.Ishida S., Huang,E., Zuzan,H., Spang,R., Leone,G., West,M. and Nevins,J.R. (2001) Role for E2F in control of both DNA replication and mitotic functions as revealed from DNA microarray analysis. Mol. Cell. Biol., 21, 4684–4699. [DOI] [PMC free article] [PubMed] [Google Scholar]
- 18.Polager S., Kalma,Y., Berkovich,E. and Ginsberg,D. (2002) E2Fs up-regulate expression of genes involved in DNA replication, DNA repair and mitosis. Oncogene, 21, 437–446. [DOI] [PubMed] [Google Scholar]
- 19.Vernell R., Helin,K. and Muller,H. (2003) Identification of target genes of the p16INK4A-pRB-E2F pathway. J. Biol. Chem., 278, 46124–46137. [DOI] [PubMed] [Google Scholar]
- 20.Reynolds A., Leake,D., Boese,Q., Scaringe,S., Marshall,W.S. and Khvorova,A. (2004) Rational siRNA design for RNA interference. Nat. Biotechnol., 22, 326–330. [DOI] [PubMed] [Google Scholar]
- 21.Khvorova A., Reynolds,A. and Jayasena,S.D. (2003) Functional siRNAs and miRNAs exhibit strand bias. Cell, 115, 209–216. [DOI] [PubMed] [Google Scholar]
- 22.Dahlquist K.D., Salomonis,N., Vranizan,K., Lawlor,S.C. and Conklin,B.R. (2002) GenMAPP, a new tool for viewing and analyzing microarray data on biological pathways. Nature Genet., 31, 19–20. [DOI] [PubMed] [Google Scholar]
- 23.Doniger S.W., Salomonis,N., Dahlquist,K.D., Vranizan,K., Lawlor,S.C. and Conklin,B.R. (2003) MAPPFinder: using Gene Ontology and GenMAPP to create a global gene-expression profile from microarray data. Genome Biol., 4, R7. [DOI] [PMC free article] [PubMed] [Google Scholar]
- 24.Kel A.E., Kel-Margoulis,O.V., Farnham,P.J., Bartley,S.M., Wingender,E. and Zhang,M.Q. (2001) Computer-assisted identification of cell cycle-related genes: new targets for E2F transcription factors. J. Mol. Biol., 309, 99–120. [DOI] [PubMed] [Google Scholar]
- 25.Ohtani K., Iwanaga,R., Nakamura,M., Ikeda,M., Yabuta,N., Tsuruga,H. and Nojima,H. (1999) Cell growth-regulated expression of mammalian MCM5 and MCM6 genes mediated by the transcription factor E2F. Oncogene, 18, 2299–2309. [DOI] [PubMed] [Google Scholar]
- 26.Black E.P., Huang,E., Dressman,H., Rempel,R., Laakso,N., Asa,S.L., Ishida,S., West,M. and Nevins,J.R. (2003) Distinct gene expression phenotypes of cells lacking Rb and Rb family members. Cancer Res., 63, 3716–3723. [PubMed] [Google Scholar]
- 27.Helin K. (1998) Regulation of cell proliferation by the E2F transcription factors. Curr. Opin. Genet. Dev., 8, 28–35. [DOI] [PubMed] [Google Scholar]
- 28.Blattner C., Sparks,A. and Lane,D. (1999) Transcription factor E2F-1 is upregulated in response to DNA damage in a manner analogous to that of p53. Mol. Cell. Biol., 19, 3704–3713. [DOI] [PMC free article] [PubMed] [Google Scholar]
- 29.O'Connor D.J. and Lu,X. (2000) Stress signals induce transcriptionally inactive E2F-1 independently of p53 and Rb. Oncogene, 19, 2369–2376. [DOI] [PubMed] [Google Scholar]
- 30.Hofferer M., Wirbelauer,C., Humar,B. and Krek,W. (1999) Increased levels of E2F-1-dependent DNA binding activity after UV- or gamma-irradiation. Nucleic Acids Res., 27, 491–495. [DOI] [PMC free article] [PubMed] [Google Scholar]
- 31.Ren B., Cam,H., Takahashi,Y., Volkert,T., Terragni,J., Young,R.A. and Dynlacht,B.D. (2002) E2F integrates cell cycle progression with DNA repair, replication, and G2/M checkpoints. Genes Dev., 16, 245–256. [DOI] [PMC free article] [PubMed] [Google Scholar]
- 32.Sage J., Mulligan,G.J., Attardi,L.D., Miller,A., Chen,S., Williams,B., Theodorou,E. and Jacks,T. (2000) Targeted disruption of the three Rb-related genes leads to loss of G1 control and immortalization. Genes Dev., 14, 3037–3050. [DOI] [PMC free article] [PubMed] [Google Scholar]
- 33.Weinmann A.S., Yan,P.S., Oberley,M.J., Huang,T.H. and Farnham,P.J. (2002) Isolating human transcription factor targets by coupling chromatin immunoprecipitation and CpG island microarray analysis. Genes Dev., 16, 235–244. [DOI] [PMC free article] [PubMed] [Google Scholar]
- 34.Harbour J.W. and Dean,D.C. (2000) The Rb/E2F pathway: expanding roles and emerging paradigms. Genes Dev., 14, 2393–2409. [DOI] [PubMed] [Google Scholar]
- 35.Ewart-Toland A., Briassouli,P., de Koning,J.P., Mao,J.H., Yuan,J., Chan,F., MacCarthy-Morrogh,L., Ponder,B.A., Nagase,H., Burn,J. et al. (2003) Identification of Stk6/STK15 as a candidate low-penetrance tumor-susceptibility gene in mouse and human. Nature Genet., 34, 403–412. [DOI] [PubMed] [Google Scholar]
- 36.Katayama H., Zhou,H., Li,Q., Tatsuka,M. and Sen,S. (2001) Interaction and feedback regulation between STK15/BTAK/Aurora-A kinase and protein phosphatase 1 through mitotic cell division cycle. J. Biol. Chem., 276, 46219–46224. [DOI] [PubMed] [Google Scholar]
- 37.Wang X., Kiyokawa,H., Dennewitz,M.B. and Costa,R.H. (2002) The Forkhead Box m1b transcription factor is essential for hepatocyte DNA replication and mitosis during mouse liver regeneration. Proc. Natl Acad. Sci. USA, 99, 16881–16886. [DOI] [PMC free article] [PubMed] [Google Scholar]
- 38.Taira T., Maeda,J., Onishi,T., Kitaura,H., Yoshida,S., Kato,H., Ikeda,M., Tamai,K., Iguchi-Ariga,S.M. and Ariga,H. (1998) AMY-1, a novel C-MYC binding protein that stimulates transcription activity of C-MYC. Genes Cells, 3, 549–565. [DOI] [PubMed] [Google Scholar]
- 39.Ramaswamy S., Tamayo,P., Rifkin,R., Mukherjee,S., Yeang,C.H., Angelo,M., Ladd,C., Reich,M., Latulippe,E., Mesirov,J.P. et al. (2001) Multiclass cancer diagnosis using tumor gene expression signatures. Proc. Natl Acad. Sci. USA, 98, 15149–15154. [DOI] [PMC free article] [PubMed] [Google Scholar]
- 40.van't Veer L.J., Dai,H., van de Vijver,M.J., He,Y.D., Hart,A.A., Mao,M., Peterse,H.L., van der Kooy,K., Marton,M.J., Witteveen,A.T. et al. (2002) Gene expression profiling predicts clinical outcome of breast cancer. Nature, 415, 530–536. [DOI] [PubMed] [Google Scholar]
- 41.Bittner M., Meltzer,P., Chen,Y., Jiang,Y., Seftor,E., Hendrix,M., Radmacher,M., Simon,R., Yakhini,Z., Ben-Dor,A. et al. (2000) Molecular classification of cutaneous malignant melanoma by gene expression profiling. Nature, 406, 536–540. [DOI] [PubMed] [Google Scholar]
Associated Data
This section collects any data citations, data availability statements, or supplementary materials included in this article.