Significance
The mechanism by which Mycobacterium tuberculosis (Mtb) modulates the host immune response is not fully understood. We have used a systems biology approach to generate a microRNA regulatory network composed of 77 microRNAs that are associated with Mtb–macrophage interactions. We have determined a unique and dual role for one of these regulators, miR-155, as a rheostat regulating the survival of both innate and adaptive immune cells. On the one hand, miR-155 maintains the survival of Mtb-infected macrophages, providing a niche favoring bacterial replication. On the other hand, miR-155 maintains the survival of Mtb-specific T cells, enabling an effective adaptive response. Our work underscores the value of systems-based prediction of pathogen-specific microRNA networks as a tool to define host–pathogen interactions.
Keywords: miR-155, microRNA, Mycobacterium tuberculosis, macrophage, T cell
Abstract
The regulation of host–pathogen interactions during Mycobacterium tuberculosis (Mtb) infection remains unresolved. MicroRNAs (miRNAs) are important regulators of the immune system, and so we used a systems biology approach to construct an miRNA regulatory network activated in macrophages during Mtb infection. Our network comprises 77 putative miRNAs that are associated with temporal gene expression signatures in macrophages early after Mtb infection. In this study, we demonstrate a dual role for one of these regulators, miR-155. On the one hand, miR-155 maintains the survival of Mtb-infected macrophages, thereby providing a niche favoring bacterial replication; on the other hand, miR-155 promotes the survival and function of Mtb-specific T cells, enabling an effective adaptive immune response. MiR-155–induced cell survival is mediated through the SH2 domain-containing inositol 5-phosphatase 1 (SHIP1)/protein kinase B (Akt) pathway. Thus, dual regulation of the same cell survival pathway in innate and adaptive immune cells leads to vastly different outcomes with respect to bacterial containment.
The causative agent of tuberculosis (TB), Mycobacterium tuberculosis (Mtb), often leads to a nonresolving chronic infection. Containment of Mtb requires effective immune responses from both the innate and adaptive arms of the immune system, where interactions between CD4+ T cells and macrophages are critical for controlling bacterial growth (1). Tight regulation of the immune response is crucial to allow for effective activity of each of these cell types while preventing excessive inflammation and pathology. It is likely that many of the regulatory host factors involved in this process are still unidentified. Systems biology approaches are ideally suited to dissect complex regulatory pathways of this kind. Preliminary analysis suggested a role for microRNAs (miRNAs) in regulating the immune response of the host to Mtb.
MiRNAs are a class of small, noncoding RNAs implicated in posttranscriptional regulation (2, 3). Work from a number of laboratories has demonstrated a role for miRNAs in the differentiation of mammalian immune cells, and in the immune response to cancer, infections, and other diseases of immunological origin (2, 4). One of the primary ways miRNAs regulate cellular signaling is through mRNA degradation (5). By taking advantage of the fact that miRNAs target many mRNA transcripts simultaneously, miRNA-mediated regulation can be inferred by discovering coordinated changes in temporal transcriptome profiles from genes that are enriched with a specific miRNA-binding site in their 3′ UTR (6).
Using systems-level integrative approaches, we constructed a miRNA regulatory network for the innate immune response to Mtb infection by macrophages (7). The network suggested a role for seven miRNAs in regulating the host response to Mtb, with miR-155 being pivotal. This miRNA has previously been implicated in myeloid and lymphoid cell activation, where it appears to exert control over inflammation and formation of immunological memory (8, 9).
We report here that miR-155 regulates similar cellular pathways in both macrophages and T cells, yet these processes have opposite impacts on control of Mtb. In macrophages, miR-155 promotes cell survival and propagation of bacteria, whereas in T cells miR-155 promotes the long-term maintenance of Mtb-specific T cells capable of secreting effector cytokines required to control infection.
Results
Construction of a Putative miRNA Regulatory Network in Macrophages During Mtb Infection.
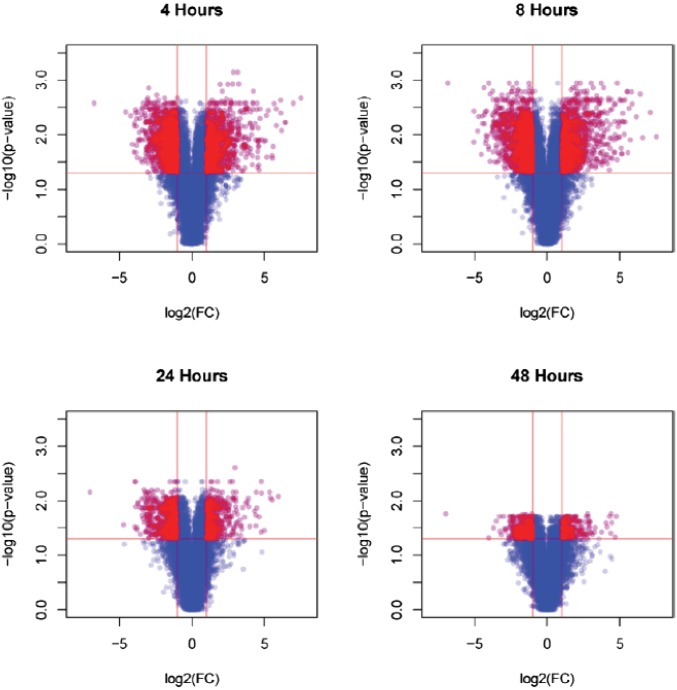
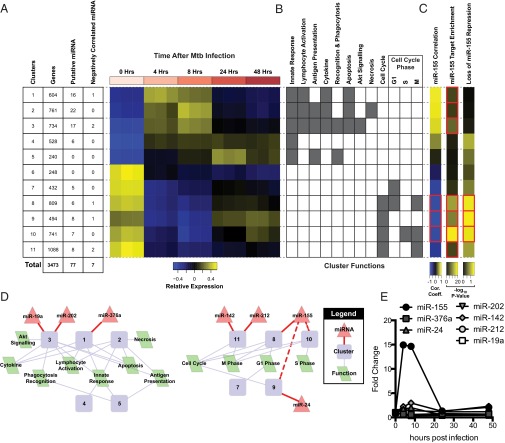
To assess the role of miRNAs in the regulation of the innate immune response, we characterized the transcriptional response of bone marrow-derived macrophages (BMMs) at 4, 8, 24, and 48 h following infection with Mtb and selected 3,473 differentially expressed genes based on the following criteria: Benjamini–Hochberg corrected Student’s t test P value ≤ 0.05 and fold-change ≥ 2 (Fig. S1). Using these differentially expressed genes, we discovered 11 distinct temporal gene expression signatures that underlie the macrophage transcriptional response to Mtb infection (Fig. 1A) (7). We further characterized the clusters using Gene Ontology (GO) annotation (Fig. 1B); clusters 1–5 were comprised mainly of immune response genes and were up-regulated for the first 8 h and subsequently down-regulated. Clusters 6–11 were transiently down-regulated and were mainly comprised of genes involved in cellular proliferation (Fig. 1B). The identification of these clusters served as a basis for modeling miRNA regulation during the temporal waves of transcription.
Fig. S1.
Differentially expressed genes in WT macrophages at 4, 8, 24, and 48 h after Mtb infection. Shown are volcano plots representing data obtained from gene arrays outlined in Materials and Methods. The 3,473 genes significantly differentially expressed and highlighted red (Benjamini–Hochberg corrected Student’s t test, P value ≤ 0.05 and fold-change ≥ 2) between mock-infected and each time point were used for gene regulatory network construction.
Fig. 1.
MiRNA gene regulatory network for the macrophage response to Mtb infection. (A) The 11 temporal gene expression profiles of macrophage innate immune response to Mtb infection. Each row corresponds to a different temporal gene expression signature (cluster) and each column to a different replicate of the uninfected control (0 h) and time points postinfection (4, 8, 24, and 48 h). (Left) The number of genes per cluster, number of putative miRNAs regulating the cluster, and number of those putative miRNA regulators whose expression is significantly negatively correlated with the cluster’s temporal expression signature. (B) Functional characterization of temporal gene expression signatures. Gray squares indicate significant associations of an enriched GO biological process in a cluster to a hallmark of infection. (C) Three complementary methods to demonstrate miR-155–mediated regulation for temporal gene expression signatures: (i) correlation coefficients for miR-155 expression compared with each cluster’s temporal gene expression signature (red boxes indicate significant negative correlation), (ii) significance for enrichment [–log10(P values)] of genes targeted by miR-155 in each cluster (red boxes indicate significant enrichment), and (iii) significance for loss of miR-155–mediated repression in macrophages from miR-155−/− mice (red boxes indicate significant loss of repression). (D) MiRNA regulators that are significantly differentially expressed and anticorrelated with the genes they are inferred to regulate. Diamond nodes are miRNA regulators, circle nodes are metaclusters, and the parallelogram nodes are functions enriched in the clusters. Solid red lines indicate predicted miRNA regulators; dashed red lines indicate additional regulation determined through experimental validation. (E) Fold change in expression of seven negatively correlated miRNAs over the course of infection compared with 0 h.
Predicting MiRNA Regulators of Innate Transcriptional Response to Mtb.
We found 77 putative miRNA regulators associated with the 11 temporal gene expression signatures by training the network using the Framework for Inference of Regulation by miRNAs (FIRM) (6) (Fig. 1A). miRNA-mediated repression of transcript levels was predicted for seven of the putative miRNA regulators (Fig. 1A and Table S1; correlation coefficient ≤ –0.65 and Benjamini–Hochberg corrected P value ≤ 0.05). Four miRNAs were significantly up-regulated (miR-24, miR-142, miR-155, and miR-212), and three were down-regulated (miR-19a, miR-202, and miR-376a) in response to Mtb infection relative to uninfected controls (Benjamini–Hochberg corrected P value ≤ 0.05 and fold-change ≥ 2; Fig. 1D and Table S1). Thus, by applying a systems-level integrative approach, we constructed a regulatory network consisting of seven miRNAs that are predicted to regulate the macrophage response to Mtb infection. We decided to validate the prediction using miR-155 as a prototype, as a miR-155−/− mouse was available (10).
Table S1.
MiRNA regulators of macrophage innate immune responses to Mtb infection
| Correlation of miRNA with cluster eigengene | Differential expression of miRNAs across time series | ||||||||||
| 4 h | 8 h | 24 h | 48 h | ||||||||
| Cluster | miRNA | R | Adjusted Pa | FC | P | FC | P | FC | P | FC | Pe |
| 8 | miR-155 | −0.91 | 2.9 × 10⁻⁴ | 14.92 | 6.6 × 10⁻⁴ | 14.64 | 1.9 × 10⁻⁴ | 1.32 | 3.7 × 10⁻¹ | 2.10 | 7.9 × 10⁻² |
| 1 | miR-376a | −0.78 | 1.3 × 10⁻² | 0.67 | 5.7 × 10⁻³ | 0.61 | 8.3 × 10⁻³ | 0.78 | 9.0 × 10⁻³ | 0.70 | 3.2 × 10⁻² |
| 9 | miR-24 | −0.73 | 2.6 × 10⁻² | 1.70 | 1.0 × 10⁻¹ | 2.00 | 1.5 × 10⁻¹ | 0.47 | 3.1 × 10⁻² | 0.58 | 2.8 × 10⁻² |
| 3 | miR-202 | −0.70 | 2.9 × 10⁻² | 0.60 | 4.4 × 10⁻² | 0.64 | 4.5 × 10⁻² | 0.63 | 3.2 × 10⁻² | 0.57 | 1.5 × 10⁻¹ |
| 11 | miR-142 | −0.69 | 3.4 × 10⁻² | 2.23 | 6.2 × 10⁻² | 2.98 | 5.8 × 10⁻³ | 1.26 | 2.9 × 10⁻¹ | 2.29 | 8.4 × 10⁻³ |
| 11 | miR-212 | −0.68 | 3.4 × 10⁻² | 1.57 | 4.1 × 10⁻³ | 1.42 | 3.1 × 10⁻² | 1.16 | 2.9 × 10⁻¹ | 1.18 | 1.9 × 10⁻¹ |
| 3 | miR-19a | −0.67 | 3.7 × 10⁻² | 0.54 | 7.5 × 10⁻³ | 0.38 | 1.1 × 10⁻¹ | 0.43 | 5.5 × 10⁻³ | 0.46 | 3.9 × 10⁻³ |
Shown are miRNAs negatively correlated with the metacluster they are predicted to regulate and differentially expressed across the time course of Mtb infection. FC, fold change.
P values were adjusted using Benjamini–Hochberg correction.
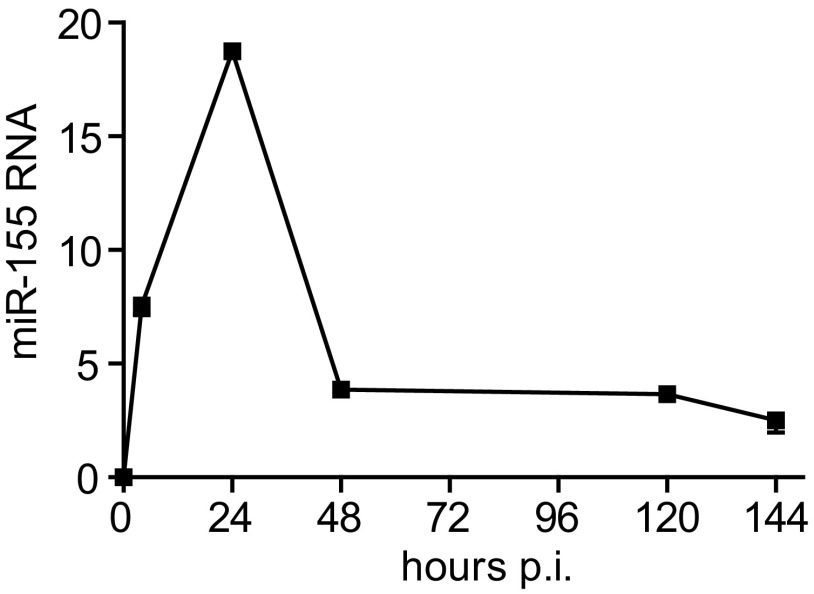
Profiling of these miRNAs in Mtb-infected mouse macrophages demonstrated a 15-fold induction for miR-155 early after infection (Fig. 1E and Table S1), which was validated by quantitative PCR (Fig. S2). The expression of miR-155 decreased to twofold over baseline after 48 h. We then validated the predicted regulation of target genes by miR-155 during Mtb infection by comparing the response of WT macrophages to macrophages from miR-155−/− mice. Transcription profiles were collected at 8 h postinfection, a time point when miR-155 expression is highest. Transcript levels of a number of genes that were significantly enriched with miR-155 binding sites (P value = 5.0 × 10⁻⁶) were down-regulated in WT macrophages but not in miR-155−/− cells. More specifically, in macrophages from miR-155−/− mice, there was a significant loss of repression for cluster 8, 9, and 10 genes (P values < 0.05) (Fig. 1C and Table S2). These clusters were both negatively correlated with miR-155 expression and enriched with predicted miR-155 targets (Fig. 1C and Table S2).
Fig. S2.
miR-155 expression in WT macrophages after Mtb-infection. Shown is the quantification of miR-155 RNA levels, relative to control RNA Sno202, in WT naive and Mtb-infected macrophages by qPCR.
Table S2.
MiR-155 regulatory effects on temporal gene expression signatures
| Correlation of miR-155 with cluster eigengene | Enrichment of miR-155 target genes | Relative repression in miR-155 KO vs. WT | ||||
| Cluster | R | Adjusted Pa | miR-155 target genes | Enrichment P | FC | P |
| 1 | 0.96 | 1.0 × 10⁻⁷ | 132 | 4.7 × 10⁻⁶ | 0.93 | 9.2 × 10⁻¹ |
| 2 | 0.93 | 2.6 × 10⁻⁶ | 157 | 2.1 × 10⁻⁵ | 0.95 | 8.8 × 10⁻¹ |
| 3 | 0.84 | 1.8 × 10⁻⁴ | 167 | 1.8 × 10⁻⁸ | 0.96 | 7.2 × 10⁻¹ |
| 4 | 0.53 | 5.0 × 10⁻² | 102 | 4.2 × 10⁻³ | 1.10 | 1.0 × 10⁻¹ |
| 5 | 0.14 | 6.3 × 10⁻¹ | 45 | 5.6 × 10⁻² | 1.11 | 2.3 × 10⁻¹ |
| 6 | −0.38 | 1.8 × 10⁻¹ | 48 | 3.1 × 10⁻² | 1.09 | 3.8 × 10⁻¹ |
| 7 | −0.79 | 8.2 ×× 10−4 | 93 | 1.7 × 10⁻⁴ | 0.90 | 1.9 × 10⁻¹ |
| 8 | −0.91 | 8.5 × 10⁻⁶ | 200 | 3.1 × 10⁻¹³ | 0.86 | 4.2 × 10⁻² |
| 9 | −0.98 | 2.7 × 10⁻⁹ | 129 | 9.4 × 10⁻¹¹ | 0.84 | 3.4 × 10⁻² |
| 10 | −0.88 | 3.1 × 10⁻⁵ | 209 | 1.7 × 10⁻²⁰ | 0.87 | 4.7 × 10⁻² |
| 11 | −0.69 | 6.1 × 10⁻³ | 218 | 5.4 × 10⁻⁶ | 0.92 | 1.2 × 10⁻¹ |
Follow-up analyses of miR-155 that show which metaclusters are negatively correlated with miR-155 expression, are enriched with miR-155 target genes, and have a significant drop in relative repression due to miR-155 KO. FC, fold change.
P values were adjusted using Benjamini–Hochberg correction.
MiR-155 Regulation of Macrophage Survival During Mtb Infection.
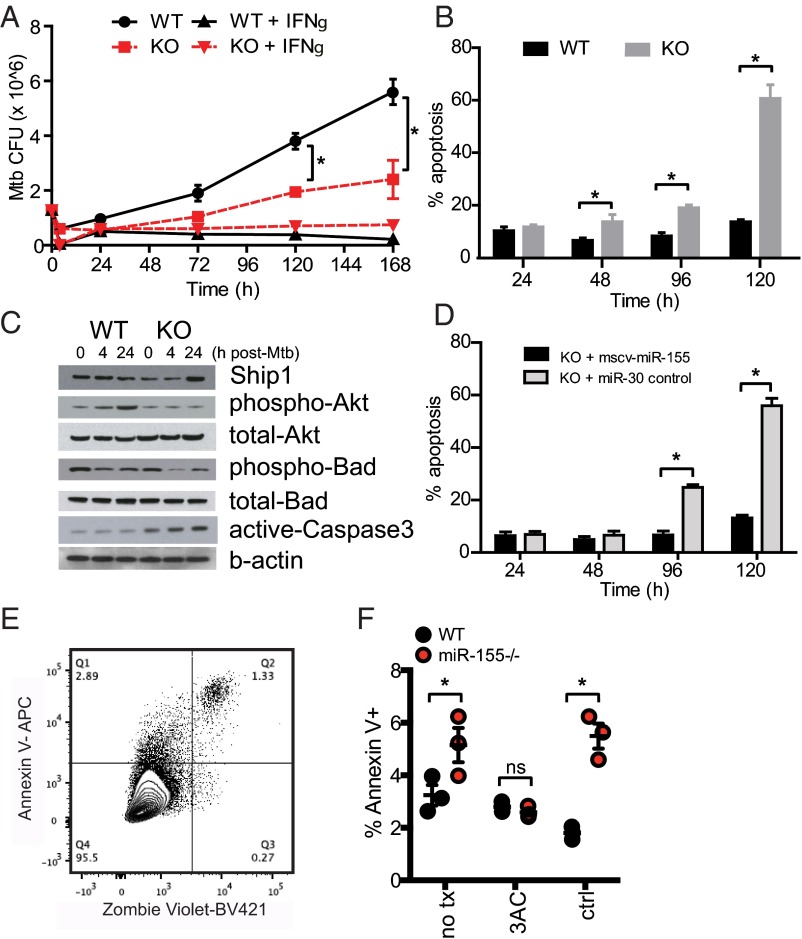
The increase in expression of miR-155 in response to Mtb infection and enrichment of its binding sites in down-regulated genes suggested miR-155 is central to the innate response of macrophages to Mtb. To demonstrate this effect directly, WT and miR-155−/− BMMs were infected with Mtb in vitro. miR-155−/− macrophages showed a reduction in Mtb growth over a period of 7 d compared with WT controls (Fig. 2A). Virulent Mtb manipulates cell survival and/or death pathways in host macrophages to evade innate immunity, facilitate bacterial dissemination, and delay the initiation of adaptive immunity (11–13). We found that Mtb-infected miR-155−/− macrophages demonstrated enhanced cellular apoptosis compared with Mtb-infected WT macrophages, as measured by the detection of DNA–nucleosome complex formation via ELISA (Fig. 2B).
Fig. 2.
Regulation of miR-155 on macrophage survival during Mtb infection. (A) Mtb growth kinetics in WT control or miR-155−/− macrophages ± IFNγ treatment. (B) Quantification of DNA–nucleosome complexes by ELISA to determine apoptosis in WT and miR-155−/− macrophages infected with Mtb. Percent apoptosis data are represented as the ratio of infected:uninfected cells relative to a positive control. (C) Immunoblotting of SHIP1, phospho/total-Akt, phosho/total-Bad, and active caspase-3 in WT or miR-155−/− macrophages infected with Mtb. (D) ELISA of DNA–nucleosome complexes to determine apoptosis in miR-155−/− macrophages expressing a control miR-30 or complemented with a retrovirus expressing miR-155 and infected with Mtb. Data represent percentage of apoptosis of Mtb-infected cells minus basal apoptosis in uninfected cells; data are plotted relative to a staurosporine-positive control that represents 100% apoptosis. (E) Flow cytometry panel for macrophage viability; pregated on leukocytes, single cells, F4/80+, and H37Rv+ cells. (F) Percentage of Annexin V+ Mtb-infected WT and miR-155−/− macrophages 24 h postinfection in the presence of SHIP1 inhibitor 3AC (6.25 μM) or vehicle control (ctrl). Error bars denote SEM. Unpaired two-tailed Student’s t test *P value < 0.05 (A and B), *P value < 0.01 (D), and unpaired two-tailed Student’s t test with multiple comparison correction *P value < 0.01 (F). Results are representative of three (A, B, and D) independent experiments.
MiRNAs are also known to negatively regulate protein levels by blocking translation or by targeting mRNAs for degradation. Previous studies demonstrated that miR-155 targets the 3′ UTR of the mRNA of SH2 domain-containing inositol 5-phosphatase 1 (SHIP1), an inositol phosphatase that functions to modify the PI3K/Akt signaling pathway, which in turn has a role in proliferation and survival of a variety of cell types (14–16). In agreement with these studies, SHIP1 protein levels were increased in miR-155−/− macrophages compared with WT cells (Fig. 2C) at 24 h postinfection. Consistent with higher SHIP1 levels, miR-155−/− macrophages exhibited decreased phosphorylation of Akt1 compared with WT cells (Fig. 2C). The diminished phosphorylation of Akt1 was associated with decreased phosphorylation of Bad, a regulator of caspase-3–mediated apoptosis (Fig. 2C). The caspase-3–mediated apoptosis pathway was further reinforced by the observation that ectopically expressed miR-155 rescued the apoptosis phenotype (Fig. 2D). The role of SHIP1 in miR-155–dependent macrophage survival was probed with 3AC, a SHIP1 inhibitor. To assess the effect of SHIP1 inhibition on macrophage viability during Mtb infection, we measured the surface expression of Annexin V and the uptake of the viability dye Zombie Violet (Fig. 2E). At 24 h postinfection, miR-155−/− macrophages had a higher percentage of dead or dying cells than did WT macrophages. This phenotype was reversed by 3AC (Fig. 2F).
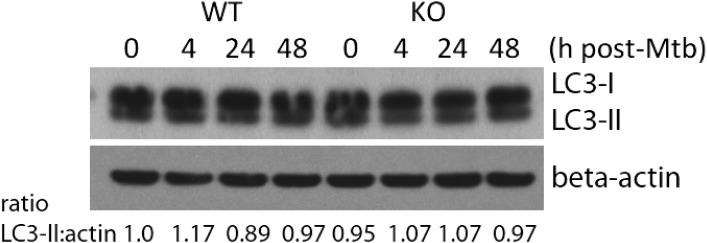
A previous study suggested that miR-155 induces autophagosomes in macrophages, thus promoting the maturation of mycobacterial phagosomes and decreasing the survival rate of intracellular mycobacteria (17). This was not the case in our system. There was no difference in autophagosome formation in primary miR-155−/− and WT control macrophages challenged with virulent Mtb as assessed by LC3I to LC3II lipidation (Fig. S3). These data suggest that blockade of the SHIP1 pathway by miR-155 leads to increased macrophage viability and increased bacterial growth during the innate response to Mtb.
Fig. S3.
LC3-II levels in Mtb-infected miR-155−/− macrophages. Quantification of LC3-II relative to control beta-actin in naïve and Mtb-infected WT control and miR-155−/− macrophages by Western blot analysis. The ratio of LC3II to beta-actin was measured by densitometry.
Enhanced Mtb Control by miR-155−/− Mice Early During Infection.
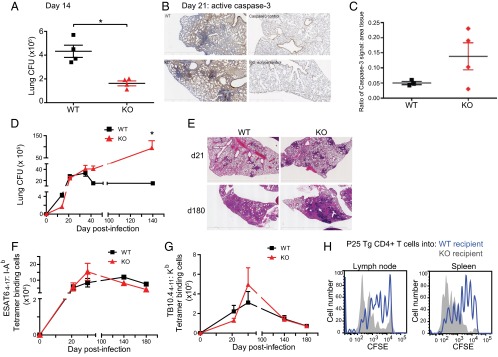
To determine the consequences of miR-155 deficiency on infection in vivo, we infected miR-155−/− mice and WT control mice with Mtb via the aerosol route. MiR-155−/− mice had a lower bacterial burden 2 wk postinfection (Fig. 3A; P < 0.05), suggesting that Mtb-induced miR-155 alters the innate immune response, resulting in enhanced Mtb growth. This is consistent with our in vitro data demonstrating restriction of bacterial growth in miR-155−/− macrophages (Fig. 2A). To assess whether this early bacterial control was correlated with an increased rate of apoptosis, as observed in our macrophage in vitro system (Fig. 2 B and F), we stained lung samples for active caspase-3 at 21 d postinfection and observed an increase in active caspase-3 staining in miR-155−/− lung samples compared with WT samples (Fig. 3 B and C). This suggests that an increase in apoptosis in miR-155−/− lungs might contribute to the decrease in bacterial burden early during infection.
Fig. 3.
Effect of miR-155 on the course of TB. (A) Mtb burden (cfu) in the lungs of WT control and miR-155−/− mice at day 14 post-low dose aerosol challenge (75–100 cfu Mtb; four mice per group, per time point). *P value < 0.05. (B) Active caspase-3 staining WT and miR-155−/− lung samples at 21 d postinfection. (C) Cleaved caspase-3 staining quantified compared with area defined by background tissue hematoxylin stain. (D) Mtb burden (cfu) in the lungs of WT and miR-155−/− mice at 14, 21, 35, 42, and 140 d post–low-dose aerosol challenge with Mtb. Four to six mice were used per group per time point. (E) TB lung lesion histopathology of WT and miR-155−/− mice 21 and 180 d following low-dose aerosol infection with Mtb. Panels show H&E staining; original magnification, ×12.5. (F) Total number of ESAT-64–17:I-Ab tetramer-binding CD4+ T cells recovered from lungs of WT or miR-155−/− mice at 21, 35, 140, and 180 d post–low-dose aerosol challenge with Mtb (three to four mice per group, per time point). (G) Total number of TB10.44–11:Kb tetramer-binding CD8+ T cells recovered from lungs of WT or miR-155−/− mice in the same experiment shown in F. (H) CFSE-labeled CD4+ T cells (105) from P25 TCR Tg mice were adoptively transferred at 20 d postinfection into Mtb-infected WT (blue histogram) or miR-155−/− (gray histogram) recipient mice and analyzed 5 d posttransfer. Results are representative of three independent experiments with three Mtb-infected mice per group. Error bars denote SEM.
Impaired Mtb Control by miR-155−/− Mice Late During Infection.
Despite enhanced control of infection early on, miR-155−/− mice had a higher pulmonary Mtb load than WT mice during the chronic phase of infection (Fig. 3D) and exhibited an increased amount of inflammatory pulmonary damage (Fig. 3E). This observation is supported by a previous study (18).
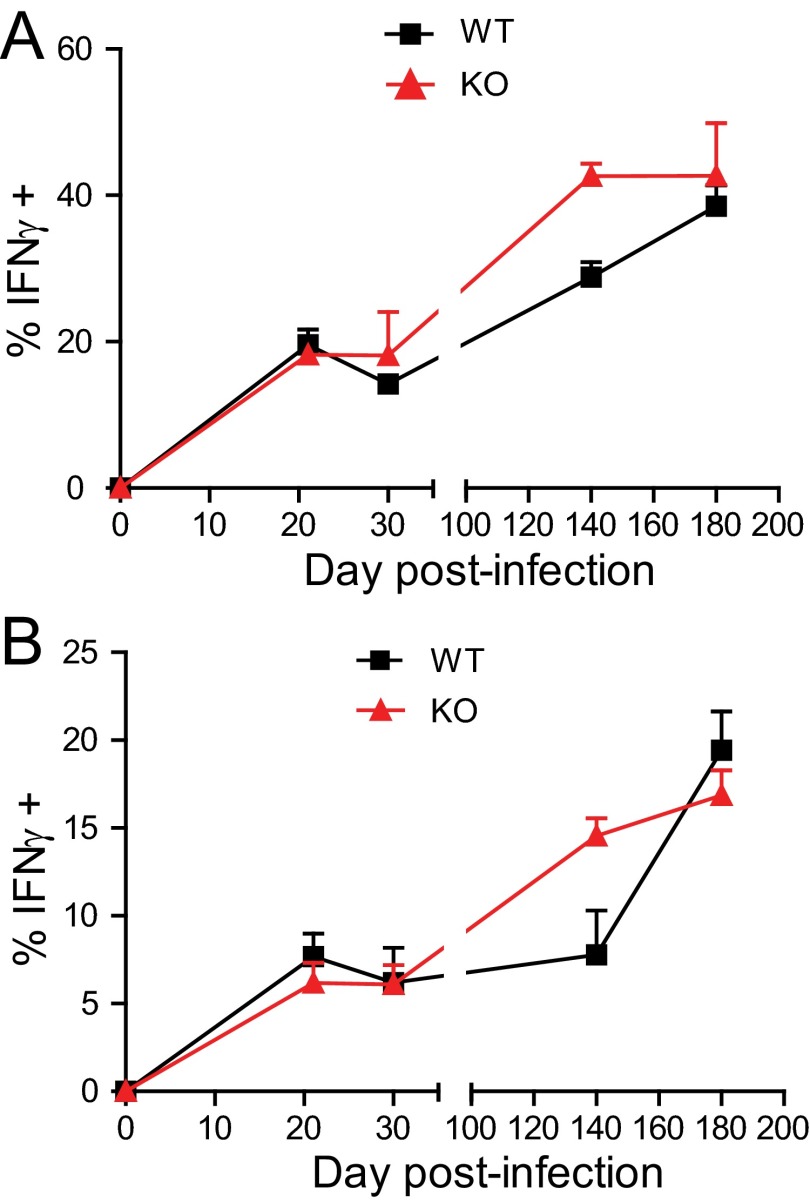
To understand the mechanisms underlying this response, we examined the ability of miR-155−/− mice to establish and sustain a T-cell response to infection. Using MHC class II (ESAT-64–17:I-Ab) and MHC class I (TB10.44–11:Kb) tetramers containing immunodominant Mtb epitopes recognized by CD4+ and CD8+ T cells in C57BL/6 mice, we observed comparable numbers of Mtb-specific CD4+ and CD8+ T cells in the lungs of WT and miR-155−/− mice, both during the onset of adaptive immunity and during chronic stages of infection (Fig. 3 F and G and Fig. S4). The finding that miR-155−/− mice had similar numbers of Mtb-specific T cells in their lungs despite having increased bacterial burden suggested the possibility that miR-155 may indeed regulate Mtb-specific T-cell responses, as elevated lung bacterial burdens are usually associated with higher Mtb-specific T-cell numbers (19).
Fig. S4.
WT and miR-155−/− Mtb-specific CD4+ and CD8+ T-cell production of IFNγ during Mtb infection. Percentage of ESAT-64–17:I-Ab tetramer-binding CD4+ T cells (A) and percentage of TB10.44–11:Kb tetramer-binding CD8+ T cells (B) from the lungs of WT or miR-155−/− mice producing IFNγ directly ex vivo at days 21, 35, 140, and 180 after Mtb infection (three to four mice per group per time point). Error bars denote SEM and are representative of three independent experiments.
Robust Proliferation by WT T Cells in Mtb-Infected MiR-155−/− Mice.
T-cell responses could be shaped by miR-155 either directly via T-cell–intrinsic effects or indirectly by alterations in the inflammatory milieu and/or the function of antigen-presenting cells. To test the latter, we transferred naïve, carboxyfluorescein succinimidyl ester (CFSE)-labeled CD4+ T cells (CD45.1) from P25 TCR transgenic (Tg) mice (20), which recognize an immunodominant epitope of Mtb, Antigen 85B, into either WT or miR-155−/− recipients that had been infected with Mtb 21 d prior (Fig. 3H). Five days after the transfer, P25 Tg T cells were recovered from the lymph nodes and spleens of the recipients using magnetic bead enrichment of CD45.1-expressing cells (21). The transferred cells underwent increased proliferation in the miR-155−/− mice compared with WT recipients (Fig. 3H), suggesting that the inflammatory milieu in Mtb-infected miR-155−/− mice promotes superior expansion of Mtb-specific CD4+ T cells.
MiR-155 Regulation of T-Cell–Intrinsic Maintenance in Response to Mtb Infection.
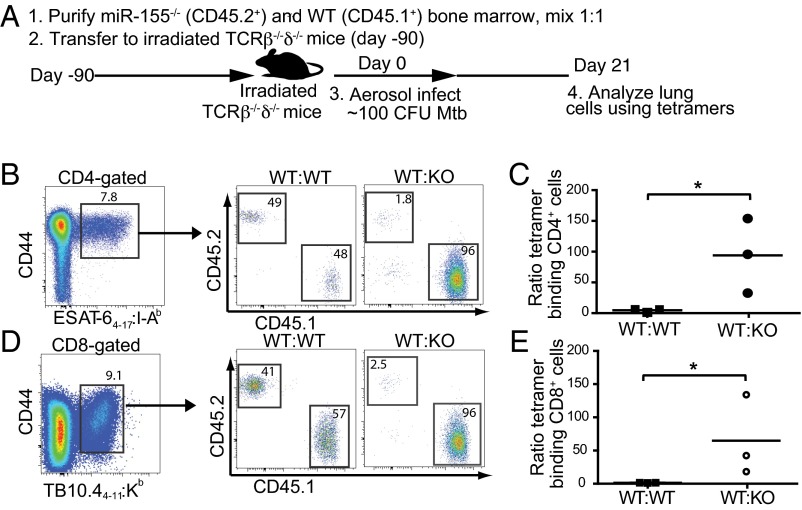
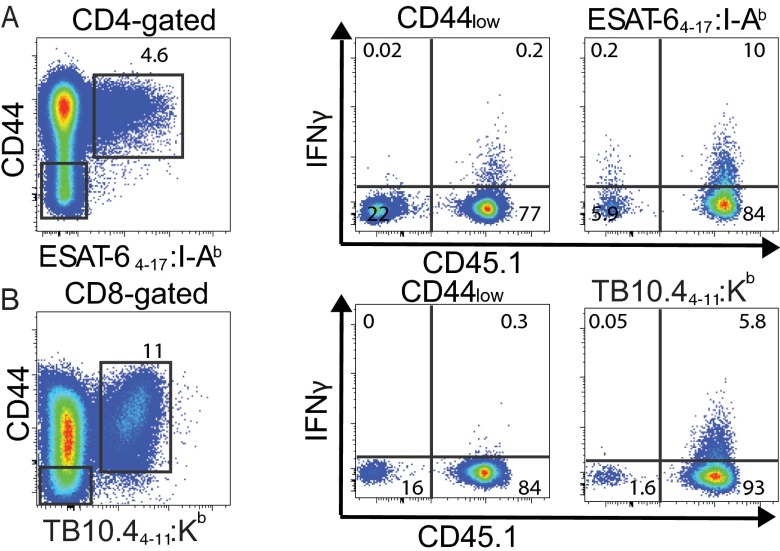
Because Mtb-infected miR-155−/− mice exhibited similar numbers of Mtb-specific T cells as WT mice despite an elevated bacterial burden and an inflammatory milieu conducive to T-cell expansion, we hypothesized that miR-155−/− T cells were intrinsically impaired in their ability to proliferate and/or survive. To directly compare the function of WT and miR-155−/− T cells in identical in vivo conditions, we generated mixed-bone marrow chimeric mice by reconstituting sublethally irradiated (600R) T-cell–deficient (TCRβ−/−δ−/−) mice with a 1:1 mix of WT (CD45.1) and miR-155−/− (CD45.2) bone marrow (Fig. 4A). WT:WT (CD45.1:CD45.2) mixed-bone marrow chimeras were also generated as controls. Ninety days following reconstitution and before Mtb infection, we found that WT and miR-155−/− CD4+ and CD8+ T cells were maintained at an approximate 1:1 ratio in the blood, lungs, spleen, and lymph nodes (Fig. S5). At day 21 postinfection, however, significantly fewer Mtb-specific CD4+ and CD8+ T cells were recovered from the lungs of miR-155−/− mice compared with their WT counterparts (Fig. 4 B–E). The dramatic skewing toward WT tetramer-binding T cells was in large part driven by their recognition of Mtb antigens, as naïve CD44low T cells that did not bind tetramers were recovered in only 3–5-fold higher numbers in WT compared with miR-155−/− mice (Fig. S6 A and B).
Fig. 4.
Intrinsic expression of miR-155 in Mtb-specific T cells regulates their expansion. (A) Schematic of experimental design. To generate mixed-bone marrow chimeric mice, 5 × 10⁶ WT (CD45.1 or CD45.2) conventional CD4+ T cells and 5 × 10⁶ miR-155−/− conventional CD4+ cells (CD45.2) were cotransferred into sublethally irradiated (600R) TCRβ−/−δ−/−-deficient mice 12 wk before Mtb challenge. Mixed-bone marrow chimeric mice were challenged with low-dose aerosol Mtb and analyzed 21 d postinfection. (B and D) Representative flow cytometric analysis showing the percentage of WT (CD45.1) and miR-155−/− (CD45.2) cells within CD4+ ESAT-64–17:I-Ab (B) and CD8+ TB10.44–11:Kb (D) tetramer-binding populations from the lungs of chimeric mice at 21 d postinfection. Percentages within WT:WT control chimeras are also shown. (C and E) Cumulative data showing the ratio of CD45.1: CD45.2 cells within the CD4+ ESAT-64–17:I-Ab (C) and CD8+ TB10.44–11:Kb (E) tetramer-binding population. Closed squares represent individual WT:WT chimeric mice; closed circles represent individual WT:KO chimeric mice. *P < 0.01.
Fig. S5.
Ratios of WT to miR-155−/− T cells maintained in mixed-bone marrow chimeras before Mtb infection. Ratios of WT (CD45.1+) to miR-155−/− (CD45.2+) CD3+, CD4+, and CD8+ T cells isolated from the thoracic lymph node, spleen, lung, and blood of uninfected mixed-bone marrow chimeric mice, 90 d post-bone marrow reconstitution.
Fig. S6.
Comparison of skewing between WT and miR-155−/− naïve (CD44low) and Mtb-specific T cells. Representative flow cytometric analysis showing direct ex vivo intracellular IFNγ and CD45.1+ expression on CD44low or ESAT-64–17:I-Ab tetramer-binding CD4+ T cells (A) and CD44low or TB10.44–11:Kb tetramer-binding CD8+ T cells (B) isolated from the lungs of mixed-bone marrow chimeric mice (WT, CD45.1+; miR-155−/−, CD45.2+) 21 d postinfection with Mtb. (Left) The gated populations.
Control of Cytokine Production by MiR-155 in Mtb-Specific T Cells.
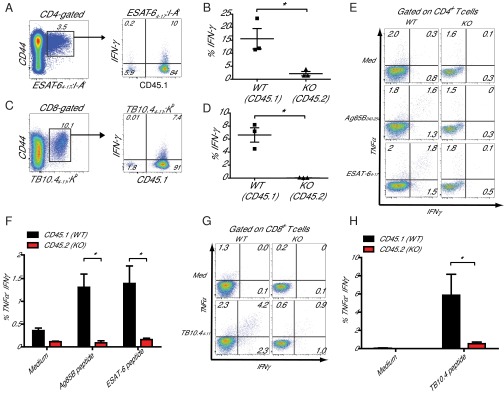
Next, we examined whether miR-155 regulates the ability of Mtb-specific CD4+ T cells to produce IFNγ, a cytokine critical for activating macrophages to control intracellular Mtb. First, we compared in vivo IFNγ production by Mtb-specific, WT, and miR-155−/− CD4+ and CD8+ T cells in mixed-bone marrow chimeric mice by performing direct ex vivo cytokine staining in the absence of restimulation. Although lung-resident WT Mtb-specific T cells produced IFNγ robustly, miR-155−/− Mtb-specific T cells produced little or no IFNγ, at levels similar to naive CD44low T cells (Fig. 5 A–D and Fig. S6 A and B). Next, we examined the capacity of WT and miR-155−/− T cells from the lungs of these chimeras to produce IFNγ and TNFα after in vitro peptide restimulation. We found that the frequencies of miR-155−/− Mtb-specific CD4+ and CD8+ T cells that produced IFNγ alone or coproduced IFNγ and TNFα in response to peptide stimulation were dramatically reduced compared with WT levels (Fig. 5 E–H). Thus, in addition to regulating the maintenance of antigen-specific CD4+ and CD8+ T cells during Mtb infection, T-cell–intrinsic expression of miR-155 regulates the ability of T cells to produce protective cytokines.
Fig. 5.
miR-155−/− T cells have a diminished capacity to produce cytokines. (A) Representative flow cytometric analysis showing direct ex vivo intracellular IFNγ and CD45.1 expression within the CD4+ ESAT64–17:I-Ab tetramer-binding population. (B) Cumulative data from A showing the percentage of IFNγ-producing WT and miR-155−/− (KO) cells within their respective CD4+ ESAT64–17:I-Ab tetramer-binding populations. *P < 0.01. (C) Representative flow cytometric analysis showing direct ex vivo intracellular IFNγ and CD45.1 expression within the CD8+ TB10.44–11:Kb tetramer-binding population. (D) Cumulative data from C showing the percentage of IFNγ-producing WT and miR-155−/− (KO) cells within their respective CD8+ TB10.44–11:Kb tetramer-binding populations. *P < 0.01. (E) Representative flow cytometric analysis of WT (CD45.2) and miR-155−/− (CD45.1) CD4+ T cells recovered from lungs of mixed-bone marrow chimeric mice at day 21 after Mtb infection cultured in medium alone (Top) or restimulated in vitro with either Ag58B240–254 or ESAT64–17 peptide. (F) Cumulative data from E showing the percentages of TNF+IFNγ+ CD4+ T cells in each group after in vitro restimulation as indicated. Data shown are means of three mice, plus SEM. *P < 0.01. (G) Representative flow cytometric analysis of WT (CD45.2) and miR-155−/− (CD45.1) CD8+ T cells recovered from lungs of mixed-bone marrow chimeric mice at day 21 after Mtb infection cultured in medium alone or restimulated in vitro with TB10.44–11 peptide. (H) Cumulative data from G showing the percentages of TNF+IFNγ+ CD8+ T cells in each group after in vitro restimulation as indicated. Data shown are means of three mice, plus SEM. *P < 0.01.
Regulation of the SHIP1-Akt Signaling Cascade by MiR-155 in CD4+ T Cells During Mtb Infection.
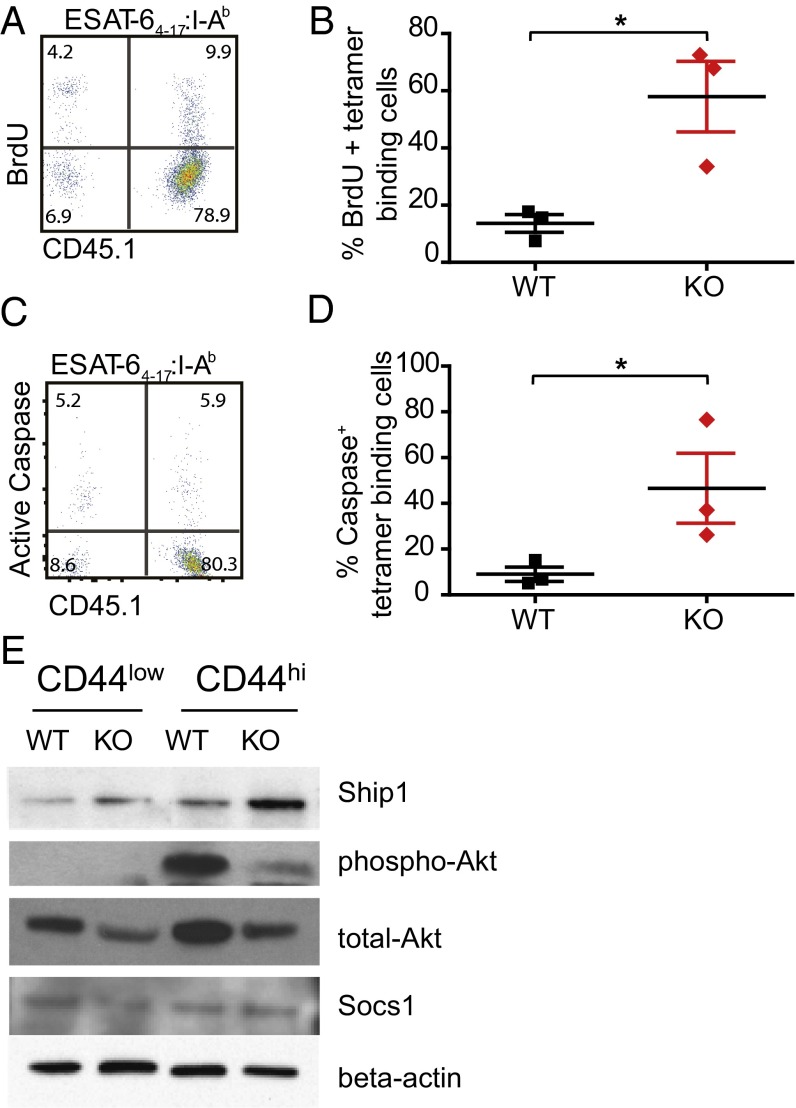
The competitive disadvantage of T cells lacking miR-155 could be explained by either reduced proliferation or impaired survival. To address these possibilities, we pulsed WT:miR-155−/− mixed chimeric mice with 5-bromo-2'-deoxyuridine (BrdU) to compare the proliferation of WT and miR-155−/− T cells during Mtb infection. Surprisingly, despite being recovered at significantly lower numbers, ESAT-64–17–specific CD4+ T cells lacking miR-155 had threefold higher levels of BrdU incorporation than WT cells, ruling out a defect in proliferation (Fig. 6 A and B).
Fig. 6.
miR-155 promotes survival of ESAT64–17:I-Ab–specific CD4+ cells through SHIP1 signaling. (A) Representative flow cytometric analysis showing direct ex vivo BrdU incorporation and CD45.1 expression within the CD4+ ESAT64–17:I-Ab tetramer-binding population. (B) Cumulative data from A showing percentage of BrdU+ WT and miR-155−/− CD4+ T cells within their respective CD4+ ESAT64–17:I-Ab tetramer-binding populations. *P < 0.01. (C) Representative flow cytometric analysis showing direct ex vivo pan-caspase activation and CD45.1 expression within the CD4+ ESAT64–17:I-Ab tetramer-binding population. (D) Cumulative data showing percentage of active caspase-positive WT and miR-155−/− CD4+ T cells within their respective CD4+ ESAT64–17:I-Ab tetramer-binding populations. *P < 0.01. (E) Immunoblotting of SHIP1, phospho/total-Akt, and SOCS1 in WT or miR-155−/− CD44low and CD44hi CD4+ cells isolated from the lungs of WT and miR-155−/− mice infected with Mtb. All cell populations were sorted from the lungs of Mtb-infected mice at day 21 postinfection.
Given our previous finding that miR-155−/− macrophages exhibited increased caspase-mediated apoptosis, we next compared WT and miR-155−/− T cells from chimeric mice for pan-caspase activity. MiR-155−/− Mtb-specific CD4+ T cells expressed higher levels of caspase activity relative to WT Mtb-specific T cells isolated from the lungs of the same mice (Fig. 6 C and D). This result suggests that Mtb-specific miR-155−/− CD4+ T cells have an increased propensity for apoptosis compared with WT cells. In light of our prior data implicating defective SHIP1/Akt signaling in driving increased apoptosis of miR-155−/− Mtb-infected macrophages, we hypothesized that alterations in this same pathway could help explain the increased apoptosis in miR-155−/− T cells. To test this, antigen-experienced (CD44hi) WT and miR-155−/− CD4+ T cells were sorted from the lungs of mixed chimeric mice and examined for protein expression by Western blotting. CD44hi miR-155−/− CD4+ T cells displayed enhanced SHIP1 levels relative to CD44hi WT cells from the same lung and a corresponding decrease in Akt phosphorylation (Fig. 6E). In addition to the SHIP1/Akt signaling pathway, the inhibitory protein SOCS1 is also a validated target of miR-155 and was shown to be regulated by miR-155 in regulatory T cells (22). However, we found no difference in SOCS1 levels in activated CD4+ cells sorted from the lungs of mixed-bone marrow chimeric mice infected with Mtb (Fig. 6E). These data demonstrate that during Mtb infection miR-155 modulates the SHIP1/Akt signaling axis in CD4+ T cells, in the same manner as it does in macrophages. Overall, these results suggest a critical T-cell–intrinsic role for miR-155 in regulating the expansion, maintenance, and function of antigen-specific T cells during TB.
The Susceptibility of miR-155−/− Mice to Mtb Infection Is T-Cell Intrinsic.
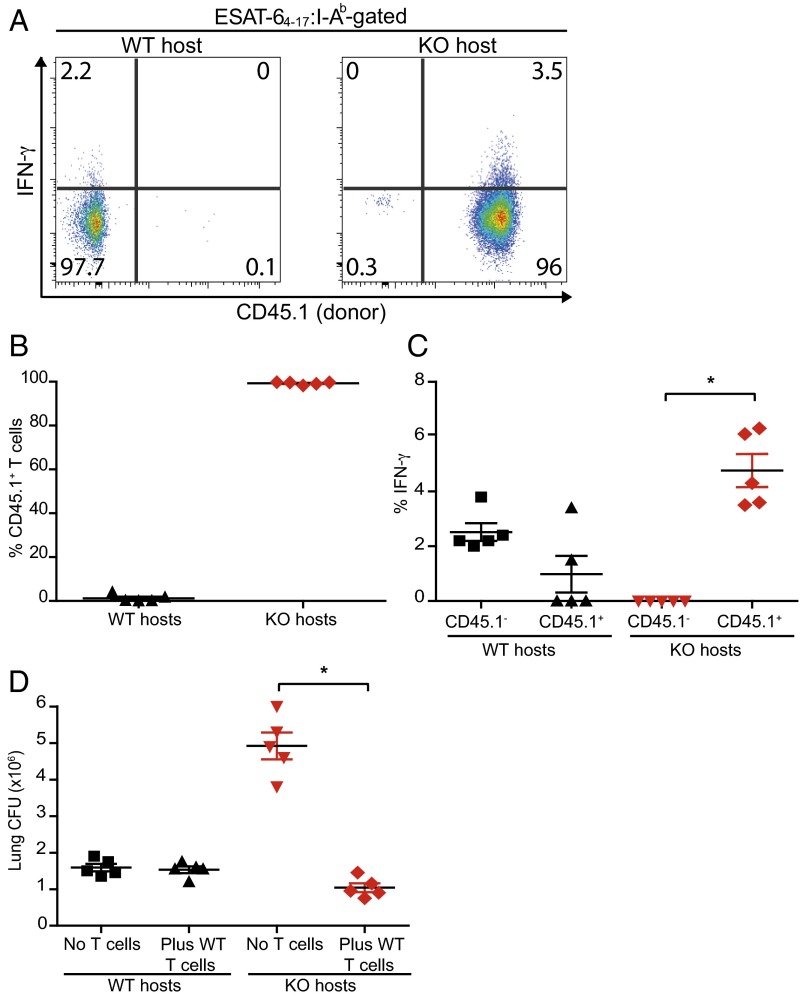
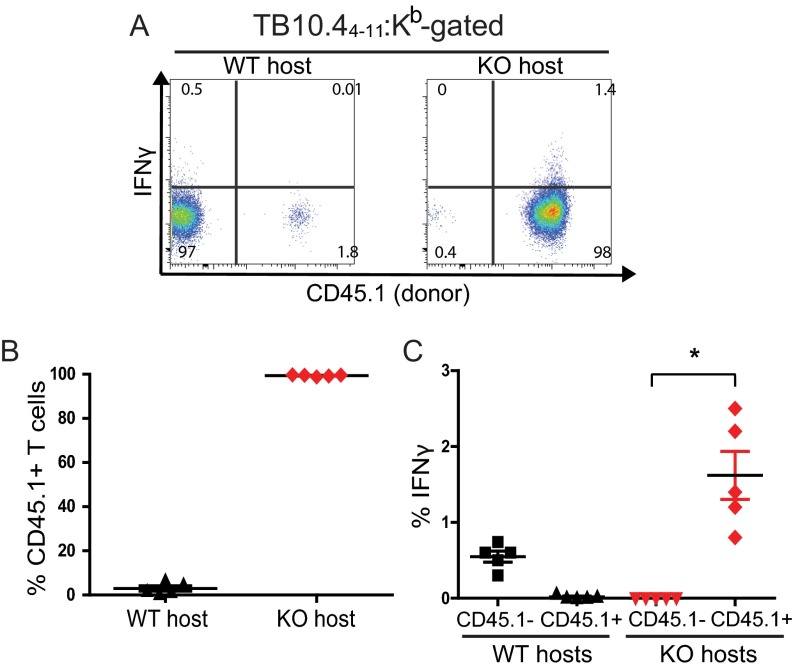
We hypothesized that the defects in miR-155−/− T-cell function and survival explain why miR155−/− mice are more susceptible to TB despite exhibiting enhanced innate Mtb control. To directly test this idea, CD45.1 congenically marked WT T cells were transferred into Mtb-infected WT or miR-155−/− mice. Consistent with our previous finding that WT T cells expand robustly when transferred into miR-155−/− mice (Fig. 3H), we found that 98–99% of the ESAT-64–17 (CD4+) and TB10.44–11 (CD8+)–specific T-cell response in miR-155−/− hosts was comprised of donor WT cells (Fig. 7 A and B and Fig. S7 A and B). Furthermore, the transferred WT T cells in the miR-155−/− mice were the major IFNγ producers (Fig. 7 A and C and Fig. S7 A and C). By comparison, the transferred T cells comprised only 0.1–2% of ESAT-64–17– and TB10.44–11–specific CD4+ and CD8+ T cells in WT controls. Strikingly, transfer of WT T cells into miR-155−/− hosts completely reversed the susceptibility of these mice, as measured by lung bacterial burdens (Fig. 7D). Thus, despite enhanced innate immunity, miR-155−/− mice are overall more susceptible to Mtb infection because miR-155−/− mice lack protective Mtb-specific T cells.
Fig. 7.
Increased susceptibility of miR-155−/− mice to Mtb infection is reversed by transfer of WT T cells. CD3+ T cells from uninfected WT (CD45.1) mice were transferred into WT (CD45.2) or miR-155−/− (KO; CD45.2) hosts at day 1 and infected on day 0. Subsequent transfers of WT T cells were performed on days 10, 20, and 30 post-Mtb infection. Mice were analyzed 50 d postinfection. (A) Representative flow cytometric analysis showing direct ex vivo intracellular IFNγ and CD45.1 expression within the CD4+ ESAT64–17:I-Ab tetramer-binding populations recovered from lungs of WT (Left) or miR-155−/− hosts (Right). (B) Cumulative data showing the percentage of transferred CD45.1 T cells within the CD4+ ESAT-64–17:I-Ab tetramer-binding populations in either WT or KO hosts. (C) Cumulative data showing the percentage of endogenous (CD45.1−) or transferred (CD45.1+) ESAT-64–17:I-Ab tetramer-binding CD4+ T cells producing IFNγ directly ex vivo in both WT and KO hosts; *P < 0.01. (D) Mtb burden (cfu) in the lungs, at 50 d postinfection, of WT and miR-155−/− mice that either received no transfer or WT T cells. Symbols represent individual mice; *P < 0.01. Error bars denote SEM.
Fig. S7.
Expansion of WT Mtb-specific CD8+ T cells in miR-155−/− hosts. (A) Representative flow cytometric analysis showing direct ex vivo intracellular IFNγ and CD45.1 expression within the WT CD8+ TB10.44–11:Kb tetramer-binding T-cell populations recovered from the lungs of WT (Left) or miR-155−/− hosts (Right). (B) Cumulative data showing the percentage of transferred CD45.1+ T cells within the CD8+ TB10.44–11:Kb tetramer-binding populations isolated from the lungs of either WT or KO mice at day 50 postinfection. (C) Cumulative data showing the percentage of endogenous (CD45.1–) or transferred (CD45.1+) TB10.44–11:Kb tetramer-binding CD8+ T cells producing IFNγ directly ex vivo, measured in both WT and KO hosts on day 50 postinfection. Bar represents the mean ± SEM. *P < 0.01.
Antigen-specific T cells are thought to control Mtb infection by secreting IFNγ and TNFα, which in turn activate macrophages to kill the bacterium. Our data demonstrate that miR-155 promotes the survival of both macrophages and T cells by regulating the SHIP1/Akt-signaling axis. This prosurvival signal leads to opposing consequences for the host at the innate and adaptive stages of infection. Early during infection, the presence of miR-155 maintains the survival of Mtb-infected macrophages, allowing the bacteria to proliferate, whereas later during infection miR-155 facilitates the long-term maintenance and effector functions of Mtb-specific T cells, leading to ultimate control of Mtb.
Discussion
MiRNAs are important regulators of the immune system (23), although little is known about the contributions of miRNAs during the natural course of Mtb infection. Previous studies examining the role of miR-155 in regulating macrophage responses to mycobacteria in vitro have generated widely varying results. This discordance is likely due to the use of macrophage-like cell lines instead of primary macrophages, avirulent bacillus Calmette–Guérin instead of virulent Mtb, and widely differing in vitro experimental conditions (24–28). A recent study demonstrated that miR-155−/− mice are more susceptible to Mtb infection during the late chronic stage of infection (18); however, the mechanism underlying this effect was not explored. Our study dissects the role of miR-155 during the innate and adaptive immune response both in vitro and in vivo.
Using a systems-level integrative approach, we constructed a miRNA regulatory network in Mtb-infected macrophages that predicted a central role for miR-155. This was first validated in vitro by showing that miR-155−/− macrophages controlled Mtb growth better than WT macrophages. The miR-155−/− macrophages expressed more SHIP1 and less phospho-Akt and exhibited increased apoptosis. Treatment with a SHIP1 inhibitor led to reduced apoptosis, establishing a causal link between SHIP1 signaling and Mtb-infected macrophage survival. This finding is supported by the observation that transfection of miR-155 into THP-1 cells decreased bacillus Calmette–Guérin-induced apoptosis (28). These findings were then confirmed in vivo; after low-dose aerosol infection, miR-155−/− mice exhibited enhanced control of Mtb, during the innate stage of infection when macrophage function is critical.
Despite exhibiting early resistance to infection, miR-155−/− mice were paradoxically compromised in their ability to control Mtb during the chronic stage of infection, after the onset of adaptive immunity. Because T-cell immunity is critical for an effective adaptive immune response during Mtb infection (29), we assessed the function of miR-155−/− T cells during infection. Mixed-bone marrow chimeras allowed us to directly compare WT and miR-155−/− T cells in the same pulmonary environment in vivo. Our observations revealed an important cell-intrinsic role for miR-155 in the maintenance and function of antigen-specific T cells during Mtb infection. An increased rate of cell death, rather than a decreased rate of proliferation, explained the inability of Mtb-specific miR-155−/− T cells to persist during infection. During Mtb infection, in T cells, as in macrophages, miR-155 was shown to modulate the SHIP1/Akt pathway, a downstream component of TCR-mediated signaling (30). Transfer of WT T cells into miR-155−/− hosts rescued their susceptibility to Mtb, demonstrating that the inability of miR-155−/− mice to control Mtb during chronic infection is due to a defective T-cell response.
Our work highlights the merits of developing a pathogen-specific miRNAome to identify candidates with critical roles in immune regulation and validating these candidate miRNAs using an animal model that allows tracking of pathogen-specific responses during the natural course of infection. This approach revealed discordant roles for miR-155 during early and chronic stages of Mtb infection, reflecting the position of miR-155 as a pleiotropic regulator of immunity.
Our data suggest a model in which miR-155 regulates macrophage survival and T-cell expansion through SHIP1. Thus, a similar SHIP1-dependent regulation of cell survival in macrophages and T cells leads to diametrically opposed effects in bacterial control. Macrophage survival provides a protective niche for Mtb during the early phase of infection, whereas T-cell expansion leads to a robust protective response. This dual role for miR-155 in controlling Mtb suggests that global perturbation of miR-155 during TB may not be beneficial and may even induce harm. However, targeted delivery of antagomirs to the myeloid compartment in the lung, and specific reduction of miR-155 in macrophages, may have therapeutic potential.
Materials and Methods
Mice.
C57BL/6, B6.SJL-Ptprca/Boy (CD45.1), B6.129P2-Tcrbtm1Mom Tcrdtm1Mom/J, and B6.Cg-MiR-155tm1.1Rsky/J mice were purchased from the Jackson Laboratory. P25 TCR Tg mice have been described previously (20). All mice were housed and bred under specific pathogen–free conditions at the Institute for Systems Biology and the Center for Infectious Disease Research. All experimental protocols involving animals were approved by the Institutional Animal Care and Use Committee of Seattle Biomed.
Tissue Culture.
BMMs were cultured in complete RPMI [cRPMI; plus 10% (vol/vol) FBS, 2 mM l-glutamine, penicillin, and streptomycin] with recombinant human CSF-1 (50 ng/mL) for 6 d. On day 7, BMMs were infected with Mtb H37Rv strain (MOI 5), followed by washing 2× with PBS. The bacterial load within cells was determined by plating serial dilutions from cell lysates homogenized in 1% Triton-X in PBS. Total RNA was isolated from cells using TRIzol (Invitrogen). SHIP1 inhibitor 3AC (Millipore) was used at 6.25 μM in EtOH, added 2 h before infection, and left in for the duration of the infection. Macrophage viability was assessed by flow cytometry using an Annexin V antibody and Zombie Violet viability dye (Biolegend).
Retroviral Transduction of MiR-155.
Genomic sequences encoding pri–miR-155 were cloned corresponding to genetic coordinates Chr16: 84714009 and Chr16: 84714331. The product was cloned into a murine stem cell virus (MSCV)-PIG vector (31), and a control construct in the same backbone was generated encoding a pri–miR-30 formatted shRNA against Tlr5, a gene not expressed by mouse BMM. Retroviral constructs were packaged using the Phoenix ecotropic 293 line. Macrophages were transduced and cells selected in puromycin for 7–10 d before analysis.
Gene Expression Microarrays from Mtb-Infected Macrophages.
To construct a BMM Mtb infection, network samples were collected at 0, 4, 8, 24, and 48 h post-Mtb infection in biological triplicate. Validation studies collected samples from WT and miR-155−/− BMMs at 8 h post-Mtb infection in biological triplicate. Sample integrity was checked using an Agilent 2100 Bioanalyzer. Samples were hybridized to Affymetrix Mouse Exon ST 1.0 microarrays. Briefly, biotinylated cDNA was generated from 2 μg total RNA and hybridized onto microarrays for 16 h at 45 °C. The microarrays were washed and stained with streptavidin–phycoerythrin (PE) using an Affymetrix FS-450 fluidics station. Data were collected with the Affymetrix GeneChip Scanner 3000. Microarrays were normalized at the gene level using the BrainArray custom CDF (Entrez Gene, Version 14) for probeset definitions and RMA as implemented in the “justRMA” function of the Bioconductor package affy for background adjustment, quantile normalization, and summarization. All microarray data can be accessed in Minimum Information About a Microarray Experiment (MIAME) compliant format from National Center for Biotechnology Information (NCBI) Gene Expression Omnibus database (accession no. GSE79733).
Mtb-Infected Macrophage Gene Regulatory Network Construction.
The 3,473 genes significantly differentially expressed (Benjamini–Hochberg corrected Student’s t test P value ≤ 0.05 and fold-change ≥ 2) between 0 h and each time point (4, 8, 24, and 48 h) were used for gene regulatory network construction (Table S1). The gene regulatory network was constructed using the cMonkey biclustering algorithm (7, 32) that trained biclusters that correlate with miRNA-mediated regulation using the FIRM (6). Clustering of biclusters was accomplished by using hierarchical clustering of the eigengenes (33) and using the elbow method to choose the optimal number of clusters (34). Enrichment of GO biological process terms in each mRNA coexpression signature was assessed using the topGO package in R (35) by computing a hypergeometric P value with the Benjamini–Hochberg correction [false discovery rate (FDR) ≤ 0.05]. Semantic similarity between a significantly enriched GO term and each hallmark of infection was assessed by using the Jiang and Conrath similarity measure as implemented in the R package GOSim (6, 36). For each temporal signature, the similarity scores between its enriched GO terms and the GO terms for each hallmark of infection were computed, and the maximum for each hallmark was returned. Similarity scores greater than or equal to 0.9 were considered sufficient for inferring a link between the enriched GO terms for a temporal signature and a hallmark of infection. Significant miRNA-mediated repression was determined by correlating temporal gene expression signature first principal component with miRNA expression using a Pearson’s correlation. Significant loss of repression by miR-155 was calculated by taking the median of the difference between 0 h and 8 h post-Mtb infection for the specified genes and comparing the repression between miR-155−/− and the WT control using an unpaired two-sided Student’s t test.
Aerosol Infections and Bacterial Cfus.
A frozen stock of Mtb H37Rv was diluted and used to infect mice in an aerosol infection chamber (Glas-Col), as described before (37). Bacterial load in the lungs was determined by plating serial dilutions from homogenized lungs at different time points (37).
Cell Proliferation Assays.
Congenically labeled CD4+ T cells from pooled spleens and lymph nodes were negatively enriched to >95% purity using magnetic beads (Miltenyi Biotec). The cells were CFSE-labeled (Molecular Probes) and adoptively transferred (1 × 10⁵) by tail vein injections. Transferred cells were recovered 5 d later by enriching the cells from either spleen or lymph node as described before (38), stained for surface markers, and analyzed by flow cytometry.
Cell Isolation, Analysis, and Sorting.
Single-cell suspensions of intraparenchymal lung lymphocytes were prepared by Liberase Blendzyme 3 (Roche) digestion of perfused lungs as previously described (37). Cells from spleens and LNs were prepared as previously described (39). Fc receptors were blocked with anti-CD16/32 (2.4G2). Cells were suspended in 1× PBS (pH 7.4) containing 0.1% NaN3 and 2.5% FBS (i.e., sorter buffer) and stained at saturating conditions using antibodies specific for CD3 (145-2C11), CD4 (RM4-5), CD8 (53-6.7) obtained from BD, or F4/80 (BM8), CD11b (M1/70), CD11c (N418), CD19 (eBio1D3), CD44 (1M7), Thy1.1 (HIS51), Thy1.2 (53-2.1), CD45.1 (A20), and CD45.2 (104) (eBioscience). Samples were fixed in 2% (vol/vol) paraformaldehyde and analyzed using a LSRII flow cytometer (BD) and FlowJo software (Tree Star, Inc.). In some experiments, lung cells from Mtb-infected mice were sorted for CD4+ CD44hi or CD4+ CD44 low populations on a BD Aria II cell sorter. Sorted cells were analyzed for purity and selected for Western blotting.
Detection of Mtb-Specific T Cells.
For direct detection of Mtb-specific cells, PE-labeled MHC class II tetramers (I-Ab) containing the immunodominant epitope of the ESAT-6 protein of Mtb (ESAT-64–17:I-Ab) were made (40). APC-labeled MHC class I tetramers containing the stimulatory residues of the TB10.4 protein of Mtb (TB10.44–11:Kb) were obtained from the National Institutes of Health Tetramer Core Facility. Tetramer staining on single-cell preparations was carried out as described before (37). Mtb-specific lung cells were assessed for their production of IFNγ and TNFα in response to in vitro stimulation by ESAT-64–17 or TB10.44–11 peptides for 4 h in the presence monensin (BD Bioscience). The cells were then stained with antibodies against surface markers, followed by intracellular staining for the cytokines.
Intracellular Staining.
Following surface staining, intracellular staining was performed in fixation/permeabilization buffers following the manufacturer’s instructions. Cells were stained with anti-IFNγ or anti-TNFα antibodies (eBioscience). Active-caspases (CaspGlow; BD Bioscience) were detected per the manufacturer’s instructions.
Mixed-Bone Marrow Chimeric Mice.
Bone marrow cells were harvested from femurs and tibias. T cells were depleted from bone marrow cell suspensions with an anti-CD3ε microbead kit (Miltenyi). CD45.1-expressing (B6.SJL-Ptprca/Boy) WT bone marrow cells were mixed with an equal number of CD45.2-expressing miR-155−/− (B6.Cg-MiR-155tm1.1Rsky/J) or CD45.2-expressing WT bone marrow cells. We injected 5–10 × 106 total bone marrow cells into sublethally irradiated (600 rads) CD45.2-expressing mice (B6.129P2-Tcrbtm1Mom Tcrdtm1Mom/J). At 12 wk post-bone marrow transfer, mice were bled, stained for CD45.1/CD45.2 T cells, and assessed for chimerism before infection.
Western Blotting Analyses.
Immunoblotting was performed using standard techniques. Nitrocellulose membranes were probed with relevant primary antibodies: rabbit anti-pBad/total-Bad, rabbit anti–phospho-SHIP1, rabbit anti–total-SHIP1, rabbit anti–phospho-Akt, rabbit anti–pan-Akt (Cell Signaling Technologies), mouse anti-LC3 (5F10) (Nanotools), and rabbit anti-mouse beta-actin1-HRP antibody (Jackson Immunoresearch Laboratories). Primary antibodies were detected by secondary rat anti–rabbit-HRP or donkey anti-mouse IgG peroxidase-conjugated antibody (Jackson Immunoresearch laboratories).
Immunohistochemistry.
Tissue sections were formalin-fixed and paraffin-embedded. Staining was performed with rabbit anti-cleaved caspase-3 pAb (Biocare Medical). Slides were scanned and import was performed with Hamamatsu NanoZoomer Digital Pathology System and Visiopharm. Automatic regions of interest detection was performed using the feature HDAB. Visiopharm was trained to label positive staining, and background tissue counterstain, hematoxylin, based on a threshold of pixel values. The ratio of cleaved caspase-3 staining was calculated as follows: total tissue = area of DAB-stained tissue + area of rest of tissue; CC3 Ratio = area of DAB stained tissue/total tissue.
Statistical Analysis.
Significance was determined using an unpaired two-tailed Student’s t test unless otherwise specified.
Acknowledgments
We thank Wiley Lawhead, Tim Dawe, and their staff from the Institute for Systems Biology and Seattle BioMed vivarium for animal care; and Dr. Piper Treuting and Brian Johnson, University of Washington Immunohistochemistry core, for histological services. We thank Dr. Edward Jarroll for critical reading of the manuscript. We acknowledge the NIH Tetramer Core Facility (Contract HHSN272201300006C) for provision of tetramers. Research reported in this publication was supported by the National Institute of Allergy and Infectious Diseases of the National Institutes of Health under Awards R01 AI032972, R01 AI025032, U19 AI106761, and U19 AI100627 (to A.A.) and R01 AI076327 (to K.B.U.).
Footnotes
The authors declare no conflict of interest.
This article is a PNAS Direct Submission.
Data deposition: All microarray data can be accessed in Minimum Information About a Microarray Experiment (MIAME) compliant format from the National Center for Biotechnology Information (NCBI) Gene Expression Omnibus (GEO) database, www.ncbi.nlm.nih.gov/geo/ (accession no. GSE79733).
This article contains supporting information online at www.pnas.org/lookup/suppl/doi:10.1073/pnas.1608255113/-/DCSupplemental.
References
- 1.O’Garra A, et al. The immune response in tuberculosis. Annu Rev Immunol. 2013;31:475–527. doi: 10.1146/annurev-immunol-032712-095939. [DOI] [PubMed] [Google Scholar]
- 2.Baltimore D, Boldin MP, O’Connell RM, Rao DS, Taganov KD. MicroRNAs: New regulators of immune cell development and function. Nat Immunol. 2008;9(8):839–845. doi: 10.1038/ni.f.209. [DOI] [PubMed] [Google Scholar]
- 3.Lodish HF, Zhou B, Liu G, Chen CZ. Micromanagement of the immune system by microRNAs. Nat Rev Immunol. 2008;8(2):120–130. doi: 10.1038/nri2252. [DOI] [PubMed] [Google Scholar]
- 4.O’Connell RM, Rao DS, Baltimore D. microRNA regulation of inflammatory responses. Annu Rev Immunol. 2012;30:295–312. doi: 10.1146/annurev-immunol-020711-075013. [DOI] [PubMed] [Google Scholar]
- 5.Baek D, et al. The impact of microRNAs on protein output. Nature. 2008;455(7209):64–71. doi: 10.1038/nature07242. [DOI] [PMC free article] [PubMed] [Google Scholar]
- 6.Plaisier CL, Pan M, Baliga NS. A miRNA-regulatory network explains how dysregulated miRNAs perturb oncogenic processes across diverse cancers. Genome Res. 2012;22(11):2302–2314. doi: 10.1101/gr.133991.111. [DOI] [PMC free article] [PubMed] [Google Scholar]
- 7.Reiss DJ, Plaisier CL, Wu WJ, Baliga NS. cMonkey2: Automated, systematic, integrated detection of co-regulated gene modules for any organism. Nucleic Acids Res. 2015;43(13):e87. doi: 10.1093/nar/gkv300. [DOI] [PMC free article] [PubMed] [Google Scholar]
- 8.Vigorito E, Kohlhaas S, Lu D, Leyland R. miR-155: An ancient regulator of the immune system. Immunol Rev. 2013;253(1):146–157. doi: 10.1111/imr.12057. [DOI] [PubMed] [Google Scholar]
- 9.Rodriguez A, et al. Requirement of bic/microRNA-155 for normal immune function. Science. 2007;316(5824):608–611. doi: 10.1126/science.1139253. [DOI] [PMC free article] [PubMed] [Google Scholar]
- 10.Thai TH, et al. Regulation of the germinal center response by microRNA-155. Science. 2007;316(5824):604–608. doi: 10.1126/science.1141229. [DOI] [PubMed] [Google Scholar]
- 11.Behar SM, Divangahi M, Remold HG. Evasion of innate immunity by Mycobacterium tuberculosis: Is death an exit strategy? Nat Rev Microbiol. 2010;8(9):668–674. doi: 10.1038/nrmicro2387. [DOI] [PMC free article] [PubMed] [Google Scholar]
- 12.Volkman HE, et al. Tuberculous granuloma formation is enhanced by a mycobacterium virulence determinant. PLoS Biol. 2004;2(11):e367. doi: 10.1371/journal.pbio.0020367. [DOI] [PMC free article] [PubMed] [Google Scholar]
- 13.Ramakrishnan L. Revisiting the role of the granuloma in tuberculosis. Nat Rev Immunol. 2012;12(5):352–366. doi: 10.1038/nri3211. [DOI] [PubMed] [Google Scholar]
- 14.Rauh MJ, et al. The role of SHIP1 in macrophage programming and activation. Biochem Soc Trans. 2004;32(Pt 5):785–788. doi: 10.1042/BST0320785. [DOI] [PubMed] [Google Scholar]
- 15.O’Connell RM, Chaudhuri AA, Rao DS, Baltimore D. Inositol phosphatase SHIP1 is a primary target of miR-155. Proc Natl Acad Sci USA. 2009;106(17):7113–7118. doi: 10.1073/pnas.0902636106. [DOI] [PMC free article] [PubMed] [Google Scholar]
- 16.Backers K, Blero D, Paternotte N, Zhang J, Erneux C. The termination of PI3K signalling by SHIP1 and SHIP2 inositol 5-phosphatases. Adv Enzyme Regul. 2003;43:15–28. doi: 10.1016/s0065-2571(02)00043-2. [DOI] [PubMed] [Google Scholar]
- 17.Wang J, et al. MicroRNA-155 promotes autophagy to eliminate intracellular mycobacteria by targeting Rheb. PLoS Pathog. 2013;9(10):e1003697. doi: 10.1371/journal.ppat.1003697. [DOI] [PMC free article] [PubMed] [Google Scholar]
- 18.Iwai H, et al. MicroRNA-155 knockout mice are susceptible to Mycobacterium tuberculosis infection. Tuberculosis (Edinb) 2015;95(3):246–250. doi: 10.1016/j.tube.2015.03.006. [DOI] [PubMed] [Google Scholar]
- 19.Urdahl KB, Shafiani S, Ernst JD. Initiation and regulation of T-cell responses in tuberculosis. Mucosal Immunol. 2011;4(3):288–293. doi: 10.1038/mi.2011.10. [DOI] [PMC free article] [PubMed] [Google Scholar]
- 20.Tamura T, et al. The role of antigenic peptide in CD4+ T helper phenotype development in a T cell receptor transgenic model. Int Immunol. 2004;16(12):1691–1699. doi: 10.1093/intimm/dxh170. [DOI] [PubMed] [Google Scholar]
- 21.Moon JJ, et al. Tracking epitope-specific T cells. Nat Protoc. 2009;4(4):565–581. doi: 10.1038/nprot.2009.9. [DOI] [PMC free article] [PubMed] [Google Scholar]
- 22.Lu LF, et al. Foxp3-dependent microRNA155 confers competitive fitness to regulatory T cells by targeting SOCS1 protein. Immunity. 2009;30(1):80–91. doi: 10.1016/j.immuni.2008.11.010. [DOI] [PMC free article] [PubMed] [Google Scholar]
- 23.Gracias DT, Katsikis PD. MicroRNAs: Key components of immune regulation. Adv Exp Med Biol. 2011;780:15–26. doi: 10.1007/978-1-4419-5632-3_2. [DOI] [PubMed] [Google Scholar]
- 24.Yang S, et al. Early secreted antigen ESAT-6 of Mycobacterium tuberculosis promotes apoptosis of macrophages via targeting the microRNA155-SOCS1 interaction. Cell Physiol Biochem. 2015;35(4):1276–1288. doi: 10.1159/000373950. [DOI] [PubMed] [Google Scholar]
- 25.Ghorpade DS, Leyland R, Kurowska-Stolarska M, Patil SA, Balaji KN. MicroRNA-155 is required for Mycobacterium bovis BCG-mediated apoptosis of macrophages. Mol Cell Biol. 2012;32(12):2239–2253. doi: 10.1128/MCB.06597-11. [DOI] [PMC free article] [PubMed] [Google Scholar]
- 26.Kumar R, et al. Identification of a novel role of ESAT-6-dependent miR-155 induction during infection of macrophages with Mycobacterium tuberculosis. Cell Microbiol. 2012;14(10):1620–1631. doi: 10.1111/j.1462-5822.2012.01827.x. [DOI] [PubMed] [Google Scholar]
- 27.Wang J, et al. MicroRNA-155 induction by Mycobacterium bovis BCG enhances ROS production through targeting SHIP1. Mol Immunol. 2014;62(1):29–36. doi: 10.1016/j.molimm.2014.05.012. [DOI] [PubMed] [Google Scholar]
- 28.Huang J, et al. MiR-155 is upregulated in patients with active tuberculosis and inhibits apoptosis of monocytes by targeting FOXO3. Mol Med Rep. 2015;12(5):7102–7108. doi: 10.3892/mmr.2015.4250. [DOI] [PubMed] [Google Scholar]
- 29.Urdahl KB. Understanding and overcoming the barriers to T cell-mediated immunity against tuberculosis. Semin Immunol. 2014;26(6):578–587. doi: 10.1016/j.smim.2014.10.003. [DOI] [PMC free article] [PubMed] [Google Scholar]
- 30.Gloire G, Erneux C, Piette J. The role of SHIP1 in T-lymphocyte life and death. Biochem Soc Trans. 2007;35(Pt 2):277–280. doi: 10.1042/BST0350277. [DOI] [PubMed] [Google Scholar]
- 31.Dickins RA, et al. Probing tumor phenotypes using stable and regulated synthetic microRNA precursors. Nat Genet. 2005;37(11):1289–1295. doi: 10.1038/ng1651. [DOI] [PubMed] [Google Scholar]
- 32.Reiss DJ, Baliga NS, Bonneau R. Integrated biclustering of heterogeneous genome-wide datasets for the inference of global regulatory networks. BMC Bioinformatics. 2006;7:280. doi: 10.1186/1471-2105-7-280. [DOI] [PMC free article] [PubMed] [Google Scholar]
- 33.Langfelder P, Horvath S. WGCNA: An R package for weighted correlation network analysis. BMC Bioinformatics. 2008;9:559. doi: 10.1186/1471-2105-9-559. [DOI] [PMC free article] [PubMed] [Google Scholar]
- 34.Zhao X, Valen E, Parker BJ, Sandelin A. Systematic clustering of transcription start site landscapes. PLoS One. 2011;6(8):e23409. doi: 10.1371/journal.pone.0023409. [DOI] [PMC free article] [PubMed] [Google Scholar]
- 35.Alexa A, Rahnenführer J, Lengauer T. Improved scoring of functional groups from gene expression data by decorrelating GO graph structure. Bioinformatics. 2006;22(13):1600–1607. doi: 10.1093/bioinformatics/btl140. [DOI] [PubMed] [Google Scholar]
- 36.Fröhlich H, Speer N, Poustka A, Beissbarth T. GOSim--An R-package for computation of information theoretic GO similarities between terms and gene products. BMC Bioinformatics. 2007;8:166. doi: 10.1186/1471-2105-8-166. [DOI] [PMC free article] [PubMed] [Google Scholar]
- 37.Shafiani S, Tucker-Heard G, Kariyone A, Takatsu K, Urdahl KB. Pathogen-specific regulatory T cells delay the arrival of effector T cells in the lung during early tuberculosis. J Exp Med. 2010;207(7):1409–1420. doi: 10.1084/jem.20091885. [DOI] [PMC free article] [PubMed] [Google Scholar]
- 38.Hataye J, Moon JJ, Khoruts A, Reilly C, Jenkins MK. Naive and memory CD4+ T cell survival controlled by clonal abundance. Science. 2006;312(5770):114–116. doi: 10.1126/science.1124228. [DOI] [PubMed] [Google Scholar]
- 39.Urdahl KB, Liggitt D, Bevan MJ. CD8+ T cells accumulate in the lungs of Mycobacterium tuberculosis-infected Kb-/-Db-/- mice, but provide minimal protection. J Immunol. 2003;170(4):1987–1994. doi: 10.4049/jimmunol.170.4.1987. [DOI] [PubMed] [Google Scholar]
- 40.Moon JJ, et al. Naive CD4(+) T cell frequency varies for different epitopes and predicts repertoire diversity and response magnitude. Immunity. 2007;27(2):203–213. doi: 10.1016/j.immuni.2007.07.007. [DOI] [PMC free article] [PubMed] [Google Scholar]


