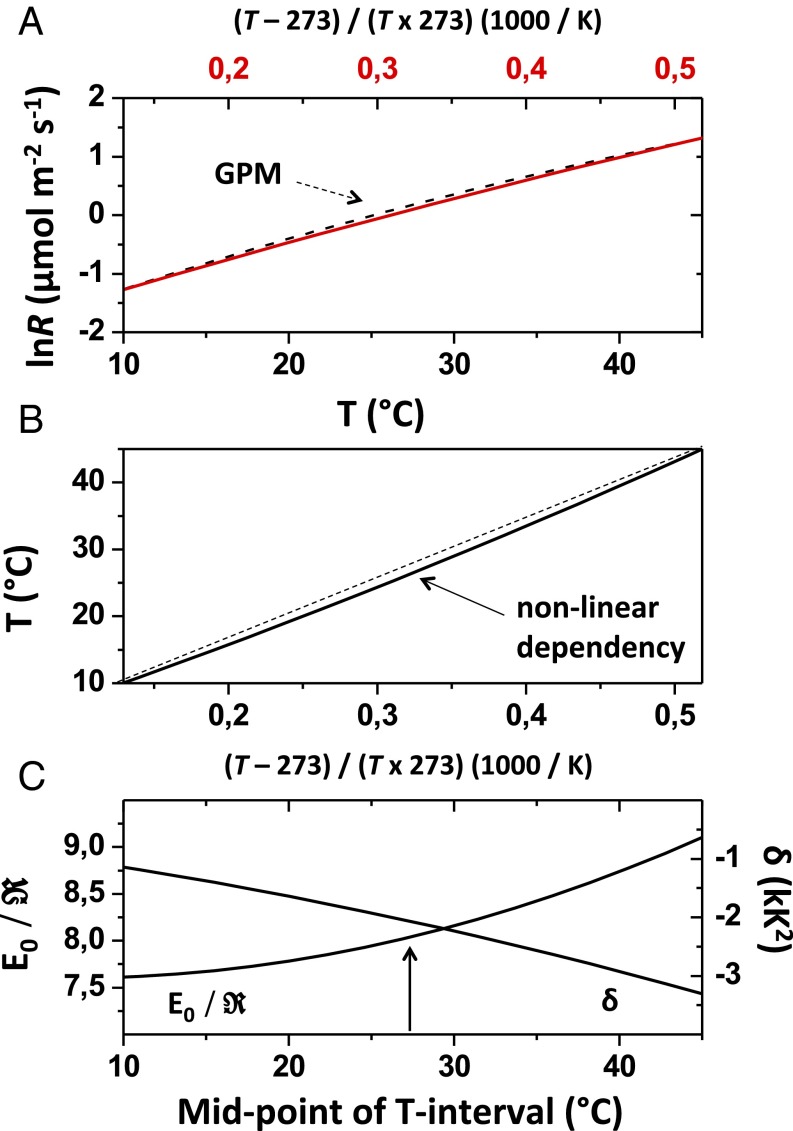
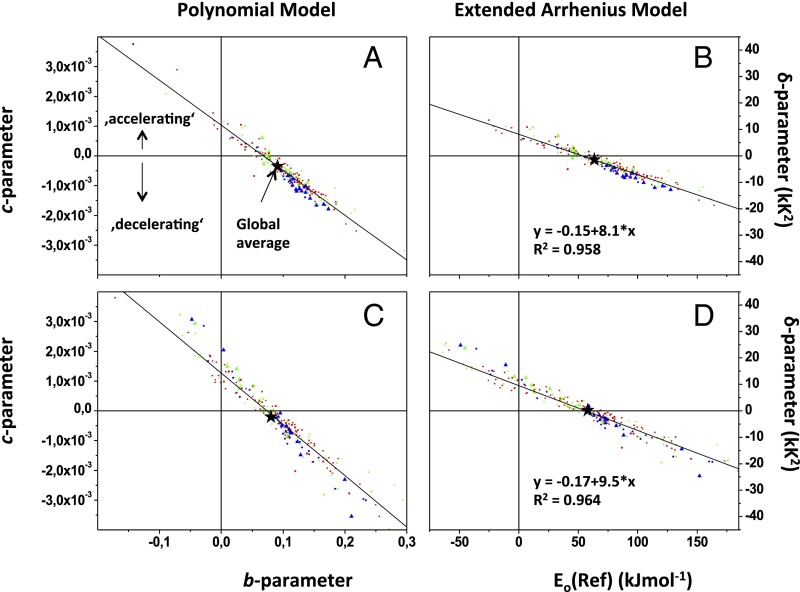
In their recent paper, Heskel et al. (1) claim for leaf respiration that “Neither current physiological nor terrestrial biosphere models adequately describe its short-term temperature response…” and present an empirical, polynomial model of leaf respiration suitable for all biomes and plant functional types. Our polynomial model (2), an extension of the Arrhenius function, provides the same predictive power as described by Heskel et al. (1). In fact, different approaches and methodologies have yielded models of the same form, and generate close to identical results (Figs. 1 and 2).
Fig. 1.
Equivalence between polynomial and extended Arrhenius models. (A) Extended Arrhenius model, where Eo is the activation energy and is the ideal gas constant [ red line] can be fitted with R2 > 0.99 to the global polynomial model (; black dotted line; T range of 10–45 °C). The fitted value of lnRref differs by less than 2% from a = −2.23, so that Eo(Ref) and the δ-parameter can be predicted with similar precision from b- and c-parameters. GPM, global polynomial R–T model. (B) Nonlinear dependency between T (°C) and reciprocal temperature (1,000/K): . (C) For accurate prediction (±2%) of Eo(Ref) and the δ-parameter from b- and c-parameters, the temperature dependency between T (°C) and x must be accounted for (sensu B). For any given b- and c-parameters, Arrhenius-type parameters can thus be predicted from the midpoint of the T interval under consideration (i.e., 27.5 °C for the global temperature range).
Fig. 2.
Correlation between parameters for the polynomial model (1) and an extended Arrhenius model (2). All points are based on the data provided by Heskel et al. (1). (A) Global polynomial model (T range of 10–45 °C). (B) Extended Arrhenius model, where Eo(Ref) and δ-values were derived from the b- and c-values shown in A. (C) The b- and c-values of the polynomial model derived from measurements within an ecologically relevant T range. (D) Arrhenius-type parameters derived from b- and c-values shown in C. Black stars represent global averages. Tundra and boreal species (blue), temperate deciduous and temperate rainforest and temperate woodland species (green), and highland and lowland tropical rainforest species (red) are also indicated. Each correlation analysis was completed with n = 231 different species [Heskel et al. (1)]. Differences in slope of the correlation between exponent variables of the polynomial model versus the extended Arrhenius model result from nonlinear dependency between T (°C) and 1,000/K (Fig. 1B).
The two models have very different origins. Heskel et al. (1) used well-established gas exchange methods and equipment to measure leaf respiration of a wide range of species and life forms, using almost identical protocols at many sites across the globe. Their dataset is a significant development. Our approach has been based on calorimetry and was summarized in a Tansley review in 2011 (2). Recently, Noguchi et al. (3) provided an independent test of whether the polynomial model developed using calorimetric techniques could be confirmed using gas exchange techniques [as used by Heskel et al. (1)]. In addition to providing a clear positive answer to this question, they highlighted that activation energies (Eo) for the entire respiratory pathway could vary little between growth temperatures. In our studies (2, 4) and the study of Noguchi et al. (3), dynamic change of Eo is hard to explain. However, the strong correlation between Eo (at 0 °C reference temperature) and δ (Fig. 2), and between the b- and c-parameters of the model of Heskel et al. (1) (Fig. 2), suggests a common mechanistic basis of respiratory regulation for all plant species. Likewise, prompt change in respiratory capacity with growth temperature (3, 4), which is proportional to change in the logarithm of respiration rate at a low reference temperature in our model (2) or the a-parameter in the model of Heskel et al. (1) (Fig. 1), is seemingly an explanation of plant adaptation (1, 4), albeit we lack a full physiological/anatomical explanation.
Congruence of papers by Heskel et al. (1), Noguchi et al. (3) and Kruse et al. (2, 4) is support for how science moves forward. Congruence, not just of data from across the globe but of knowledge derived using different methods and techniques, remains a central test of the substance of any new idea. It is not sufficient that the same method used repeatedly by the same group of researchers with different study subjects yields the same result.
As noted by Heskel et al. (1), empirical models are useful additions to the armory of those individuals charged with the responsibility of predicting global carbon budgets. Researchers and modelers now have a choice. They may use a fully abstract polynomial function to describe respiration (1), and set aside concepts such as the activation energy of enzyme reactions, or they may use a polynomial function derived from classic Arrhenius kinetics (2).
More mechanistic, and preferably process-based, models (e.g., ref. 5) are still needed to synthesize the complexity of respiration, and to help frame questions about its regulation.
Footnotes
The authors declare no conflict of interest.
References
- 1.Heskel MA, et al. Convergence in the temperature response of leaf respiration across biomes and plant functional types. Proc Natl Acad Sci USA. 2016;113(14):3832–3837. doi: 10.1073/pnas.1520282113. [DOI] [PMC free article] [PubMed] [Google Scholar]
- 2.Kruse J, Rennenberg H, Adams MA. Steps towards a mechanistic understanding of respiratory temperature responses. New Phytol. 2011;189(3):659–677. doi: 10.1111/j.1469-8137.2010.03576.x. [DOI] [PubMed] [Google Scholar]
- 3.Noguchi K, Yamori W, Hikosaka K, Terashima I. Homeostasis of the temperature sensitivity of respiration over a range of growth temperatures indicated by a modified Arrhenius model. New Phytol. 2015;207(1):34–42. doi: 10.1111/nph.13339. [DOI] [PubMed] [Google Scholar]
- 4.Kruse J, Turnbull TL, Adams MA. Disentangling respiratory acclimation and adaptation to growth temperature by Eucalyptus. New Phytol. 2012;195(1):149–163. doi: 10.1111/j.1469-8137.2012.04155.x. [DOI] [PubMed] [Google Scholar]
- 5.Buckley TN, Adams MA. An analytical model of non-photorespiratory CO2release in the light and dark in leaves of C3species based on stoichiometric flux balance. Plant Cell Environ. 2011;34(1):89–112. doi: 10.1111/j.1365-3040.2010.02228.x. [DOI] [PubMed] [Google Scholar]


