Significance
The lateral intraparietal cortex (LIP) in primates links circuits for vision and saccadic eye movements. Neurons in LIP discharge during visually evoked saccades, but it is not certain whether LIP activity is primarily related to vision or to eye movement. From neuroanatomical evidence, we propose that LIP has two distinct subdivisions, dorsal and ventral LIP, with the dorsal division more concerned with visual processing and the ventral division more concerned with saccades. We provide evidence from both electrophysiological recordings and local inactivation to support our hypothesis. We therefore demonstrate that the two subdivisions of LIP play distinct roles in linking vision with visually guided action.
Keywords: gap saccade task, electrophysiology, microinjection, inactivation, visuomotor control
Abstract
Although the cerebral cortex is thought to be composed of functionally distinct areas, the actual parcellation of area and assignment of function are still highly controversial. An example is the much-studied lateral intraparietal cortex (LIP). Despite the general agreement that LIP plays an important role in visual-oculomotor transformation, it remains unclear whether the area is primary sensory- or motor-related (the attention-intention debate). Although LIP has been considered as a functionally unitary area, its dorsal (LIPd) and ventral (LIPv) parts differ in local morphology and long-distance connectivity. In particular, LIPv has much stronger connections with two oculomotor centers, the frontal eye field and the deep layers of the superior colliculus, than does LIPd. Such anatomical distinctions imply that compared with LIPd, LIPv might be more involved in oculomotor processing. We tested this hypothesis physiologically with a memory saccade task and a gap saccade task. We found that LIP neurons with persistent memory activities in memory saccade are primarily provoked either by visual stimulation (vision-related) or by both visual and saccadic events (vision-saccade–related) in gap saccade. The distribution changes from predominantly vision-related to predominantly vision-saccade–related as the recording depth increases along the dorsal-ventral dimension. Consistently, the simultaneously recorded local field potential also changes from visual evoked to saccade evoked. Finally, local injection of muscimol (GABA agonist) in LIPv, but not in LIPd, dramatically decreases the proportion of express saccades. With these results, we conclude that LIPd and LIPv are more involved in visual and visual-saccadic processing, respectively.
The lateral intraparietal cortex (LIP), a subregion of the posterior parietal cortex in humans and macaques, is a node connecting the visual and saccadic circuits (1, 2). Neurons in LIP discharge during visually evoked saccadic eye movements (3, 4). In particular, many LIP neurons persistently discharge throughout the delay interval during the memory-guided saccades (5–7). Such persistent activity has been associated with visuomotor transformation (8), working memory (8, 9), visual attention (10), saccadic intention (6), and other cognitive functions (11–17). The involvement of the persistent activity in many cognitive functions has hindered our understanding of LIP’s role in processing vision- and saccade-related information. For instance, a large body of evidence has indicated that the persistent activity reflects selective spatial attention and priority map formation (4, 7, 10, 18). In contrast, a similar amount of evidence has suggested that the persistent activity represents motor plans for the impending saccades (3, 6, 19). We attempted to resolve this long-standing controversy by considering the physiology of LIP in the context of its anatomical structure.
Although LIP is usually considered as a functionally unitary area, it is actually composed of two anatomically distinct subdivisions: dorsal LIP (LIPd) and ventral LIP (LIPv) (20–24). The anatomical differences between LIPd and LIPv include morphological structure (20–22, 25) and anatomical connections (25, 26). In particular, LIPv has a much stronger connection with two saccadic centers, the frontal eye field (25, 26) and the deeper layers of superior colliculus (21). Such anatomical distinctions imply that LIPd and LIPv might play different roles in processing visual and oculomotor information. Supportively, single-neuron recordings from the nonhuman primates show that LIPd and LIPv represent central and peripheral vision, respectively (23, 27). Also, it has been argued recently that LIPv seems to be involved in more complex cognitive functions (28, 29). In addition, brain imaging (24, 30–32) and local inactivation (33) studies suggest different functions of LIPd and LIPv in processing cognitive information. However, no study, to date, has directly compared the neuronal discharge between the two subdivisions in processing visuomotor signals. The objective of the present study is to assess whether the LIPd and LIPv neurons that persistently discharge during memory-guided saccades function differently in processing vision- and saccade-related information.
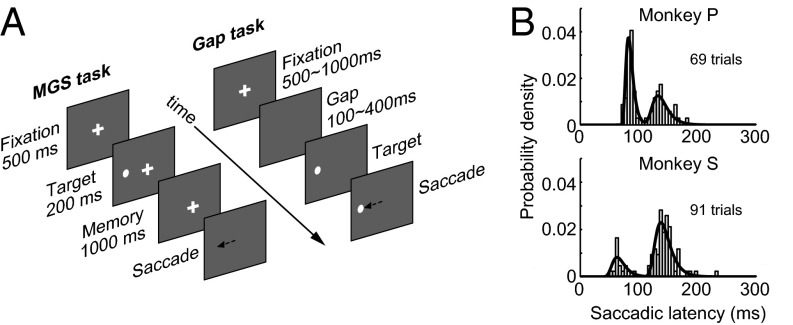
We simultaneously recorded the activity of single neurons and the local field potentials (LFPs) from two rhesus monkeys while they were performing a memory-guided saccade task and a gap saccade task (Fig. 1A). We used the memory-guided saccades to localize LIP and classify the recorded neurons as visual, saccadic, and persistent based on their spatiotemporal response characteristics (34). The gap saccade task produced a bimodal distribution of saccadic latency, (i.e., the shorter latency “express” saccades and the longer latency “regular” saccades) (35). This behavioral dichotomy was used in the present study as an experimental tool to assess the degree of visual or saccadic processing in neurons with persistent activity (discussed below). We found that the persistent neurons during the memory-guided saccades fired differently in the gap saccade task. These persistent neurons could be classified into two types: those neurons primarily activated by visual stimulation (vision-related) and those neurons activated by both visual and saccadic events (vision-saccade–related). Although these two neuron types were found throughout LIP, their distribution patterns varied along the dorsal-ventral dimension. While the vision-related neurons were primarily localized in LIPd, the vision-saccade–related neurons gradually increased in number with increasing depth and eventually became more common than the vision-related type. Consistently, we found that the LFP changed from visual evoked potential to saccadic evoked potential with increasing recording depth. Finally, we tested the functional significance of the electrophysiological data by local injection of muscimol (GABA agonist). Briefly after LIPv inactivation, but not LIPd inactivation, the proportion of express saccades in the contralateral direction dramatically decreased. Taken together, our results indicate that LIPd primarily participates in the processing of vision-related information, whereas LIPv is more involved in the processing of saccade-related information. This functional distinction between LIPd and LIPv may help resolve some apparent discrepancies between previous studies.
Fig. 1.
Behavioral tasks and distribution of saccadic latency. (A) Schematic illustration of the memory-guided saccade (MGS) and gap saccade (Gap saccade) tasks. (B) Bimodal distribution of the saccadic latency in the gap saccade task.
Results
A significant feature of the gap saccade task is that identical visual stimulation can lead to two distinct behavioral responses (i.e., shorter latency express saccades and longer latency regular saccades) (35–38). The saccadic latency of our two monkeys showed a bimodal distribution during gap saccades (Fig. 1B), consistent with previous reports (35–38). This bimodality of saccadic latency provides a useful behavioral marker to investigate whether the activity of a neuron is correlated with the onset of the visual target or with the onset of saccades; in other words, whether the neuron’s activity codes for visual, motor, or visuomotor processing. In the first case (primary visual), a neuron’s discharge is well aligned with the appearance of a visual target in both express and regular saccades, regardless of the latency difference between them. In the second case (primary saccadic), a neuron’s discharge is well aligned with saccade onset in both express and regular saccades, regardless of the time of visual target onset. In the last case (mixed visual and saccadic), a neuron’s discharge shows similar alignment with the onset of a visual target and the onset of saccades in both express and regular saccades.
Neurons with Persistent Activation During Memory-Guided Saccades Exhibited Two Different Kinds of Activation During Gap Saccades.
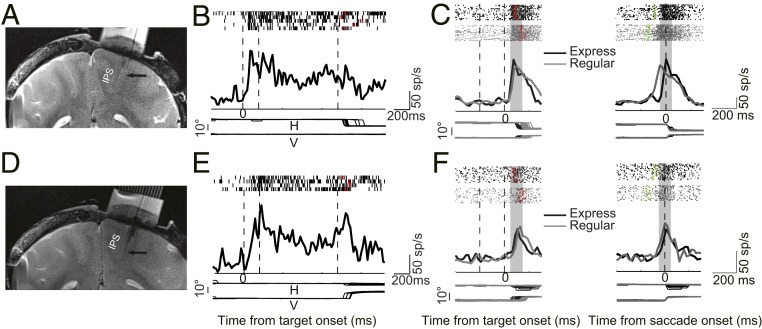
Two example neurons, recorded from LIPd (Fig. 2A, 4.07-mm depth relative to the tip of the guide tube) and LIPv (Fig. 2D, 6.87-mm depth), respectively, showed persistent activity during memory-guided saccades when the visual target appeared in, and saccade was directed to, the response field (Fig. 2 B and E). However, these two neurons were activated differently in the gap saccade task. For the LIPd neuron, the spike density histograms of express and regular saccades overlapped closely when activity was aligned at the visual target onset (Fig. 2C, Left), but not when activity was aligned at saccade onset (Fig. 2C, Right). In contrast, for the LIPv neuron, the spike density histograms were largely overlapped under both alignments (Fig. 2F).
Fig. 2.
Recording sites and response of two example neurons in the MGS and Gap saccade tasks. (A) MRI image shows the recording location of an example LIP neuron. The arrow indicates that the tip of the electrode is in LIPd. (B) This neuron showed persistent activity in the MGS task. (C) Activity of an example LIPd neuron in the Gap saccade task with alignment at the visual target onset (Left) and the saccade onset (Right). The raster represents the spike train (Top), the spike density histogram is plotted (Center), and horizontal and vertical eye positions are plotted (Bottom). Red and green dots in the raster indicate the time of saccade start and visual target onset, respectively. Gray patches denote the time interval for analysis of the CC between activity in express and regular saccades. (D) MRI image shows that the recording location of the second example neuron is in LIPv (arrow). (E and F) Activity of the second example neuron in the MGS and Gap saccade tasks with the same format as in the first example neuron. sp/s, spikes per second.
We used a correlation analysis to assess the degree of visual or saccadic processing during the gap saccade task in each persistent neuron. We first sorted trials according to whether the saccade was express or regular. For each saccade type, we aligned spike trains from repeated trials either at visual target onset or at saccade onset. Then, for each saccade type and alignment type, we determined the spike density as a function of time. Finally, for each alignment type, we calculated the correlation coefficient (CC) between the spike density functions of the two saccade types. For visual target onset alignment, we used the spike densities from 50 to 150 ms after the target onset (Fig. 2 C and F, Left, gray patch). For saccade onset alignment, we used the spike densities from 50 ms before to 50 ms after the saccade onset (Fig. 2 C and F, Right, gray patch). If a neuron’s CC was close to 1 when the trials were aligned at the target onset, but was close to 0 or negative when the trials were aligned at the saccade onset, this neuron was elicited by the appearance of a visual target (vision-related). Inversely, a neuron’s activity was elicited by the saccades (saccade-related). Finally, if a neuron’s CC was close to 0.5 in both alignments, the neuron’s activity was elicited by both visual and saccadic events (vision-saccade–related).
For the LIPd neuron, the CC was 0.839 (P = 0.002) when the activity was aligned at the target onset and the CC was −0.557 (P = 0.075) when activity was aligned at the saccade onset. For the LIPv neuron, the CC was 0.503 (P = 0.138) when the activity was aligned at the target onset and the CC was 0.620 (P = 0.042) when the activity alignment was at the saccade onset. Such results indicated that the LIPd neuron’s activity was primarily evoked by the onset of the visual target (vision-related neuron) but not by the onset of the saccade, whereas the LIPv neuron’s activity was provoked by the onset of both the visual target and saccade (vision-saccade–related).
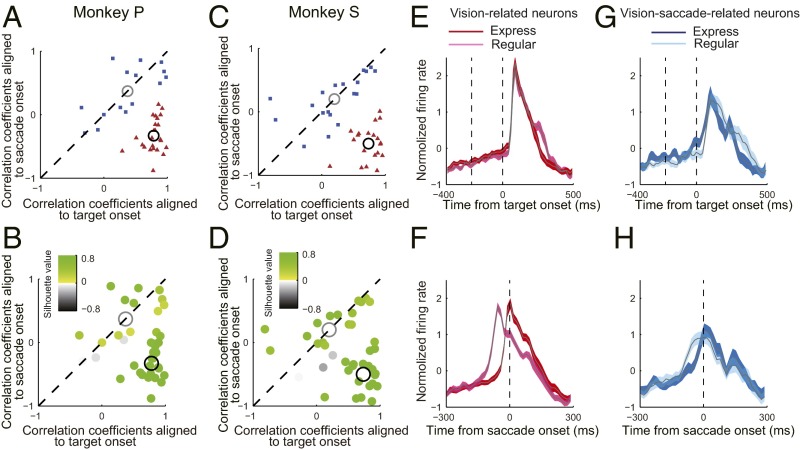
In total, we recorded complete datasets from 78 persistent neurons (39 from monkey S and 39 from monkey P) and calculated their CCs between the express and regular saccades. The direct comparison of the CCs between the two alignments of the single neurons is shown as a scatter plot in Fig. 3 A and C for each monkey. The data seem to form two separate clusters for each monkey, and this separation was further confirmed by the two-group k-means clustering analysis, which revealed one cluster in the lower right quadrant (red triangles in Fig. 3 A and C), with greater CCs under alignment of visual target onset than under alignment of saccade onset, and the second cluster along the diagonal line (blue squares in Fig. 3 A and C), with similar CCs between the two alignments. The centroids of the two clusters were located in the lower right corner (black circle in Fig. 3 A and C) and on the diagonal line (gray circle in Fig. 3 A and C), respectively. We further examined statistically how well these two clusters separated from each other by the methods of two-group k-means clustering and the silhouette values (39, 40). The computed silhouette values showed that for each monkey, only two of the 39 data points had negative silhouette values (gray dots in Fig. 3 B and D), which were not confidently classified to either cluster. Based on these analyses, we concluded that the persistent neurons could be separated into two groups in the gap saccade task: the primarily vision-related neurons (red triangles in Fig. 3 A and C) and the vision-saccade–related neurons (blue squares in Fig. 3 A and C).
Fig. 3.
Distribution of the compared CC values of single neurons and population activity of two types of neurons. (A) Comparison of CC values between two alignments (i.e., aligned at target onset versus aligned at saccade onset) of single persistent neurons from monkey P. The two group k-means clustering analysis resulted in two separate clusters: One was distributed in the right lower quadrant (red triangles), with greater CC values under alignment of visual target onset than under alignment of saccade onset, and the second was dispersed along the diagonal line (blue squares), with similar CC values between two alignments. The automatically generated two centroids of the two clusters were located in the right lower corner (black circle) and on the diagonal line (gray circle), respectively. (B) Computed silhouette values showed that for monkey P, only two of 39 data points had negative silhouette values (gray dots), which were not confidently classified to either cluster. (C and D) Data from monkey S showed similar results. The population activity of vision-related neurons under alignment to visual target onset (E) and to saccade onset (F) is shown. (G and H) Population activity of vision-saccade–related neurons with same format as in E and F.
The normalized population activity of the vision-related neurons from two monkeys (Fig. 3 E and F) was very similar to the activity of the exemplified LIPd neuron (Fig. 2C). The population activities of these neurons in express and regular saccades largely overlapped together under the alignment of visual target onset: a CC value of 0.838 (P < 0.001). However, under the alignment of saccade onset, the activity in express saccades dramatically shifted leftward (∼60 ms) compared with regular saccades: a CC value of 0.084 (P = 0.131). Alternatively, the population activity profile of the vision-saccade–related neurons (Fig. 3 G and H) was very similar to the activity of the exemplified LIPv neuron (Fig. 2F). The population activities of these neurons largely overlapped together irrespective of the alignment being at the visual target onset or saccade onset. The CC value was 0. 656 (P < 0.001) in the alignment of visual target onset and 0.639 (P < 0.001) in the alignment of saccade onset.
The Vision-Related and Vision-Saccade–Related Neurons Exhibited Different Responses During Memory-Guided Saccades.
Because the persistent response neurons could be separated into two groups based on their activity in a gap saccade task, we wondered whether these two groups of neurons also discharged differently in the memory-guided saccade task. To address this question, we compared the population activity of the two groups of neurons. We analyzed the activity of each individual neuron in the preferred direction. For each neuron, the activity was normalized with its baseline activity (0–200 ms before target onset).
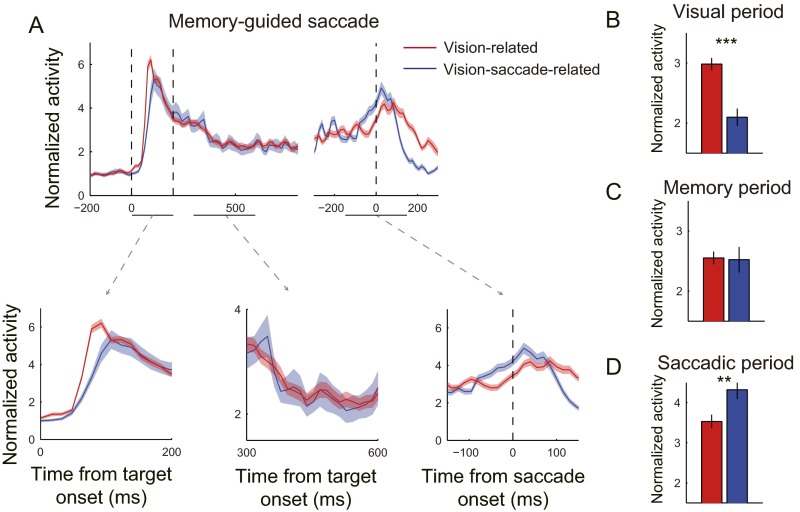
The average population activity with ±1 SEM of vision-related neurons (red) and vision-saccade–related neurons (blue) in the memory-guided saccade task was superimposed in Fig. S1A, Top. The three panels in Fig. S1A, Bottom show the activity during three periods. First, during the visual period (0–100 ms after target onset), the normalized activity of vision-related neurons rose earlier and higher than the normalized activity of vision-saccade–related neurons. The averaged normalized activity was significantly higher than the averaged normalized activity of vision-saccade–related neurons (Fig. S1B; P < 0.001, t test). Second, during the memory period (100–400 ms after target offset), the normalized activity of the two groups of neurons was similar (Fig. S1C; P = 0.886, t test). Finally, during the saccadic period (−50 to 50 ms of saccade onset), the normalized activity of vision-saccade–related neurons was significantly higher than the normalized activity of vision-related neurons (Fig. S1D; P = 0.004, t test).
Fig. S1.
Vision-related and vision-saccade–related neurons activated differently in a memory-guided saccade task. (A) Normalized population activities of vision-related neurons (red) and vision-saccade–related neurons (blue). Three dashed vertical lines depict the time of target onset (Left), target offset (Middle), and saccade onset (Right), respectively. (Lower) Normalized activities during three selected periods (visual, memory, and saccadic; indicated by the horizontal lines under the x axis) are shown. In each curve, the shading area represents +1 and −1 SEM. (B–D) Mean normalized activities of vision-related neurons (red) and vision-saccade–related neurons (blue) during the visual (0–100 ms after target onset), memory (100–400 ms after target offset), and saccadic (−50 to 50 ms from saccade onset) periods. **P = 0.004, ***P < 0.001.
The Locations of Vision-Related and Vision-Saccade–Related Neurons Were Distributed Asymmetrically in LIPd and LIPv.
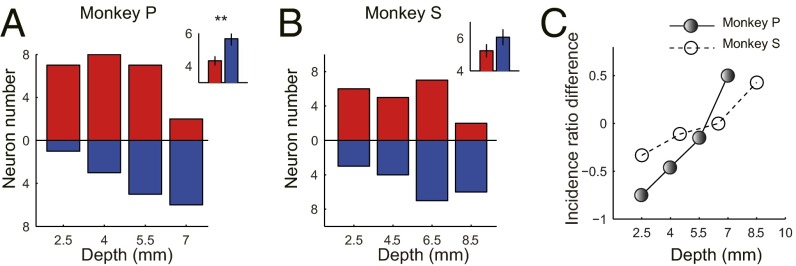
In addition to the MRI evidence of the recording sites of the two example neurons (Fig. 2A, a vision-related neuron in LIPd with a recording depth of 4.07 mm; Fig. 2D, a vision-saccade–related neuron in LIPv with a recording depth of 6.87 mm), we calculated the recording depth (measured from the tip of the guide tube) of each studied neuron. The depth distribution of the recording sites is shown as a bar plot in Fig. 4 A and B for each monkey. The x axis represents the recording depth with a bin width of 1.5 mm and 2 mm for monkey P and monkey S respectively, whereas the y axis represents the number of neurons. The range of recording depth was 2.56–7.65 mm for monkey P and 2.90–9.49 mm for monkey S. The vision-related neurons (red bars) were primarily localized in LIPd, whereas the vision-saccade–related neurons (blue bars) gradually increased in number with increasing recording depth. The incidence ratio difference between these two groups of neurons eventually changed from vision-related dominant to vision-saccade–related dominant (Fig. 4C). The distribution of the recording sites was consistent between the two monkeys. On average, the recording sites of vision-saccade–related neurons were deeper than the recording sites of vision-related neurons in both monkeys (Fig. 4 A and B, Inset, bar plot; P = 0.005 for monkey P and P = 0.177 for monkey S, t test).
Fig. 4.
Distribution of recording sites and change of the ratio between two types of neurons as a function of recording depth. (A and B) Distribution of vision-related neurons (red) and vision-saccade–related neurons (blue) is shown in bar plots for monkey P and monkey S, respectively. The vision-related neurons were primarily localized in LIPd, whereas the vision-saccade–related neurons gradually increased in number following the increase of the recording depth. (Insets) Averaged recording depth of the two types of neurons. Obviously, on average, the recording depth of vision-saccade–related neurons was deeper than for vision-related neurons (**P = 0.005 for monkey P, P = 0.177 for monkey S, t test). (C) Incidence ratio difference between these two groups of neurons revised from vision-related dominant to vision-saccade–related dominant.
The LFP Changed from Visual Evoked to Saccadic Evoked Following the Increase of Recording Depth.
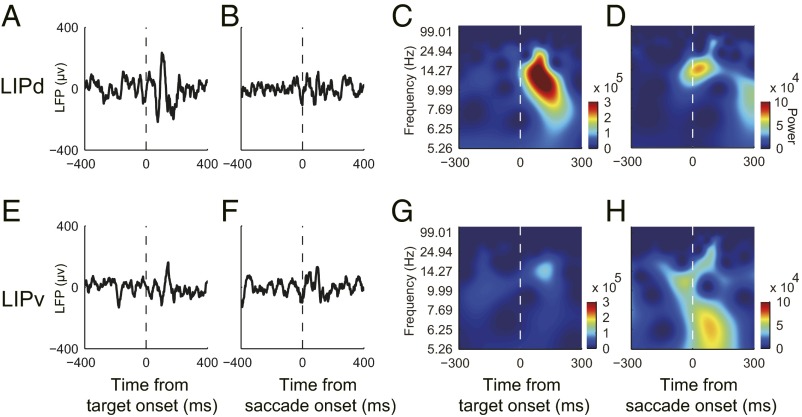
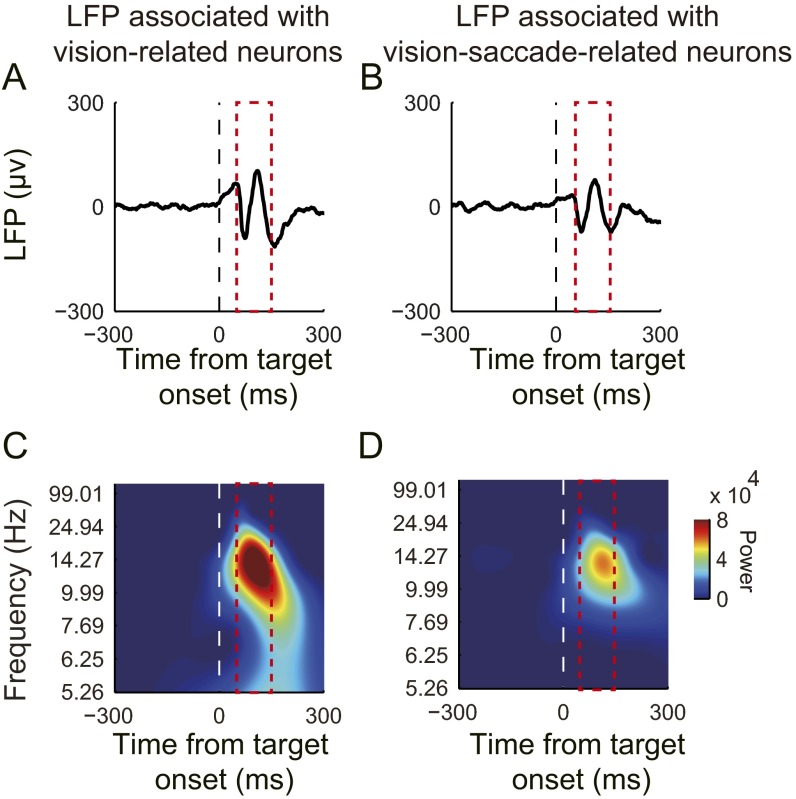
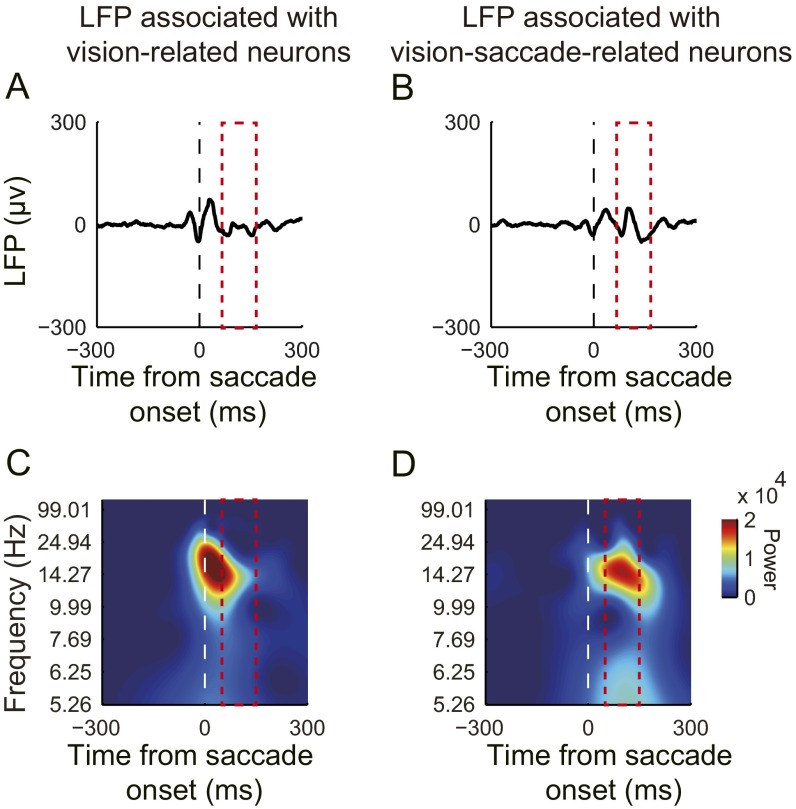
It is commonly believed that spiking activities reflect the output signals from neuron(s), whereas the LFP reflects the sum of input signals (an integral of synaptic potentials within millimeters around the recording site) (41, 42). To test whether the input signals to LIPd and LIPv were different during gap saccades, we analyzed the amplitude and the power spectrum of the LFP at each recording site. We first subtracted vision- or saccade-related potentials from the original LFP data in an attempt to dissociate them (details are provided in Methods) due to the partial temporal overlap between the vision- and saccade-related activities during gap saccades. The postsubtracted LFP of the two example recording sites (same sites as the two example neurons in Fig. 2) are shown in Fig. 5. When the activity was aligned at the visual target onset, the postsubtracted LFP associated with the example LIPd neuron quickly increased its amplitude shortly after the onset of the visual target (Fig. 5A); in contrast, the postsubtracted LFP associated with the LIPv neuron increased amplitude only slightly (Fig. 5E). The time-frequency energy analysis showed a large increase in lower frequency power after the visual target onset in the LIPd (Fig. 5C), but not in the LIPv (Fig. 5F). When the activity was aligned at the saccade onset, the postsubtracted LFP increased in amplitude greater in the LIPv (Fig. 5F) than in the LIPd (Fig. 5B), and the time-frequency energy analysis showed a larger increase in lower frequency power after saccade onset in the LIPv (Fig. 5H) than in the LIPd (Fig. 5D). Consistently, the averaged LFP data that were associated with the recordings of vision-related and vision-saccade–related neurons showed similar results as the two examples, respectively. When activity was aligned with the visual target onset, the averaged postsubtracted LFP, which was associated with vision-related neurons, showed greater amplitude and higher energy in the theta (8–15 Hz) than were associated with vision-saccade–related neurons (Fig. S2). In contrast, when activity was aligned at the saccade onset, the averaged postsubtracted LFP associated with vision-saccade–related neurons showed greater amplitude and higher energy in lower frequency than were associated with vision-related neurons (Fig. S3).
Fig. 5.
Example LFP recorded simultaneously with the exemplified vision-related and vision-saccade–related neurons, respectively. (A–D) LFP associated with the exemplified vision-related neuron (Fig. 2A). When activity was aligned at visual target onset, shortly after the appearance of the target, the LFP significantly increased in amplitude (A) and in lower frequency power (C). In contrast, when activity was aligned at saccade onset, both the amplitude (B) and the lower frequency power (D) increased slightly. (E–H) LFP associated with the exemplified vision-saccade–related neuron (Fig. 2B). When activity was aligned at visual target onset, the LFP barely changed in amplitude (E) and in the frequency power spectrum (G). When activity was aligned at saccade onset, both the amplitude (F) and the lower frequency power (H) increased significantly.
Fig. S2.
Average LFPs aligned at visual target onset. The period selected for comparison was 50–150 ms after target onset. The amplitude of the average LFP associated with vision-related neurons (A) was larger than the amplitude associated with vision-saccade–related neurons (B). Additionally, the lower frequency power of the LFP associated with vision-related neurons (C) was greater than the lower frequency power associated with vision-saccade–related neurons (D).
Fig. S3.
Average LFPs aligned at saccade onset. The period selected for comparison was 50–150 ms after saccade onset. The amplitude of the average LFP associated with vision-related neurons (A) was smaller than the amplitude associated with vision-saccade–related neurons (B). Additionally, the lower frequency power of the LFP associated with vision-related neurons (C) was smaller than the lower frequency power associated with vision-saccade–related neurons (D).
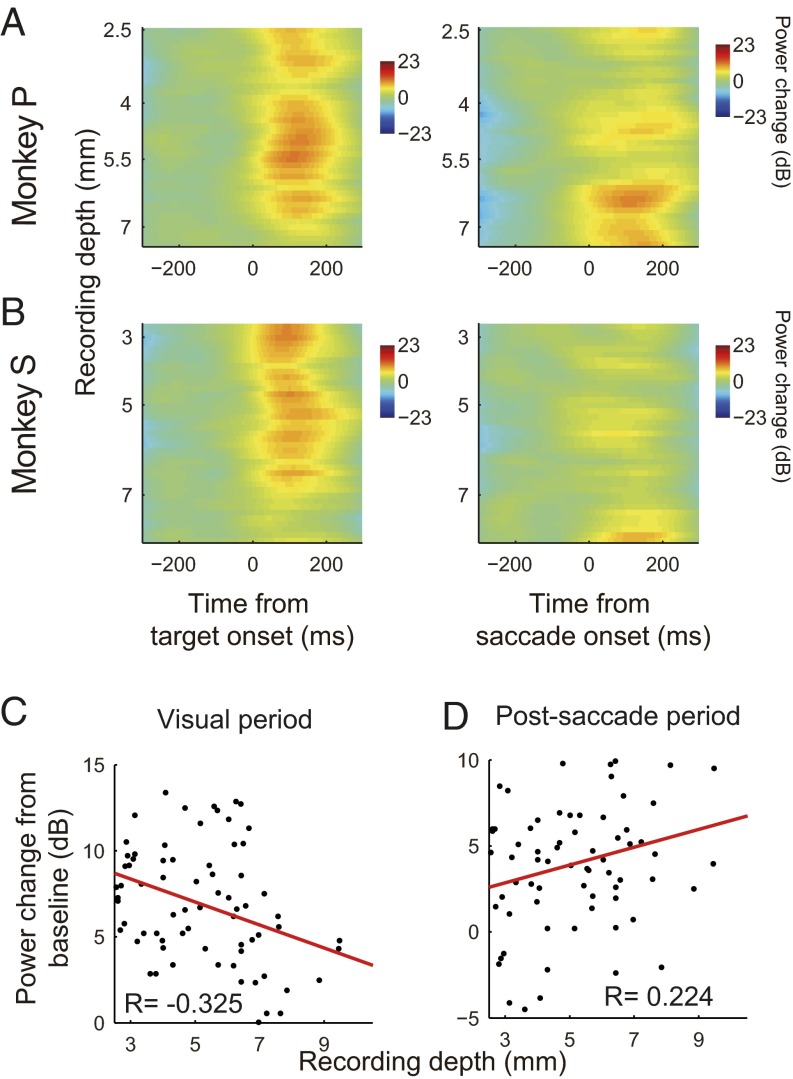
To see how visual and saccadic events affected the LFP in LIPd and LIPv, we calculated the normalized power of the lower frequencies (8–15 Hz) of 78 recording sites as a function of the recording depth under two alignments: aligned at the visual target onset (Fig. 6 A and B, Left) and aligned at the saccade onset (Fig. 6 A and B, Right). Data from both monkeys showed that following the increase of recording depth, the visual evoked potential decreased (Fig. 6 A and B, Left), whereas the saccade evoked potential increased (Fig. 6 A and B, Right). Also, the linear regression analysis of the averaged change in energy power of the lower frequency showed a negative correlation between visual evoked potential and recording depth (Fig. 6C; slope = −0.667, R = −0.325, P = 0.004), and showed a positive correlation between saccade evoked potential and recording depth (Fig. 6D; slope = 0.517, R = 0.224, P = 0.048). These LFP data suggested that the LIPd received more vision-related inputs, whereas the LIPv received more saccade-related inputs.
Fig. 6.
Change of the LFP power as a function of recording depth. (A and B) Normalized LFP data (8–15 Hz) with alignment at target onset (Left) and saccade onset (Right) for monkey P and monkey S, respectively. The LFP data from both monkeys showed that following the increase of recording depth, the visual evoked potential decreased (A and B, Left), whereas the saccade evoked potential increased (A and B, Right). The linear regression analysis of the averaged change of energy power of the lower frequency showed a negative correlation between visual evoked potential and recording depth (C; slope = −0.667, R = −0.325, P = 0.004) and a positive correlation between saccade evoked potential and recording depth (D; slope = 0.517, R = 0.224, P = 0.048).
Inactivation of LIPv Decreased the Proportion of Express Saccades.
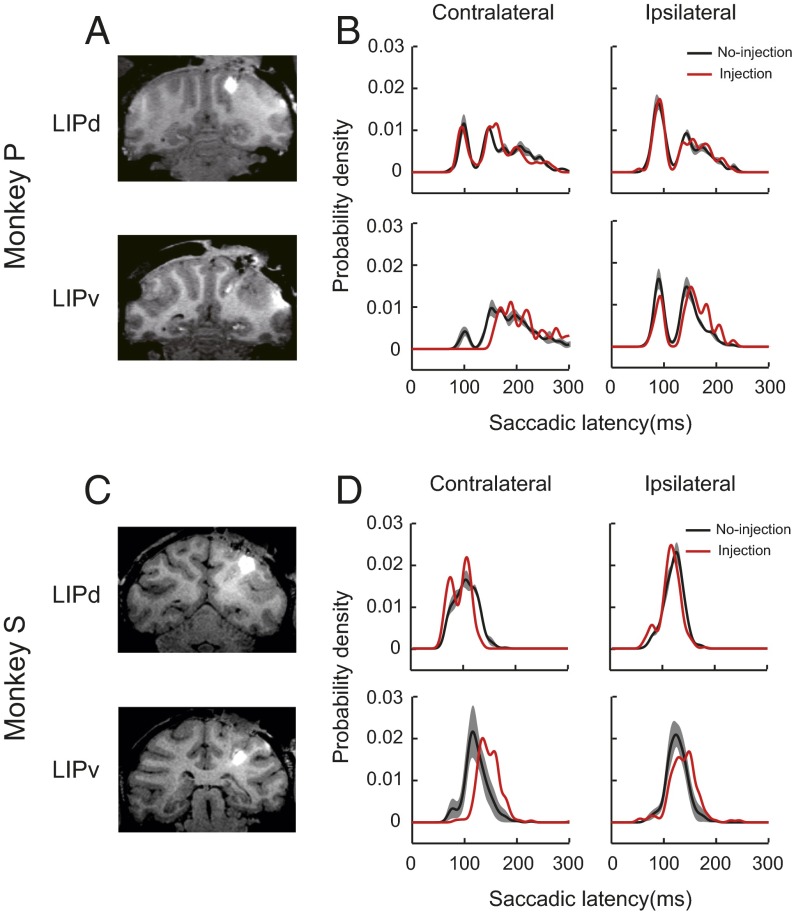
To examine the functional significance of the electrophysiological data, we performed local inactivation experiments in both monkeys by microinjection of a mixture of muscimol (GABAA agonist) and manganese (MRI contrast agent) either in LIPd or in LIPv as estimated physiologically. The injection sites were confirmed by MRI scans after each injection. In monkey P, three injections were localized in LIPd and LIPv each. In monkey S, three and five injections were localized in LIPd and LIPv, respectively. The MRI scans confirmed the loci of injections (Fig. 7A for monkey P and Fig. 7C for monkey S). After the inactivation of LIPd, the proportions of express saccades were not changed in both contralateral and ipsilateral directions (Fig. 7B, Upper for monkey P and Fig. 7D, Upper for monkey S). In contrast, after the inactivation of LIPv, the proportions of express saccades dramatically decreased in the contralateral direction, but not in the ipsilateral direction (Fig. 7B, Bottom for monkey P and Fig. 7D, Bottom for monkey S).
Fig. 7.
Examples of the effect of inactivation in LIPd and LIPv on the proportion of express saccades. (A) Coronal MRI images of monkey P confirmed that the two example injections were in LIPd and LIPv, respectively. (B) Comparison of the distribution of saccadic latency between no-injection (black) and injection (red) conditions. The gray-shaded area represents ±1 SEM in no-injection data. (B, Left Bottom) Proportion of express saccades was significantly decreased only in the contralateral direction after the inactivation of LIPv. (C and D) Inactivation data from monkey S showed similar results as monkey P.
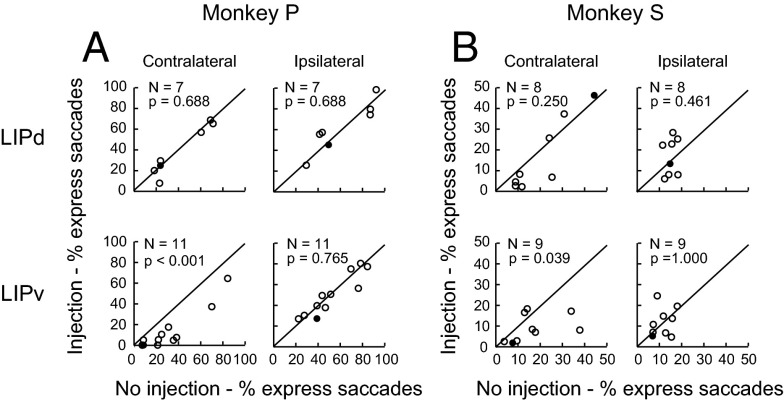
Similar results were also observed at all injection sites. Inactivation of LIPd did not significantly change the proportion of express saccades in both contralateral and ipsilateral directions (Fig. 8A, Upper for monkey P and Fig. 8B, Upper for monkey P) compared with the no-injection condition. The Wilcoxon signed rank test for the data in each of these panels resulted in the smallest P value of 0.25. In contrast, after the inactivation of LIPv, the proportions of express saccades dramatically decreased when saccades were made in the contralateral direction (Fig. 8A, Left Bottom for monkey P and Fig. 8B, Left Bottom for monkey S; P = 9.770 × 10⁻⁴ and P = 0.039, respectively, Wilcoxon signed rank test), but the proportions of express saccades were not significantly changed when saccades were made in the ipsilateral direction (Fig. 8A, Right Bottom for monkey P and Fig. 8B, Right Bottom for monkey S; P = 0.765 and P = 1.000, Wilcoxon signed rank test). Thus, the inactivation experiments confirmed the physiological finding that LIPv was more involved in the generation of express saccades than LIPd.
Fig. 8.
Comparison of the proportion of express saccades between inactivation and no-inactivation conditions. (A) Data from monkey P. Each data point represents the comparison of the proportion of express saccades between injection and no-injection conditions in an individual session of gap task. (Left Bottom) In population level, only after inactivation of LIPv does the proportion of express saccades decrease significantly. The black dot represents the example inactivation data from Fig. 7. (B) Inactivation data from monkey S showed results consistent with the results of monkey P.
Discussion
In the present study, we recorded single-unit activity and LFP from LIP during memory-guided and gap saccades. The distinct functions of the two subdivisions of LIP (LIPd and LIPv) in visuomotor control were characterized by their neural activity (spike and LFP) and the effect of local inactivation on express saccade generation.
Our data showed that the persistent response neurons during memory-guided saccades were distinctly separated into two groups in a gap saccade task: neurons that were primarily provoked by visual stimulus (vision-related) and neurons that were provoked by both visual and saccadic events (vision-saccade–related) (Figs. 2 and 3). The question of whether a persistent neuron in LIP codes visual or saccadic information has been explored previously in the memory-guided antisaccades (9), in which the visual and saccadic events were separated in time and space. Such double separation between vision and saccade provided a useful model with which to assess the encoded information by a persistent neuron. Based on intensity of response during the visual, memory, and perisaccadic periods, LIP persistent neurons could be grouped into three subsets: primary vision, primary saccade, and a mixture of vision and saccade. The reported type of vision-saccade–related neurons in the present study is composed of the primary saccade and the mixture of vision and saccade neurons in the study of memory-guided antisaccade. One possible reason that might have caused the different classification of neurons between these two studies is the fact that the latency difference between express and regular saccades is only ∼50 ms. Such a short separation in time is not sufficient to separate the vision-saccade–related neurons into further subgroups, unlike the memory-guided antisaccades. Nonetheless, the separation of persistent neurons into two subgroups in the gap saccade task (i.e., the vision-related and the vision-saccade–related) provides compelling evidence to indicate the different coding of visual and saccadic information among LIP persistent neurons.
Moreover, we found that the distributions of vision-related and vision-saccade–related neurons in LIP were anatomically clustered: The vision-related neurons were primarily localized in LIPd, whereas the vision-saccade–related neurons were grouped in LIPv. Eventually, the ratio between these two groups of neurons reversed from vision-related dominant to vision-saccade–related dominant following the deeper we explored (Fig. 4C). Consistently, the simultaneously recorded LFP also changed from vision-related potential (43–45) to saccade-related potential as the recording depth increased (Figs. 5 and 6). Because it is commonly believed that the LFP mainly reflects the sum of the synaptic inputs of a group of neurons within a range of a few millimeters (41, 42, 46, 47), our LFP results suggest that the vision-related and vision-saccade–related neurons are likely clustered separately. Such results are consistent with findings of previous studies, where neurons, reported to share similar retinotopic visual receptive fields, were localized together in LIP (23). The change of LFP from vision-related potential to saccade-related potential as a function of recording depth suggests that LIPd receives more vision-related inputs, whereas LIPv receives more saccade-related inputs (48).
The functional significance of our electrophysiological recording data was supported by the local inactivation experiments. In the gap saccade task, shortly after inactivating LIPv, the proportion of express saccades in the contralateral direction dramatically decreased (Figs. 7 and 8 ). The consistency between the results of the electrophysiology and inactivation experiments indicated that only LIPv was involved in the generation of express saccades. The functional difference between LIPd and LIPv in saccade generation might help us to understand the controversial findings among previous LIP inactivation studies. For instance, some studies reported that single (49) and multiple muscimol injections in LIP (50) failed to produce any change in the latency for saccades to the single stimulus, whereas others reported a small but reliable increase in saccadic latency (33, 51). The reliable increase in saccadic latency following LIP inactivation was observed when monkeys performed complicated tasks, such as alternative choice tasks (33, 50). The increase in saccadic latency was also found in patients with lesions in the posterior parietal cortex (52). Our study suggests that the different results from previous findings are likely due to the inactivation of different subregions in LIP.
More recently, the respective roles of LIPd and LIPv in representing attention and intention were investigated with local inactivation experiments in behaving monkeys (33). In that study, either LIPd or LIPv was reversibly inactivated by the local injection of muscimol. Two behavioral tasks were tested: a memory-guided saccade task for probing saccadic intention and a visual search task for probing visual attention. The increase of saccadic latency after the inactivation of the LIPd was only associated with the memory-guided saccade task, whereas the inactivation of the LIPv increased saccadic latency was associated with both tasks. Thus, Liu et al. (33) argued that LIPd was involved in intention to make saccades, whereas LIPv was involved in both visual attention and saccadic intention. However, LIP is a node that connects the visual and oculomotor systems. It has been found that LIP is involved in many cognitive functions, such as attention, intention, decision making, and object categorization. Because performing a memory-guided saccade task requires the involvement of both visual attention and saccadic intention, it is not clear whether the increased saccadic latency after the inactivation of LIPd was only caused by the impairment of saccadic intention and not visual attention. In contrast, our inactivation data show that the decrease of the proportion of express saccades (i.e., the increase of saccadic latency) only occurs after inactivation of LIPv, but not LIPd. Such results are consistent with the findings of anatomical studies: LIPv has many more intensive projections to the intermediate layers of superior colliculus than LIPd does.
Compared with memory-guided saccade and visual search tasks, the gap saccade task is relatively simpler and requires less involvement of cognitive functions. Nonetheless, even very simple behavioral tasks might require the involvement of a combination of perceptual, motor, and cognitive elements. Therefore, we carefully interpreted our electrophysiological and inactivation data, in terms of LIP’s function, as “vision-related” and “vision-saccade–related” rather than visual attention and saccadic intention. Although the present study of the gap saccade task could not provide a whole picture about the function of LIPd and LIPv, our results clearly show distinct roles of LIPd and LIPv in processing visuomotor information.
In summary, through comparing the activity characteristics of single neurons, LFP, and local inactivation of LIPd and LIPv, we found distinctly different functions between these two subdivisions in processing visual-oculomotor information. Specifically, LIPd is primarily used for processing vision-related information, whereas LIPv processes both vision- and saccade-related information.
Methods
Animal Preparation.
Two macaque monkeys were implanted with chronic-recording chambers over their posterior parietal lobules and scleral search coils for eye-position measurements (53). The experimental procedures followed the guidelines of the US NIH guidelines and were approved by the Animal Care and Use Committee of the Shanghai Institute for Biological Sciences, Chinese Academy of Sciences.
Behavioral Paradigms.
Memory-guided saccade task.
The memory-guided saccade task was used to find LIP and to classify the recorded neurons (34, 54) (Fig. 1A, Left). Trials began with the appearance of a cross [fixation point (FP)] on the center of the screen. Monkeys were trained to fixate on the FP for as long as it was present. Following a 500-ms fixation, a visual target briefly appeared (200 ms) at one of eight possible locations, evenly separated and positioned at equal eccentricity (12°). Monkeys had to maintain fixation until FP offset, after which they made a single saccade toward the remembered target location. Successful trials were rewarded with a drop of juice.
Gap saccade task.
Monkeys were trained to fixate on the FP for 500–1,000 ms until it was extinguished (Fig. 1A, Right). Before the target appearance, there was a blank interval (gap, 100–400 ms) during which the animals had to maintain fixation on the center of the blank screen. Within a session, the gap duration was constant. The target appeared randomly (50:50) at two possible locations, where one was in the neuron’s response field and the other was 180° away across the hemifield. Monkeys had to make a saccade within 500 ms, and then maintain fixation in the target location for 400 ms before receiving a reward.
Neural Data Analysis.
Criteria for persistent neurons.
The recorded neurons were first selected by their activity property in the memory-guided saccade task. The 1,000-ms memory interval was divided into three subintervals (333 ms each). The criterion for defining persistent activity was that the activity was significantly greater (P < 0.05, t test) in all three subintervals during the memory period than in the baseline interval (0–400 ms before target onset).
CC analysis.
The CC analysis assesses the activity similarity of a persistent neuron between express saccades and regular saccades. It compares the temporal correlation of the spike density between express and regular saccades under two alignments. When the neuronal activity was aligned to target onset, a 50–150-ms window after target onset was chosen; when the neuronal activity was aligned to saccade onset, a −50 to 50-ms window around saccade onset was chosen. The formula is as follows:
| [1] |
where x and y are the spike density functions in express and regular trials, respectively. The CC was calculated mainly under two alignments: visual target onset and saccade onset.
K-means clustering analysis.
The distribution of the comparison of single neuron’s CC values between two alignments was tested by using the k-means clustering analysis (MATLAB version 7.9.0; MathWorks) (40). To evaluate objectively how well the clustering analysis fits with the experimental data, the silhouette value of each data point, which measures the confidence level of a data point belonging to a cluster, was computed. The mathematic formula of the silhouette value is as follows:
| [2] |
where is the average distance from point to other points in a cluster and is the lowest average distance of point to any other cluster. The silhouette value ranges from +1 to −1, and a negative value indicates potential misclassification.
Analysis of LFP.
The LFP was recorded simultaneously with the spike recording through a tungsten electrode with a resistance of 0.4–1.0 MΩ per 1 KHz, and was filtered with a low-pass frequency of 300 Hz (Cerebus recording system; Blackrock). To eliminate the interference between vision-related and saccade-related potentials, we used the following normalization method: To compute the vision-related potential, the LFP data were first aligned at saccade onset, and the average LFP was computed, followed by subtraction of the average LFP from LFP (aligned at target onset) of each trial to obtain the visual residual. Conversely, to compute the saccade-related potential, the LFP data were first aligned at target onset, and the average LFP was computed, followed by subtraction of the average LFP from LFP (aligned at saccade onset) of each trial to obtain the saccadic residual.
The power spectra of the residual LFPs were averaged across all trials for each condition and then constructed by performing the wavelet transform using MATLAB version 7.9.0. The wavelet transform convolves the LFP with a complex Morlet’s wavelet :
| [3] |
Selective Inactivation of LIP.
A solution (1.5–3 μL) of a mixture of muscimol (8.0 mg/mL) and MnCl2 (19.8 mg/mL) was injected into the LIPd or the LIPv (33). After behavioral data collection, about 3 h later, the monkey was anesthetized with 1–2% (vol/vol) isoflurane in O2 to perform an MRI (Siemens 3T) scan for locating the position of injection.
Behavior data analysis.
On each day, the monkey performed several sessions of the gap saccade task with different gap durations, (i.e., 0–250 ms) and with two saccade directions. We considered each session as an independent sample. We excluded sessions with a correct rate lower than 70% or a fixation break rate higher than 16%. In total, 14.12% (12 of 85) of sessions were excluded from the data of monkey P and 8.51% (eight of 94) of sessions were excluded from data of monkey S. The proportion of express saccades was compared between sessions with the same gap duration, under both injection and no-injection conditions. No-injection sessions were selected from 4 days around the day of injection: 2 days before and after the injection.
Analysis of saccadic latency.
The distribution of saccadic latency was calculated as the probability density in each time bin, by convolution with a 6-ms-wide window of Gaussian function. The bimodal distribution of saccadic latency for each session was fitted by using a similar method as previously reported (37), but with the summation of a lognormal (LOGN) function and a generalized extreme value (GEV) function:
| [4] |
where the LOGN distribution is:
| [5] |
where the GEV distribution is:
| [6] |
where t is:
| [7] |
The crossing point of two models was defined as the boundary between express saccades and regular saccades. The mean values of the crossing points were 130.3 ms (contralateral field) and 129.8 ms (ipsilateral field) for monkey P and 99.0 ms (contralateral field) and 102.1 ms (ipsilateral field) for monkey S.
Comparison between no-injection and injection conditions.
The proportion of express saccades was compared between no-injection and injection conditions for contralateral and ipsilateral fields, respectively. The statistic significance was tested by the Wilcoxon signed rank test, because the comparison was performed under gap tasks that have the same parameters between injection and no-injection conditions.
Acknowledgments
We thank Dr. Michael E. Goldberg for his comments on data analysis and manuscript preparation. We thank Dr. Zheng Wang and Litao Zhu for their help in MRI scans and Jing Yang for animal care and laboratory management. Wangzikang Zhang edited the manuscript for English usage. This study was supported by the 973 Program (Grants 2011CBA00406 and 2014CB846101) of the Ministry of Science and Technology of China; National Natural Science Foundation of China (Grants 31471069, 91432109, 31261160495, and 31400957); Natural Science Foundation of Jiangsu Province (Grants BK20140218 and BK20150208); Talent Young Foundation of Xuzhou Medical College (Grants D2014012 and D2014013); State Key Laboratory of Neuroscience, Chinese Government; and International Data Group (IDG)/McGovern Institute for Brain Research at Beijing Normal University.
Footnotes
The authors declare no conflict of interest.
This article is a PNAS Direct Submission. M.N.S. is a Guest Editor invited by the Editorial Board.
This article contains supporting information online at www.pnas.org/lookup/suppl/doi:10.1073/pnas.1605879113/-/DCSupplemental.
References
- 1.Andersen RA, Buneo CA. Sensorimotor integration in posterior parietal cortex. Adv Neurol. 2003;93:159–177. [PubMed] [Google Scholar]
- 2.Goldberg ME, Bisley JW, Powell KD, Gottlieb J. Saccades, salience and attention: The role of the lateral intraparietal area in visual behavior. Prog Brain Res. 2006;155:157–175. doi: 10.1016/S0079-6123(06)55010-1. [DOI] [PMC free article] [PubMed] [Google Scholar]
- 3.Andersen RA, Brotchie PR, Mazzoni P. Evidence for the lateral intraparietal area as the parietal eye field. Curr Opin Neurobiol. 1992;2(6):840–846. doi: 10.1016/0959-4388(92)90143-9. [DOI] [PubMed] [Google Scholar]
- 4.Gottlieb JP, Kusunoki M, Goldberg ME. The representation of visual salience in monkey parietal cortex. Nature. 1998;391(6666):481–484. doi: 10.1038/35135. [DOI] [PubMed] [Google Scholar]
- 5.Andersen RA, Buneo CA. Intentional maps in posterior parietal cortex. Annu Rev Neurosci. 2002;25:189–220. doi: 10.1146/annurev.neuro.25.112701.142922. [DOI] [PubMed] [Google Scholar]
- 6.Snyder LH, Batista AP, Andersen RA. Coding of intention in the posterior parietal cortex. Nature. 1997;386(6621):167–170. doi: 10.1038/386167a0. [DOI] [PubMed] [Google Scholar]
- 7.Colby CL, Goldberg ME. Space and attention in parietal cortex. Annu Rev Neurosci. 1999;22:319–349. doi: 10.1146/annurev.neuro.22.1.319. [DOI] [PubMed] [Google Scholar]
- 8.Zhang M, Barash S. Neuronal switching of sensorimotor transformations for antisaccades. Nature. 2000;408(6815):971–975. doi: 10.1038/35050097. [DOI] [PubMed] [Google Scholar]
- 9.Zhang M, Barash S. Persistent LIP activity in memory antisaccades: Working memory for a sensorimotor transformation. J Neurophysiol. 2004;91(3):1424–1441. doi: 10.1152/jn.00504.2003. [DOI] [PubMed] [Google Scholar]
- 10.Bisley JW, Goldberg ME. Neuronal activity in the lateral intraparietal area and spatial attention. Science. 2003;299(5603):81–86. doi: 10.1126/science.1077395. [DOI] [PubMed] [Google Scholar]
- 11.Newsome WT, Britten KH, Movshon JA. Neuronal correlates of a perceptual decision. Nature. 1989;341(6237):52–54. doi: 10.1038/341052a0. [DOI] [PubMed] [Google Scholar]
- 12.Kiani R, Shadlen MN. Representation of confidence associated with a decision by neurons in the parietal cortex. Science. 2009;324(5928):759–764. doi: 10.1126/science.1169405. [DOI] [PMC free article] [PubMed] [Google Scholar]
- 13.Platt ML, Glimcher PW. Neural correlates of decision variables in parietal cortex. Nature. 1999;400(6741):233–238. doi: 10.1038/22268. [DOI] [PubMed] [Google Scholar]
- 14.Toth LJ, Assad JA. Dynamic coding of behaviourally relevant stimuli in parietal cortex. Nature. 2002;415(6868):165–168. doi: 10.1038/415165a. [DOI] [PubMed] [Google Scholar]
- 15.Freedman DJ, Assad JA. Experience-dependent representation of visual categories in parietal cortex. Nature. 2006;443(7107):85–88. doi: 10.1038/nature05078. [DOI] [PubMed] [Google Scholar]
- 16.Subramanian J, Colby CL. Shape selectivity and remapping in dorsal stream visual area LIP. J Neurophysiol. 2014;111(3):613–627. doi: 10.1152/jn.00841.2011. [DOI] [PMC free article] [PubMed] [Google Scholar]
- 17.Gottlieb J, Snyder LH. Spatial and non-spatial functions of the parietal cortex. Curr Opin Neurobiol. 2010;20(6):731–740. doi: 10.1016/j.conb.2010.09.015. [DOI] [PMC free article] [PubMed] [Google Scholar]
- 18.Herrington TM, Assad JA. Temporal sequence of attentional modulation in the lateral intraparietal area and middle temporal area during rapid covert shifts of attention. J Neurosci. 2010;30(9):3287–3296. doi: 10.1523/JNEUROSCI.6025-09.2010. [DOI] [PMC free article] [PubMed] [Google Scholar]
- 19.Thier P, Andersen RA. Electrical microstimulation distinguishes distinct saccade-related areas in the posterior parietal cortex. J Neurophysiol. 1998;80(4):1713–1735. doi: 10.1152/jn.1998.80.4.1713. [DOI] [PubMed] [Google Scholar]
- 20.Gaymard B, Lynch J, Ploner CJ, Condy C, Rivaud-Péchoux S. The parieto-collicular pathway: Anatomical location and contribution to saccade generation. Eur J Neurosci. 2003;17(7):1518–1526. doi: 10.1046/j.1460-9568.2003.02570.x. [DOI] [PubMed] [Google Scholar]
- 21.Lynch JC, Graybiel AM, Lobeck LJ. The differential projection of two cytoarchitectonic subregions of the inferior parietal lobule of macaque upon the deep layers of the superior colliculus. J Comp Neurol. 1985;235(2):241–254. doi: 10.1002/cne.902350207. [DOI] [PubMed] [Google Scholar]
- 22.Lewis JW, Van Essen DC. Mapping of architectonic subdivisions in the macaque monkey, with emphasis on parieto-occipital cortex. J Comp Neurol. 2000;428(1):79–111. doi: 10.1002/1096-9861(20001204)428:1<79::aid-cne7>3.0.co;2-q. [DOI] [PubMed] [Google Scholar]
- 23.Blatt GJ, Andersen RA, Stoner GR. Visual receptive field organization and cortico-cortical connections of the lateral intraparietal area (area LIP) in the macaque. J Comp Neurol. 1990;299(4):421–445. doi: 10.1002/cne.902990404. [DOI] [PubMed] [Google Scholar]
- 24.Patel GH, et al. Topographic organization of macaque area LIP. Proc Natl Acad Sci USA. 2010;107(10):4728–4733. doi: 10.1073/pnas.0908092107. [DOI] [PMC free article] [PubMed] [Google Scholar]
- 25.Medalla M, Barbas H. Diversity of laminar connections linking periarcuate and lateral intraparietal areas depends on cortical structure. Eur J Neurosci. 2006;23(1):161–179. doi: 10.1111/j.1460-9568.2005.04522.x. [DOI] [PubMed] [Google Scholar]
- 26.Lewis JW, Van Essen DC. Corticocortical connections of visual, sensorimotor, and multimodal processing areas in the parietal lobe of the macaque monkey. J Comp Neurol. 2000;428(1):112–137. doi: 10.1002/1096-9861(20001204)428:1<112::aid-cne8>3.0.co;2-9. [DOI] [PubMed] [Google Scholar]
- 27.Ben Hamed S, Duhamel JR, Bremmer F, Graf W. Representation of the visual field in the lateral intraparietal area of macaque monkeys: A quantitative receptive field analysis. Exp Brain Res. 2001;140(2):127–144. doi: 10.1007/s002210100785. [DOI] [PubMed] [Google Scholar]
- 28.Shadlen MN, Newsome WT. Neural basis of a perceptual decision in the parietal cortex (area LIP) of the rhesus monkey. J Neurophysiol. 2001;86(4):1916–1936. doi: 10.1152/jn.2001.86.4.1916. [DOI] [PubMed] [Google Scholar]
- 29.Janssen P, Shadlen MN. A representation of the hazard rate of elapsed time in macaque area LIP. Nat Neurosci. 2005;8(2):234–241. doi: 10.1038/nn1386. [DOI] [PubMed] [Google Scholar]
- 30.Bakola S, Gregoriou GG, Moschovakis AK, Savaki HE. Functional imaging of the intraparietal cortex during saccades to visual and memorized targets. Neuroimage. 2006;31(4):1637–1649. doi: 10.1016/j.neuroimage.2006.02.030. [DOI] [PubMed] [Google Scholar]
- 31.Kagan I, Iyer A, Lindner A, Andersen RA. Space representation for eye movements is more contralateral in monkeys than in humans. Proc Natl Acad Sci USA. 2010;107(17):7933–7938. doi: 10.1073/pnas.1002825107. [DOI] [PMC free article] [PubMed] [Google Scholar]
- 32.Arcaro MJ, Pinsk MA, Li X, Kastner S. Visuotopic organization of macaque posterior parietal cortex: a functional magnetic resonance imaging study. J Neurosci. 2011;31(6):2064–2078. doi: 10.1523/JNEUROSCI.3334-10.2011. [DOI] [PMC free article] [PubMed] [Google Scholar]
- 33.Liu Y, Yttri EA, Snyder LH. Intention and attention: different functional roles for LIPd and LIPv. Nat Neurosci. 2010;13(4):495–500. doi: 10.1038/nn.2496. [DOI] [PMC free article] [PubMed] [Google Scholar]
- 34.Barash S, Bracewell RM, Fogassi L, Gnadt JW, Andersen RA. Saccade-related activity in the lateral intraparietal area. II. Spatial properties. J Neurophysiol. 1991;66(3):1109–1124. doi: 10.1152/jn.1991.66.3.1109. [DOI] [PubMed] [Google Scholar]
- 35.Boch R, Fischer B, Ramsperger E. Express-saccades of the monkey: Reaction times versus intensity, size, duration, and eccentricity of their targets. Exp Brain Res. 1984;55(2):223–231. doi: 10.1007/BF00237273. [DOI] [PubMed] [Google Scholar]
- 36.Saslow MG. Latency for saccadic eye movement. J Opt Soc Am. 1967;57(8):1030–1033. doi: 10.1364/josa.57.001030. [DOI] [PubMed] [Google Scholar]
- 37.Guan S, Liu Y, Xia R, Zhang M. Covert attention regulates saccadic reaction time by routing between different visual-oculomotor pathways. J Neurophysiol. 2012;107(6):1748–1755. doi: 10.1152/jn.00082.2011. [DOI] [PubMed] [Google Scholar]
- 38.Chen M, Liu Y, Wei L, Zhang M. Parietal cortical neuronal activity is selective for express saccades. J Neurosci. 2013;33(2):814–823. doi: 10.1523/JNEUROSCI.2675-12.2013. [DOI] [PMC free article] [PubMed] [Google Scholar]
- 39.Mackay D. Information Theory, Inference and Learning Algorithm. Cambridge Univ Press; Cambridge, UK: 2003. [Google Scholar]
- 40.Economides JR, Sincich LC, Adams DL, Horton JC. Orientation tuning of cytochrome oxidase patches in macaque primary visual cortex. Nat Neurosci. 2011;14(12):1574–1580. doi: 10.1038/nn.2958. [DOI] [PMC free article] [PubMed] [Google Scholar]
- 41.Kajikawa Y, Schroeder CE. How local is the local field potential? Neuron. 2011;72(5):847–858. doi: 10.1016/j.neuron.2011.09.029. [DOI] [PMC free article] [PubMed] [Google Scholar]
- 42.Xing D, Yeh CI, Shapley RM. Spatial spread of the local field potential and its laminar variation in visual cortex. J Neurosci. 2009;29(37):11540–11549. doi: 10.1523/JNEUROSCI.2573-09.2009. [DOI] [PMC free article] [PubMed] [Google Scholar]
- 43.Ray S, Maunsell JH. Differences in gamma frequencies across visual cortex restrict their possible use in computation. Neuron. 2010;67(5):885–896. doi: 10.1016/j.neuron.2010.08.004. [DOI] [PMC free article] [PubMed] [Google Scholar]
- 44.Katzner S, et al. Local origin of field potentials in visual cortex. Neuron. 2009;61(1):35–41. doi: 10.1016/j.neuron.2008.11.016. [DOI] [PMC free article] [PubMed] [Google Scholar]
- 45.Di Russo F, Aprile T, Spitoni G, Spinelli D. Impaired visual processing of contralesional stimuli in neglect patients: A visual-evoked potential study. Brain. 2008;131(Pt 3):842–854. doi: 10.1093/brain/awm281. [DOI] [PubMed] [Google Scholar]
- 46.Logothetis NK, Kayser C, Oeltermann A. In vivo measurement of cortical impedance spectrum in monkeys: Implications for signal propagation. Neuron. 2007;55(5):809–823. doi: 10.1016/j.neuron.2007.07.027. [DOI] [PubMed] [Google Scholar]
- 47.Buzsáki G, Anastassiou CA, Koch C. The origin of extracellular fields and currents--EEG, ECoG, LFP and spikes. Nat Rev Neurosci. 2012;13(6):407–420. doi: 10.1038/nrn3241. [DOI] [PMC free article] [PubMed] [Google Scholar]
- 48.Scherberger H, Jarvis MR, Andersen RA. Cortical local field potential encodes movement intentions in the posterior parietal cortex. Neuron. 2005;46(2):347–354. doi: 10.1016/j.neuron.2005.03.004. [DOI] [PubMed] [Google Scholar]
- 49.Schiller PH, Tehovnik EJ. Cortical inhibitory circuits in eye-movement generation. Eur J Neurosci. 2003;18(11):3127–3133. doi: 10.1111/j.1460-9568.2003.03036.x. [DOI] [PubMed] [Google Scholar]
- 50.Wardak C, Olivier E, Duhamel JR. Saccadic target selection deficits after lateral intraparietal area inactivation in monkeys. J Neurosci. 2002;22(22):9877–9884. doi: 10.1523/JNEUROSCI.22-22-09877.2002. [DOI] [PMC free article] [PubMed] [Google Scholar]
- 51.Li CS, Mazzoni P, Andersen RA. Effect of reversible inactivation of macaque lateral intraparietal area on visual and memory saccades. J Neurophysiol. 1999;81(4):1827–1838. doi: 10.1152/jn.1999.81.4.1827. [DOI] [PubMed] [Google Scholar]
- 52.Duhamel JR, Goldberg ME, Fitzgibbon EJ, Sirigu A, Grafman J. Saccadic dysmetria in a patient with a right frontoparietal lesion. The importance of corollary discharge for accurate spatial behaviour. Brain. 1992;115(Pt 5):1387–1402. doi: 10.1093/brain/115.5.1387. [DOI] [PubMed] [Google Scholar]
- 53.Robinson DA. A method of measuring eye movement using a scleral search coil in a magnetic field. IEEE Trans Biomed Eng. 1963;10:137–145. doi: 10.1109/tbmel.1963.4322822. [DOI] [PubMed] [Google Scholar]
- 54.Barash S, Bracewell RM, Fogassi L, Gnadt JW, Andersen RA. Saccade-related activity in the lateral intraparietal area. I. Temporal properties; comparison with area 7a. J Neurophysiol. 1991;66(3):1095–1108. doi: 10.1152/jn.1991.66.3.1095. [DOI] [PubMed] [Google Scholar]


