Significance
ALS is an incurable neurodegenerative disease caused by loss of motor neurons leading to paralysis and death. To understand the disease mechanism and develop therapeutics, mammalian models that phenocopy human disease are crucial. For more than two decades, transgenic animals expressing mutant copper zinc superoxide dismutase (SOD1) gene represented the only model that faithfully reproduced the human disease. Despite recent identification of new causal genes, construction of another mammalian model with progressive loss of motor neurons and concomitant clinical phenotypes has proven difficult. In this study, we have generated a transgenic mouse model by expressing mutant profilin 1. These mice replicate key features of human ALS and thus provide an in vivo system for study of disease mechanisms and development of therapeutics.
Keywords: neurodegeneration, motor neuron disease, muscle atrophy, denervation, proteostasis
Abstract
Mutations in the profilin 1 (PFN1) gene cause amyotrophic lateral sclerosis (ALS), a neurodegenerative disease caused by the loss of motor neurons leading to paralysis and eventually death. PFN1 is a small actin-binding protein that promotes formin-based actin polymerization and regulates numerous cellular functions, but how the mutations in PFN1 cause ALS is unclear. To investigate this problem, we have generated transgenic mice expressing either the ALS-associated mutant (C71G) or wild-type protein. Here, we report that mice expressing the mutant, but not the wild-type, protein had relentless progression of motor neuron loss with concomitant progressive muscle weakness ending in paralysis and death. Furthermore, mutant, but not wild-type, PFN1 forms insoluble aggregates, disrupts cytoskeletal structure, and elevates ubiquitin and p62/SQSTM levels in motor neurons. Unexpectedly, the acceleration of motor neuron degeneration precedes the accumulation of mutant PFN1 aggregates. These results suggest that although mutant PFN1 aggregation may contribute to neurodegeneration, it does not trigger its onset. Importantly, these experiments establish a progressive disease model that can contribute toward identifying the mechanisms of ALS pathogenesis and the development of therapeutic treatments.
ALS is a neurodegenerative disease that causes a relentless progressive loss of motor neurons, leading to progressive weakness that ends in paralysis and death (1). Mutations in the PFN1 gene have been identified as a genetic cause for ALS (2, 3). PFN1 is a major regulator of actin polymerization through its ability to bind actin-ADP monomers and promote the conversion of actin-ADP to actin-ATP, through transporting the actin-ATP monomers and through its interactions within formins present at the growing end of actin filaments. Additionally PFN1 binds to phosphoinositides and a large network of proteins with poly–l-proline stretches. Through these binding interactions, PFN1 regulates several cellular functions including actin dynamics, membrane trafficking, neuronal synaptic structure and activity, small GTPase signaling, and others (4). Despite our understanding of its function, how PFN1 mutations cause motor neuron degeneration remains elusive. Some evidence implicates a loss of function in the mutants. The ALS-associated mutations cause structural instability and accumulate in cells at lower levels than the wild-type protein (5). Mutant PFN1 binds less efficiently to actin than the wild-type protein, suggesting that the mutations compromise PFN1 function (3). The severest mutations also are incapable of compensating for loss-of-function PFN1 mutation in yeast (6). Other evidence supports a gain of function. Expression of mutant, but not wild-type, PFN1 inhibits filamentous actin formation and impairs growth cone function and neurite growth (3). Furthermore, PFN1 mutants have been shown to alter stress granule dynamics in cultured mammalian cells and form cellular aggregates that may contain other proteins contributing to pathogenesis (6).
To address this question, mammalian models may provide a direct answer, as they offer a true in vivo environment of the central nervous system (CNS), where long-term age-associated changes can occur. To this end, we have generated transgenic mice that express the C71G mutation (PFN1C71G) previously shown to be causative for ALS. We show that exogenous expression of the mutant protein, but not the wild-type (PFN1WT), causes a late onset motor dysfunction phenotype with muscle weakness that subsequently progresses to paralysis and death. Mutant mice developed a relentless progression of motor neuron degeneration in which the severity is dose-dependent on the levels of mutant PFN1. Analysis of the end stage disease demonstrates common ALS hallmarks, including alteration in cytoskeleton, accumulation of ubiquitin and p62, and most importantly, depletion of motor neurons with muscle denervation and atrophy. Interestingly, motor neuron degeneration precedes the accumulation of mutant PFN1 protein aggregates. These results suggest that although aggregation may contribute to neurodegeneration, it is unlikely the trigger for motor neuron degeneration.
Results
Mutant and Wild-Type PFN1 Are Mostly Expressed in the CNS Neurons.
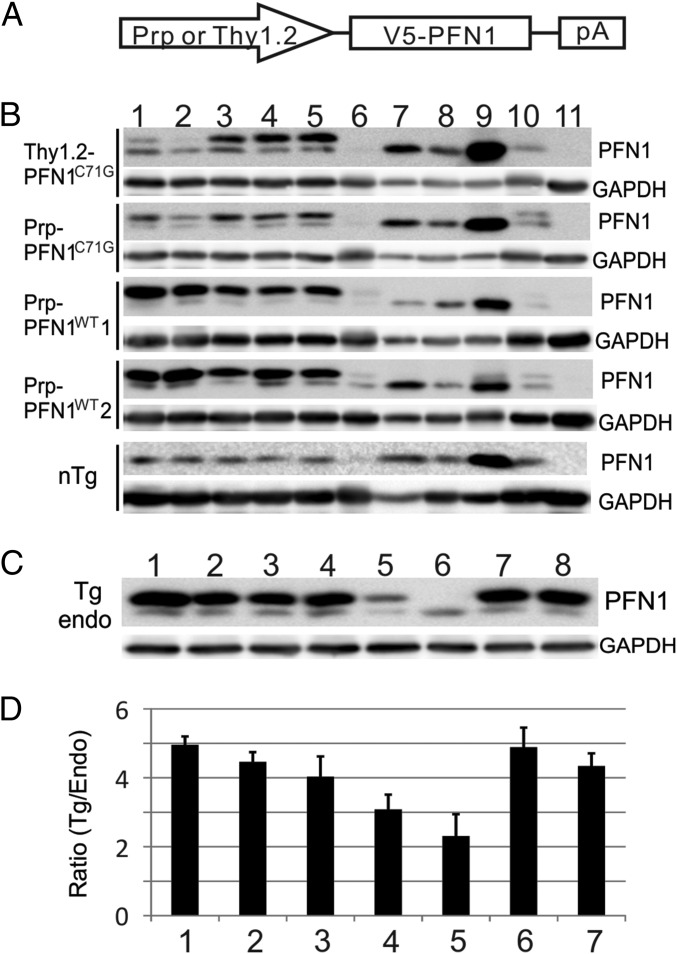
To investigate the mechanism of PFN1 mutant toxicity, we created six different transgene constructs. Three constructs contained the full genomic region including ∼2 kb of the 5′ promoter sequence of the human PFN1 gene and expressed the wild-type (V5-PFN1WT) or two mutant (V5-PFN1C71G, V5-PFN1M114T) proteins with a V5 N-terminal epitope tag (Fig. 1A and Table S1). These mutations were chosen because they were both found to segregate properly in two large ALS families, form ubiquitinated insoluble aggregates when expressed in cells, inhibit axon outgrowth, and reduce F/G-actin levels and size within the growth cone of primary motor neurons. No mice generated from these construct expressed exogenous levels of mutant PFN1 protein above endogenous mouse PFN1 protein levels nor displayed symptoms of ALS (Table S1). Subsequently, we developed two additional constructs expressing either mutant V5-PFN1C71G or V5-PFN1WT driven by the mouse prion promoter (Prp) and a third construct expressing mutant V5-PFN1C71G driven by the human Thy1.2 promoter (Fig. 1A). Both of these promoters have been used in the development of transgenic models of ALS and other neurodegenerative diseases (7, 8). After screening, we obtained two wild-type lines and two mutant lines that expressed exogenous PFN1 protein at levels higher than the endogenous mouse PFN1 in the CNS (Fig. 1B and Table S1). A survey of major CNS areas and peripheral organs by Western blot demonstrated that all four lines expressed the exogenous PFN1 predominantly in the CNS with minimal expression in the periphery (Fig. 1B).
Fig. 1.
Exogenous PFN1 is predominantly expressed in the CNS within transgenic lines. (A) Transgene constructs expressed PFN1 cDNA with an N-terminal V5 epitope tag. Transgenic lines used the mouse prion (Prp) promoter to drive expression of either wild-type (Prp-PFN1WT) or an ALS-associated mutant (Prp-PFN1C71G) PFN1. An additional mouse line used the human Thy1.2 promoter to drive expression of mutant PFN1 (Thy1.2-PFN1C71G). (B) Western blots demonstrate that four transgenic lines (two wild-type, two mutant) express the transgenes (upper band) predominantly in the CNS. Lanes represent different organs: 1, forebrain; 2, cerebellum; 3, brainstem; 4, cervical spinal cord; 5, lumbar spinal cord; 6, heart; 7, lung; 8, liver; 9, spleen; 10, kidney; 11, muscle. nTg, nontransgenic mice. (C) Western blots for PFN1 demonstrate the relative expression of exogenous PFN1 in the spinal cord after intercrossing the two mutant transgenic lines. endo, endogenous PFN1; Tg, V5-PFN1 transgene; 1, Thy1.2-PFN1C71G/C71G/Prp-PFN1C71G triple transgenic mice; 2, Thy1.2-PFN1C71G/C71G homozygous mice; 3, Thy1.2-PFN1C71G/Prp-PFN1C71G double transgenic mice; 4, Thy1.2-PFN1C71G mice; 5, Prp-PFN1C71G mice; 6, nTg mice; 7, Prp-PFN1WT line 1; 8, Prp-PFN1WT line 2. (D) Quantification of Western blots defines the transgene PFN1 expression levels relative to the endogenous levels in the spinal cord. Bars 1–5 are the same as in C. Bars 6 and 7 are Prp-PFN1WT lines 1 and 2, respectively. Error bars are SE. Four mice were quantified in each line.
Table S1.
Screens for PFN1 transgenic lines
| Construct | Lines screened | Lines positive | Lines express | Lines express ≥ endo |
| Genomic PFN1c71g | 38 | 17 | 8 | 0 |
| Genomic PFN1c114t | 39 | 11 | 3 | 0 |
| Genomic PFN1WT | 37 | 4 | 2 | 0 |
| Prp-PFN1WT | 36 | 7 | 7 | 2 |
| Prp-PFN1c71g | 41 | 8 | 3 | 1 |
| Thy1.2-PFN1c71g | 75 | 15 | 6 | 1 |
| Total | 266 | 62 | 29 | 4 |
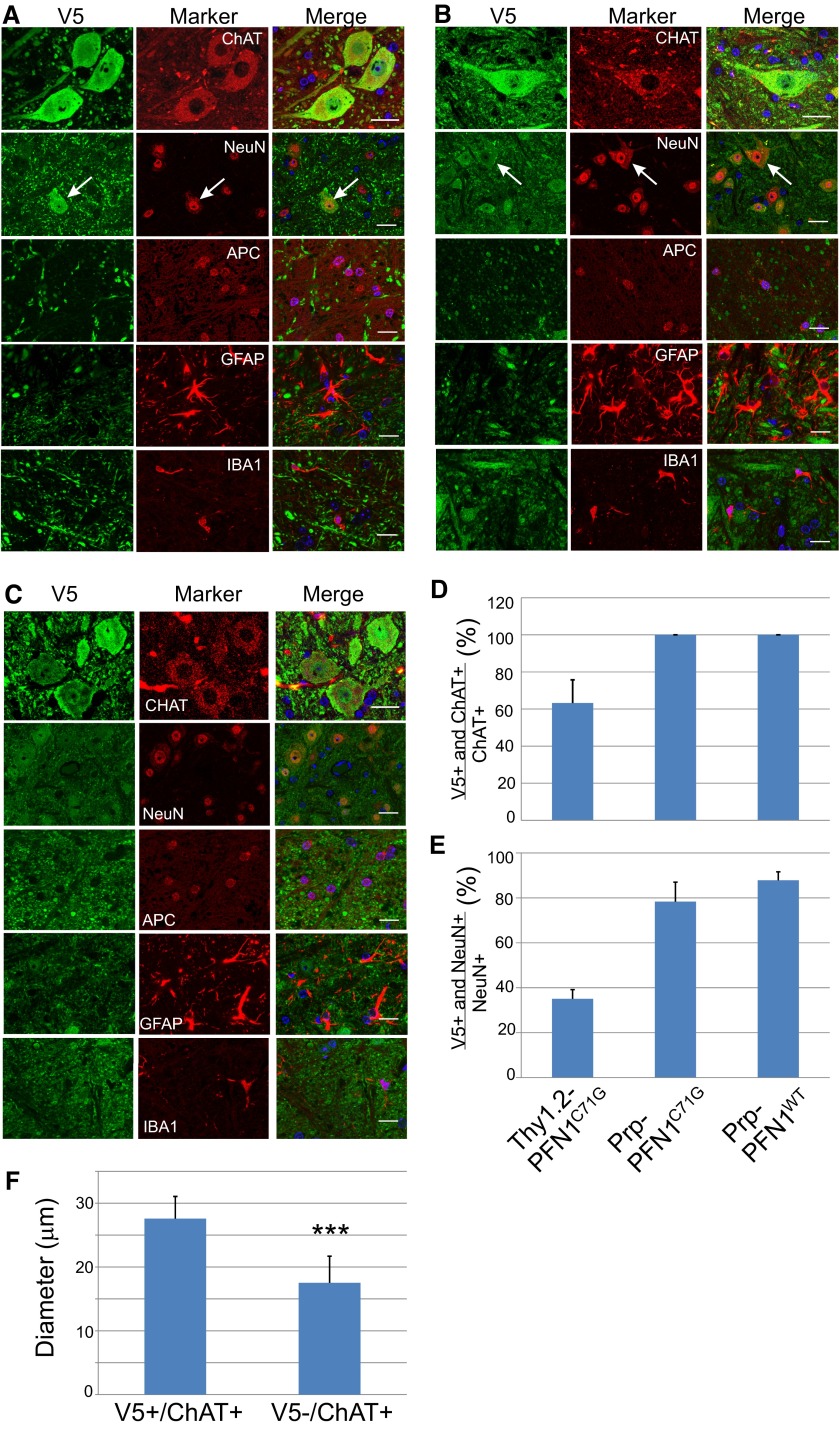
Because our transgenic lines were based on expression driven by two different promoters (Prp and Thy1.2), we investigated the cell-type expression of the exogenous gene in each line by double immunofluorescence staining in the spinal cord sections. In Thy1.2-PFN1C71G mice, the exogenous protein was expressed in ChAT-positive motor neurons but not in small neurons, oligodendrocytes, astrocytes, or microglia (Fig. S1A). Further quantification in the ventral horn revealed exogenous expression in ∼60% of ChAT-positive (Fig. S1D) and ∼30% of NeuN-positive neurons (Fig. S1E). Among the ChAT-positive neurons, the average diameter of those that expressed mutant PFN1 was ∼50% larger than those that did not express the mutant protein (Fig. S1F), suggesting that Thy1.2 expression is primarily in the largest motor neuron population. In the Prp-PFN1C71G mice, the exogenous protein was expressed in more neurons, including both ChAT-positive and ChAT-negative neurons (Fig. S1B). Similar to Thy1.2-PFN1C71G mice, the exogenous protein was not detected in oligodendrocytes, astrocytes, and microglia (Fig. S1B). Expression was observed in ∼80% of NeuN-positive neurons that included all ChAT-positive neurons (Fig. S1 D and E). The Prp-PFN1WT mice displayed a similar pattern of expression as the Prp-PFN1C71G mice. In summary, these results demonstrate that mutant PFN1 driven by the Thy1.2 promoter is expressed in the largest α motor neuron population, whereas the transgene expression is broader in Prp-PFN1C71G and PrP-PFN1WT mice, including both motor and nonmotor neurons.
Fig. S1.
(A) Thy1.2-PFN1C71G mice express the mutant PFN1 only in large motor neurons. Lumbar spinal cord sections from presym mice were stained for V5 and cell-specific markers: ChAT for motor neurons, NeuN for all neurons, APC for oligodendrocytes, GFAP for astrocytes, and Iba1 for microglia. Note that the V5 signal only overlaps with ChAT-positive cells and the largest neurons (arrow in the second row). (Scale bar, 40 µm.) (B) Prp-PFN1C71G mice express the mutant PFN1 in wide neuronal populations that include motor neurons, but they do not express in glial cells including oligodendrocytes, astrocytes, and microglia. Cell-specific markers are the same as in A. Note that the V5 signal overlaps with all NeuN-positive cells including the largest neurons (arrow in the second row). (Scale bar, 40 µm.) (C) Prp-PFN1WT mice express mutant PFN1 in the same cell populations as in the Prp-PFN1C71G mice shown in B. Cell-specific markers are the same as in A. (Scale bar, 40 µm.) (D–F) CNS cells that express the transgenes are quantified. (D) In the ventral horn, 60% of ChAT-positive neurons express the mutant PFN1 in Thy1.2-PFN1C71G mice, whereas all ChAT-positive neurons express the mutant in Prp-PFN1C71G and Prp-PFN1WT mice. (E) In the ventral horn, approximately 35% of NeuN-positive neurons express the mutant PFN1 in Thy1.2-PFN1C71G mice, whereas nearly 80% express transgene in Prp-PFN1C71G and Prp-PFN1WT mice. (F) The sizes of ChAT-positive neurons in D were measured from the ChAT-stained areas and converted to equivalent diameters. The result shows that the V5-positive cells are significantly larger than the V5-negative cells (***P < 0.001). The bars in D–F represent averages from 30 or more ChAT-positive neurons per animal and 100 or more NeuN-positive neurons per animal. Each bar represents an average from four to five animals. Error bars are SD.
Expression of Mutant PFN1 Induces ALS Phenotype in a Dose-Dependent Manner.
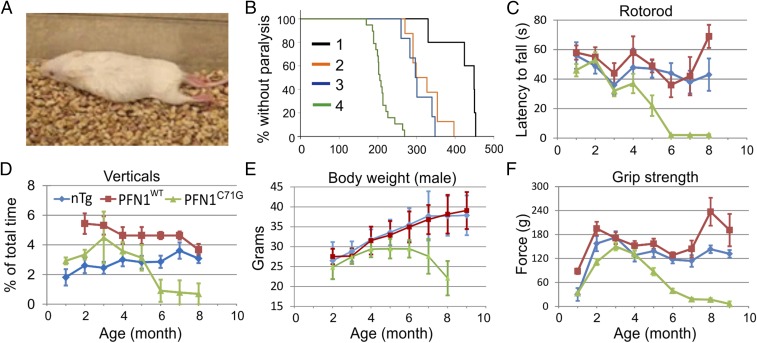
Of the two mutant lines, the Prp-PFN1C71G line did not develop any ALS phenotype up to the age of 700 d. In contrast, all Thy1.2-PFN1C71G mice began to show slight weakness (Materials and Methods) at an average age of ∼350 d (n = 5) and become paralyzed at 421 ± 52 d (mean ± SD; Fig. 2 A and B and Movie S1). One possible explanation for the difference in phenotype between Thy1.2-PFN1C71G and Prp-PFN1C71G is that the disease phenotype is dependent on the level of mutant PFN1, which must exceed a disease-triggering threshold. This hypothesis was supported by Western blot analysis of the spinal cord, which displayed a ∼40% increase in exogenous expression in the Thy1.2-PFN1C71G line relative to the Prp-PFN1C71G line (Fig. 1 C and D). This result may be further underscored by our observation that Thy1.2 promoter expression is primarily in motor neurons, whereas Prp promoter expression is broader, including both motor and nonmotor neurons.
Fig. 2.
Transgenic mice expressing mutant but not WT PFN1 show progressive loss of motor capabilities. (A) Photo of a Thy1.2-PFN1C71G transgenic at ∼400 d old displaying ppar (Movie S1). (B) The onset age of paralysis of mutant PFN1 mice are shown: 1, Thy1.2-PFN1C71G mice; 2, Thy1.2-PFN1C71G/C71G mice; 3, Thy1.2-PFN1C71G/Prp-PFN1C71G mice; 4, Thy1.2-PFN1C71G/C71G/Prp-PFN1C71G mice. The rank order of the ages correlated inversely with the expression of the mutant PFN1 protein (Fig. 1 C and D). The plots represent data from both genders, as this did not appear to contribute to disease onset or progression (Fig. S2A). (C) Rotorod tests demonstrated stable performances in the nTg and PFN1WT mice but a progressive decline in the PFN1C71G mice after 4 mo of age. All time points represent averages of 5–28 mice, 4–21 mice, and 10–25 mice for the nTg, PFN1WT, and PFN1C71G groups, respectively, with the exception of the end point for PFN1C71G (n = 2). Error bars represent the SE. (D) PFN1C71G mice display a progressive decline in home cage vertical behavior (rearing, jumping, hanging, climbing, and coming down). Vertical time points represent averages from 8 to 10 mice, 7–10 mice, and 8–10 for the nTg, PFN1WT, and PFN1C71G groups, respectively. Error bars are SE. (E) The peak body weight of PFN1C71G mice is reached between age 4 and 6 mo and declined afterward. In contrast, the nTg and PFN1WT mice progressively increased body weight beyond this time period. Female mice display a similar pattern of weight loss (Fig. S2B). Time points are averages of 11–30 mice, 3–18 mice, and 9–21 mice for the nTg, PFN1WT, and PFN1C71G groups, respectively. Error bars represent the SD. (F) Grip strength tests demonstrated stable performances in the nTg and PFN1WT mice but a progressive decline in PFN1C71G mice after peaking at 3 mo of age. Time points are averages of 8–25 mice, 6–15 mice, and 11–32 mice for the nTg, PFN1WT, and PFN1C71G groups, respectively. The color representation of mouse genotypes in C–F is shown in D. Error bars represent the SE.
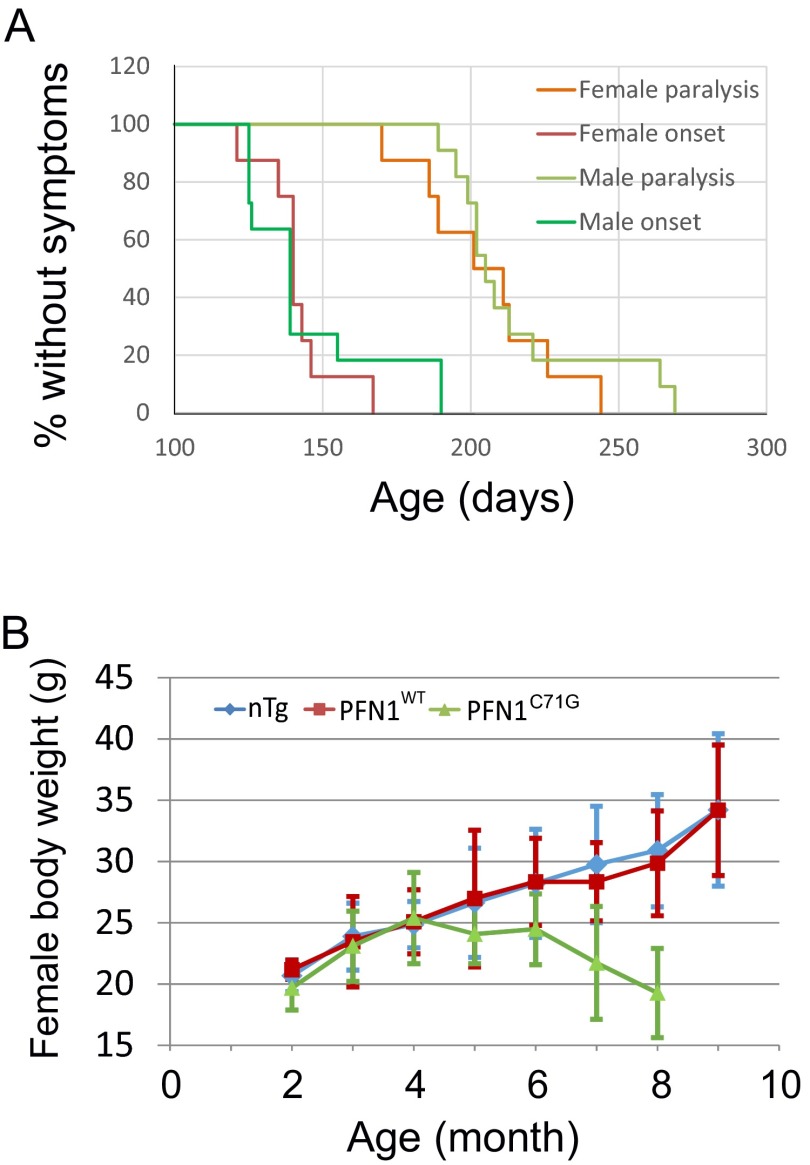
To further investigate this hypothesis, we crossed the transgenic lines to produce homozygote mice in an effort to further increase expression of the PFN1C71G transgene. The crosses within the Prp-PFN1C71G line did not yield any homozygotes, suggesting this genotype is lethal. In contrast, Thy1.2-PFN1C71G homozygous mice resulted in a 50% increase in exogenous expression relative to the hemizygous mice (Fig. 1D, compare bar 2 with bar 4). Interestingly, the Thy1.2-PFN1C71G homozygous mice begin to display weakness at ∼150 d and full paralysis (par) at 321 ± 38 d (n = 8). This represents a 25% reduction in survival relative to the Thy1.2-PFN1C71G hemizygous mice (Fig. 2B and Movie S2). To determine whether a subthreshold level of mutant PFN1 expression in the Prp-PFN1C71G line can modulate the disease phenotype, we crossed between the Thy1.2-PFN1C71G and the Prp-PFN1C71G lines. The resulting double hemizygous mice (Thy1.2-PFN1C71G/Prp-PFN1C71G mice) expressed higher level of exogenous mutant PFN1 than either Thy1.2-PFN1C71G or Prp-PFN1C71G alone (Fig. 1D, compare bar 3 with bar 4 or bar 5). This increased PFN1C71G expression resulted in a more severe phenotype with mice displaying weakness at ∼295 d and par at 305 ± 34 d (n = 6) (Fig. 2B and Movie S3). Lastly, we generated triple transgenic mice with a Thy1.2-PFN1C71G homozygous and Prp-PFN1C71G hemizygous genotype. These mice expressed the highest levels of exogenous protein (Fig. 1 C and D) and developed the disease most rapidly at ∼140 d, with par at 211 ± 25 d (n = 19) (Fig. 2B and Movie S4). Both males and females showed the same pattern of disease progression (Fig. S2A). Taken together, these results suggest that the severity of disease phenotype of the PFN1C71G mice is correlated with the expression of the exogenous mutant protein. In contrast to the mutant PFN1 mice, none of the PFN1WT mice from the two transgenic lines developed ALS up to the age of 700 d or older, even though their expression levels were similar to the highest mutant expression levels (Fig. 1 C and D and Fig. S2A). Because the homozygous Thy1.2/heterozygous Prp-PFN1C71G mice develop the most severe phenotype, we concentrated our successive analysis on this line. Subsequently, these mice will be referred to as PFN1C71G mice.
Fig. S2.
Characterization of disease phenotype in PFN1C71G mice. (A) Male (n = 11) and female (n = 8) transgenic mice show the same disease onset and paralysis ages. The mean onset age (±SD) for males is 145 ± 24 d and for females 142 ± 13 d. The mean paralysis age for males is 215 ± 27 d and for females 205 ± 24 d. The differences between the sexes are not statistically significant (P > 0.05, Wilcoxon Rank Sum test). (B) The body weight of the female PFN1C71G mice shows the same changing pattern as the male mice (Fig. 2E). Body weight reached the peak between age 4 and 6 mo and declined afterward, whereas it continued to climb in nTg and PFN1WT mice. Time points are averages from 4–24, 7–13, and 6–14 animals in nTg, WT, and ph(h)PFN1C71G groups, respectively.
Mutant PFN1 Mice Display Late-Onset and Progressive Paralysis.
To further evaluate the progression of the disease, we first observed the evolution of the clinical symptoms. Before 100 d, the behavior of PFN1C71G mice was indistinguishable from control animals, including the nontransgenic (nTg) and PFN1WT mice. Between 100 and 120 d of age, ∼10% of PFN1C71G mice began to show a slight foot dragging in their gate. We have defined this phenotype as the “slight weakness (swk)” stage in the disease progression. Between 121 and 140 d, ∼70% of mice reached the swk stage, and between 141 and 170 d, 100% of PFN1C71G mice reached this stage with many developing obvious leg dragging and slow local motion, defined as the “weakness (Wk) stage.” Beyond 170 d, all mice progressed through partial paralysis (ppar) to par in both forelimbs and hindlimbs (Movie S4).
To better illustrate the progressive nature of the motor dysfunction, we quantified several motor behaviors, including rotorod, the home cage vertical behavior (rearing, jumping, hanging on the cage top and coming down), body weight, and grip strength. In all of these measures, the PFN1C71G mice initially performed similar to the nTg and PFN1WT controls but succumbed to progressive weakness beginning at ∼121–150 d and ending eventually in paralysis (Fig. 2 and Fig. S2B). In contrast, stable performances were observed in the nTg and PFN1WT controls (Fig. 2). These results demonstrate that the phenotype observed in the mutant PFN1 mice is late-onset and progressive, similar to progression of ALS observed in humans.
The Mutant PFN1 Mice Develop Progressive Loss of Spinal Motor Neurons.
To determine the pathological basis for the progressive motor dysfunction phenotype, we examined the spinal cord. Immunostaining for the V5 epitope revealed similar expression patterns in PFN1C71G and PFN1WT mice. In both, the transgenes were expressed widely in the gray matter of the spinal cord (Fig. S3A). Based on the cell-type identification described earlier, the exogenous expression was located in neurons (including motor neurons) and their surrounding neuropils but not in glia (Fig. S1). Quantification of V5-staining intensity showed that motor neurons express similar levels of transgenes in the PFN1C71G and PFN1WT mice (Fig. S3B).
Fig. S3.
PFN1C71G and PFN1WT mice express the transgene in spinal cord and in motor neurons at similar levels. (A) Both PFN1C71G and PFN1WT mice expressed the transgene broadly in the gray matter of the spinal cord as shown by V5 staining in the lumbar area. The cervical spinal cord shows the same pattern. (B) Spinal cords from PFN1C71G and PFN1WT mice were sectioned and doubly stained for V5 and ChAT in parallel. Images were taken using confocal microscopy using the same exposure settings. The fluorescence intensity in individual cells was quantified (unfilled symbols) and averaged from each animal. The averages of individual animals were averaged and plotted as the average of the genotype (filled symbols with error bars, which represent SD). Symbols arranged in one vertical line represent values from cells in one animal.
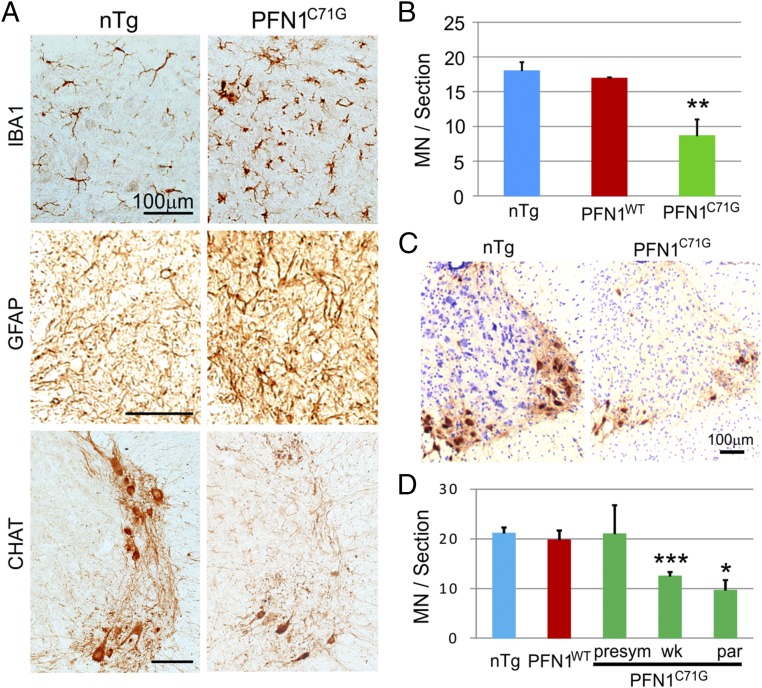
To determine whether mutant PFN1 expression caused motor neuron degeneration that consequently led to the progressive motor phenotype, we examined the ventral horn of the spinal cord for microgliosis and astrogliosis commonly associated with neurodegeneration in the CNS. We found that both microgliosis and astrogliosis were increased and motor neurons were reduced in the lumbar spinal cord at the end stage of the disease compared with age-matched nTg controls (Fig. 3 A and B). Quantification of ChAT-positive neurons in the cervical spinal cord confirmed an overall reduced number of motor neurons in the ventral horn beginning at the “Wk stage” of the disease (Fig. 3 C and D).
Fig. 3.
Transgenic PFN1C71G mice display progressive motor neuron degeneration. (A) At the paralysis disease stage, PFN1C71G mice showed a significant microgliosis, astrogliosis, and motor neuron loss. All of the sections were isolated from the ventral horn in the lumbar spinal cord. (B) Quantification of motor neuron numbers in the lumbar spinal cord confirmed a significant motor neuron loss at the paralysis stage within the PFN1C71G mice. Each bar represents an average of three animals. (C) At the paralysis stage, cervical spinal cords of PFN1C71G mice display severe motor neuron loss. The sections were stained for ChAT and counterstained with hematoxylin. (D) Quantification of motor neuron numbers in the cervical spinal cord at different disease stages reveals a progressive loss in PFN1C71G mice. The age ranges for the PFN1C71G mice are as follows: 61–102 d for the presym stage, 132–154 d for the Wk stage, and 170–226 d for the par stage. The age range for the PFN1WT mice is 250–271 d and for the nTg mice is 138–250 d. Each bar represents an average from three to six mice. Error bars represent the SD. Student’s t test was used to compare all transgenic mice with nTg mice. **P < 0.01; ***P < 0.001. (Scale bar for A and C, 100 µm.)
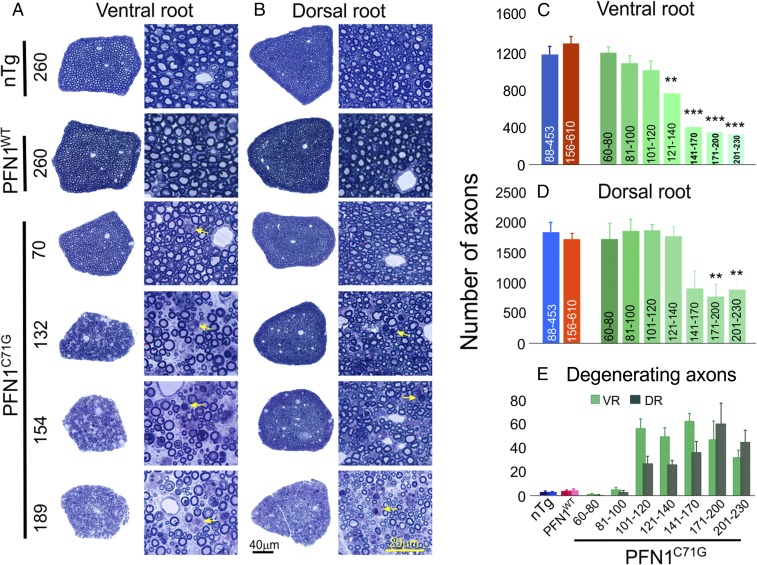
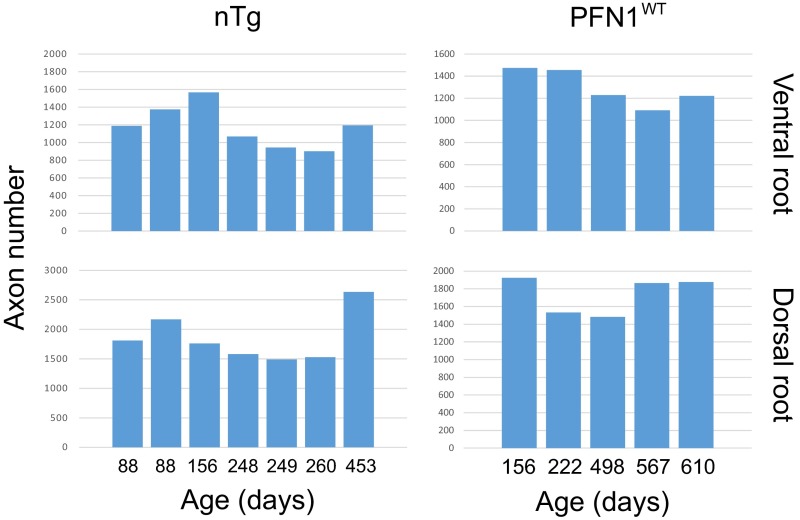
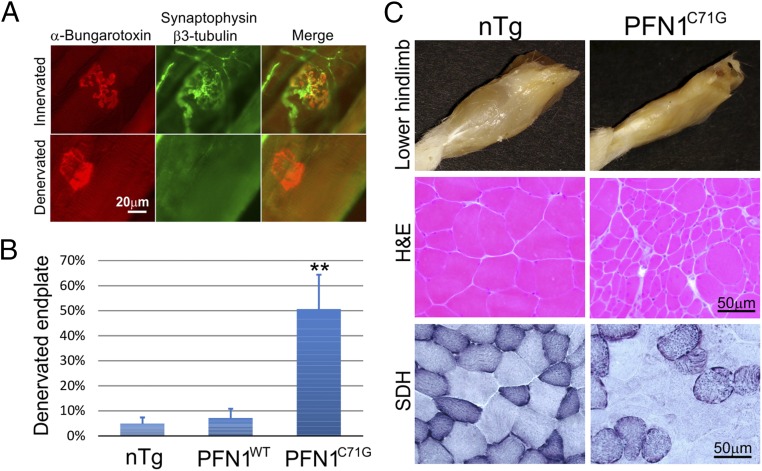
To determine whether a progressive motor neuron loss underlies the clinical phenotype, we quantified the axons in the spinal ventral roots from mice at different disease stages. At the presymptomatic (presym) stage (before 120 d of age), the axons were largely intact and the numbers were similar to the nTg and PFN1WT controls (Fig. 4 A and C). However, during the late period of the presym stage between 100 and 120 d, there was a marked increase in the number of degenerating axons (Fig. 4 A and E), although the overall intact axon numbers displayed only a modest decline relative to controls (Fig. 4C). Subsequently, as the weakness of the PFN1C71G mice progresses, the degenerating axons appear in the ventral root at a constant rate (Fig. 4 A and E), leading to a progressive loss of axons (Fig. 4C). In contrast, the nTg and PFN1WT mice display stable axon numbers during aging (Fig. S4). Consistent with the motor neuron degeneration, an increase in muscle denervation (Fig. 5 A and B), muscle atrophy, and fiber type grouping (Fig. 5C) was observed in PFN1C71G mice. These observations further demonstrate that motor neuron degeneration is late-onset and progressive, recapitulating the progression in human ALS patients.
Fig. 4.
Progressive loss of motor and sensory axons is observed in PFN1C71G mice but not in nTg and PFN1WT mice. (A and B) The cross-sections of the whole L5 ventral and dorsal roots at different ages (days) as well as an enlarged area from these roots are shown. The ventral root degeneration in PFN1C71G mice precedes the degeneration of dorsal root. Arrows indicate degenerating axons. (C and D) Quantification of L5 ventral and dorsal root axon numbers, respectively, is shown. The axon numbers in the ventral and dorsal root of nTg and PFN1WT mice are relatively constant at different ages (Fig. S4B) and thus are grouped together. The range of ages for each group is shown under each bar. Statistics and significance levels are the same as in Fig. 3. (E) Quantification of degenerating axons in ventral and dorsal root axons, respectively, is shown. Disease stages: <120 d, presym; 121–140 d, swk; 141–170 d, Wk; 171–200 d, Wk to ppar; and 201–230 d, par. The bars in C–E represent averages from three to nine mice. All error bars are SE.
Fig. S4.
The axon numbers in the L5 roots are stable throughout different ages in nTg and PFN1WT animals. Each bar represents the value from a single root.
Fig. 5.
Muscle denervation and atrophy are observed in the late stages (ppar and par) of PFN1C71G mice. (A) Examples of innervated and denervated endplates are shown. The images were taken from a paralyzed PFN1C71G mouse. (B) Quantification of muscle denervation in gastrocnemius muscle is shown. Sample sizes: nTg (n = 5); PFN1WT (n = 3); PFN1C71G (n = 4, two partially and two fully paralyzed). (C) Muscles are atrophic in late stages (partially and fully paralyzed) in PFN1C71G mice relative to age-comparable nTg mice. (Top) The muscle mass in the lower hindlimb is significantly diminished in the PFN1C71G mouse compared with the nTg mouse. These images are representative of >5 observations. (Middle) A cross section of gastrocnemius muscle reveals clustered atrophic fibers in a partially paralyzed PFN1C71G mouse, whereas the nTg mice display relatively uniform fiber sizes. (Bottom) Staining for succinate dehydrogenase (SDH) reveals clustering of SDH-strong and SDH-weak fibers in the PFN1C71G mice compared with a more interspersed distribution observed in the nTg mice.
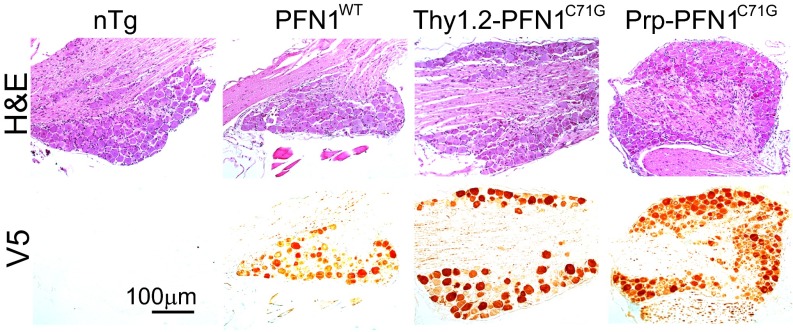
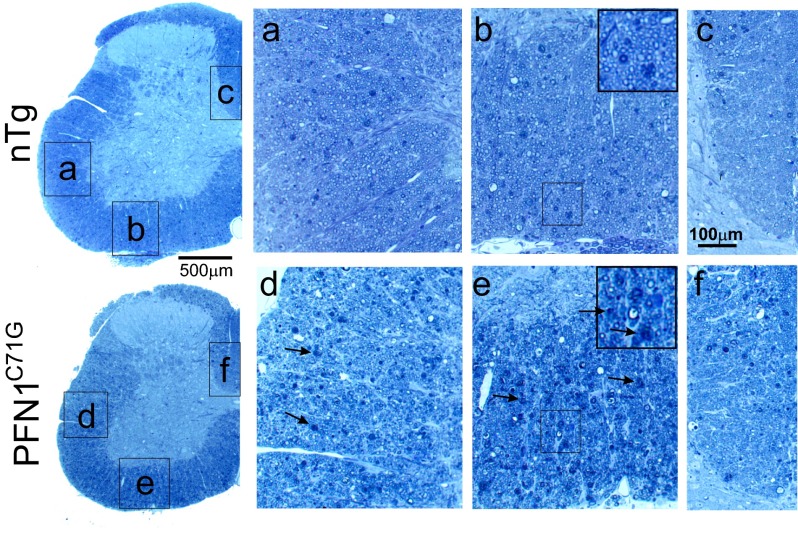
In addition to motor neuron degeneration, axon degeneration in the dorsal root was observed in PFN1C71G mice (Fig. 4 B and D). However, the progression of the dorsal root degeneration lagged behind the motor axons (Fig. 4). Not surprisingly, V5 staining revealed that mutant PFN1 was expressed in dorsal root ganglion (DRG) neurons in the parent lines of PFN1C71G mice (Fig. S5). Furthermore, there was an increased axon degeneration in white matter of the spinal cord (Fig. S6). The degeneration was mild in the lateral column (Fig. S6 A and D) but more severe in the ventral column (Fig. S6 B and E). The latter is likely associated with motor axon degeneration. Noticeably, however, there was little observable axon degeneration in the cortical spinal track (CST) in the dorsal column (Fig. S6 C and F).
Fig. S5.
PFN1 transgenes are expressed in DRG. Successive paraffin sections from DRG were stained with hematoxylin and eosin (Top) and V5 (Bottom).
Fig. S6.
Toluidine blue-stained spinal cord sections show various degrees of axon degeneration in the white matter. Compared with the control nTg mice, there is a modest axon degeneration in the lateral column (A and D) and a severe degeneration in the ventral column (B and E) but very few degenerating fibers in the dorsal column (C and F) that contain CST. Arrows point to examples of degenerating axons.
Survey of Neurodegeneration in Further Parts of the CNS.
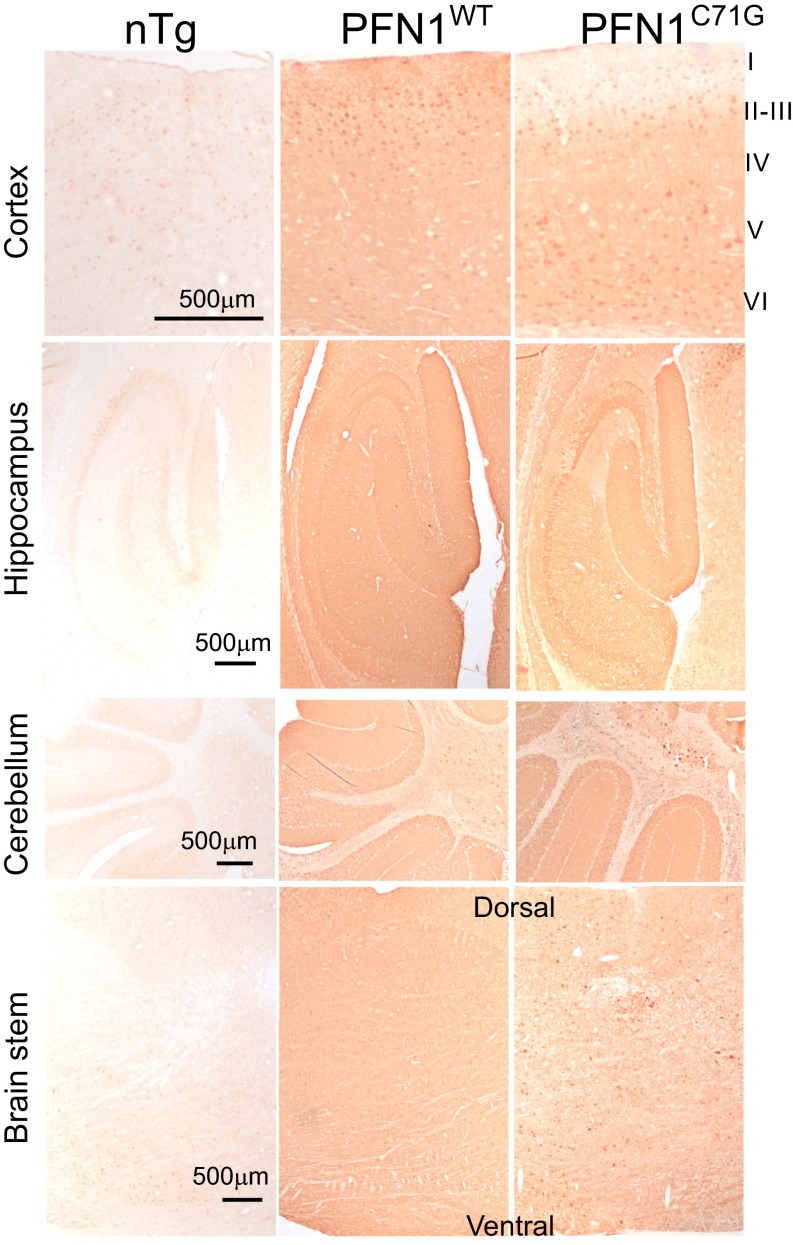
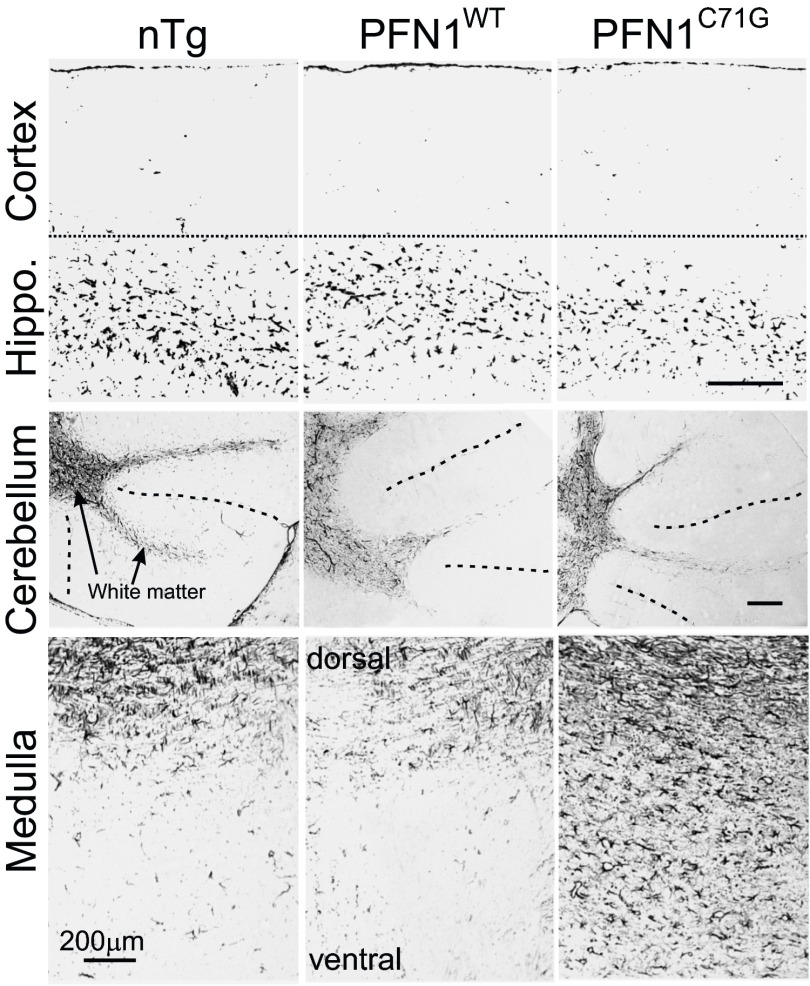
To determine whether neurodegeneration in further parts of CNS contribute to the clinical phenotypes of PFN1C71G mice, we characterized various areas of the brain. An overall very similar pattern of transgene expression was observed between PFN1WT and PFN1C71G mice. Both expressed their respective transgenes widely in the cerebral cortex, hippocampus, cerebellum, and brainstem (Fig. S7), but neither expressed the transgene in cerebellar Purkinje cells (Fig. S7). An obvious difference between the two mouse lines is that whereas PFN1WT mice expressed their transgene in the molecular layer of the cerebral cortex, PFN1C71G mice displayed little expression in this area (Fig. S7, cortex, layer I).
Fig. S7.
Mutant and wild-type PFN1 transgenes are broadly expressed in brains of the transgenic mice.
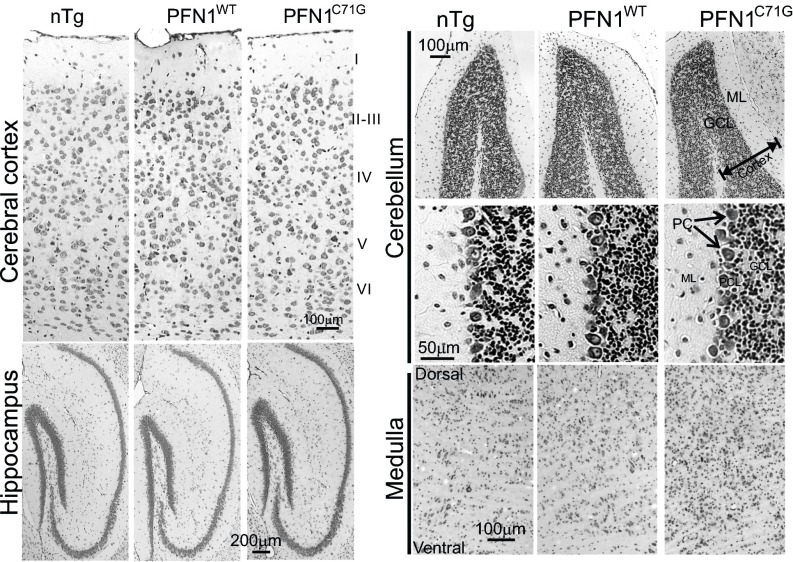
Cresyl violet staining of the PFN1WT and PFN1C71G mice did not reveal any obvious signs of neurodegeneration or neuronal loss in the cerebral cortex, hippocampus, and cerebellum (Fig. S8). However, PFN1C71G mice displayed increased cellulation in the medulla, suggesting neuroinflammation and neurodegeneration in this area (Fig. S8). To confirm these observations, we stained the brain for GFAP. We detected no obvious changes in the cortex, hippocampus, and cerebellum of PFN1C71G mice compared with nTg and PFN1WT mice (Fig. S9). However, a significant increase in GFAP staining in the medulla of the mutant mice was observed (Fig. S9), thus confirming the presence of neurodegeneration in this area. Overall, this evidence suggests that PFN1C71G mice develop neurodegeneration primarily in areas occupied by lower motor neurons.
Fig. S8.
Survey of neurodegeneration in the brain of mutant PFN1 mice. Nissl staining reveals no obvious difference in the cerebral and cerebellar cortices among nTg, PFN1WT, and PFN1C71G mice. However, an increased cellulation is observed in the medulla of PFN1C71G mice compared with nTg and PFN1WT mice. GCL, granule cell layer; ML, molecular layer; PC = Purkinje cell.
Fig. S9.
GFAP staining of the brains of PFN1 transgenic mice. Notice the levels of staining intensity are similar among nTg, PFN1WT, and PFN1C71G mice in the cortex, hippocampus, and cerebellum. However, in medulla the GFAP staining intensity is higher in the mutant than in the nTg and PFN1WT mice. The dotted lines in the cerebellar images indicate a boundary between folia. (Scale bar, 200 µm.)
Cytoskeleton Disorganization, Protein Aggregation, and Proteostress.
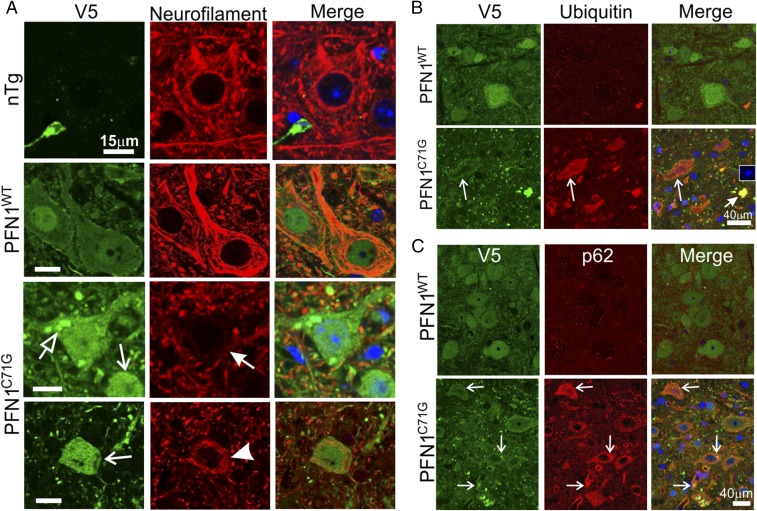
To determine whether PFN1C71G mice share the common cellular features of ALS (9, 10), we examined cytoskeletal disorganization, protein aggregation, and proteostasis disturbances (proteostress) by double immunofluorescence staining for V5 and various markers. Staining for V5 and neurofilaments revealed that motor neurons in nTg and PFN1WT mice contained filamentous networks that spread throughout the cell body and extended as bundles into neuronal processes (Fig. 6A). In contrast, in PFN1C71G mice, motor neurons with reduced expression of neurofilaments were observed (Fig. 6A, filled arrow). Additionally, a circular distribution of neurofilaments around the cell periphery and a lack of a well-spread filament network were observed in some motor neurons (Fig. 6A, arrowhead).
Fig. 6.
Cytoskeletal alterations and proteostress are observed in the motor neurons of PFN1C71G mice. (A) End stage lumbar spinal cord sections from PFN1C71G mice as well as age-matched nTg and PFN1WT mice were stained for V5 and neurofilament subunit L. The open arrow points to large PFN1 aggregates. The filled arrow points to a motor neuron with reduced neurofilaments. The barbed arrows point to neurons with small particulate aggregates. The arrowhead points to a neuron with circular neurofilament bundles around the cell periphery. (Scale bar, 15 µm.) (B) Altered ubiquitin staining is observed in the spinal cord of PFN1C71G mice. Lumbar spinal cord sections from end stage PFN1C71G mice and PFN1WT mice were stained for V5 and ubiquitin. Long arrows point to a motor neuron with a high level of ubiquitin. The short arrow points to a densely stained structure that contains DNA (Inset). This may represent the remnant of a collapsed cell. nTg is omitted from this figure, as it showed the same ubiquitin staining as the PFN1WT mice. (C) Changes in p62/SQSTM staining are observed in the spinal cord of PFN1C71G mice. Lumbar spinal cord sections from the end stage mutant mice and from age-matched PFN1WT mice were stained for V5 and p62/SQSTM. Arrows point to PFN1 aggregates that were colocalized with p62/SQSTM. nTg is omitted from this figure, as it showed the same p62 staining as the PFN1WT mice.
The distribution of the wild-type and mutant PFN1 protein also showed distinct differences. PFN1WT distribution was generally diffuse throughout both the nuclei and cytoplasm (Fig. 6A). In contrast, motor neurons in PFN1C71G mice displayed widespread small particulates in the cytoplasm and neuronal processes (Fig. 6A, barbed arrows). A small fraction of motor neurons (∼1–2%) also formed large aggregates (Fig. 6A, open arrow). Thus, similar to other ALS-associated mutant genes, such as SOD1, TDP-43, and FUS (11), the PFN1C71G mutation also leads to protein aggregation.
In neurodegeneration, the presence of protein aggregates is commonly associated with disturbances of proteasome and autophagy systems. To examine this in PFN1C71G mice, we stained spinal cord sections by double immunofluorescence using antibodies against V5 and ubiquitin. We observed similarly low staining intensity of ubiquitin in both nTg and PFN1WT mice (Fig. 6B). In contrast, strong ubiquitin staining was observed in motor neurons and some neuropils in PFN1C71G mice (Fig. 6B). The ubiquitin staining appeared in a widespread particulate pattern in motor neurons and overlapped with the particulates from the V5 staining (Fig. 6B, long arrows). Large spots, which were very brightly stained for both ubiquitin and V5, were often observed (Fig. 6B, short arrow). These appeared to be collapsed cells because DAPI-positive DNA was associated within these structures (Fig. 6B, Inset).
We also examined p62/SQSTM expression because it functions in autophagy and is often misregulated in ALS. Similar to ubiquitin, we observed low staining intensity of p62 in both nTg and PFN1WT mice (Fig. 6C). In contrast, p62 signal was elevated in the motor neurons of PFN1C71G mice (Fig. 6C). The p62 staining also appeared as small particulates throughout the cytoplasm of motor neurons. In some instances, intensely stained p62 spots were colocalized with the PFN1C71G aggregates (Fig. 6C, arrows). Taken together, these observations suggest that mutant PFN1 expression causes severe proteostress in motor neurons.
Protein Aggregates Are a Lagging Indicator of Neurodegeneration.
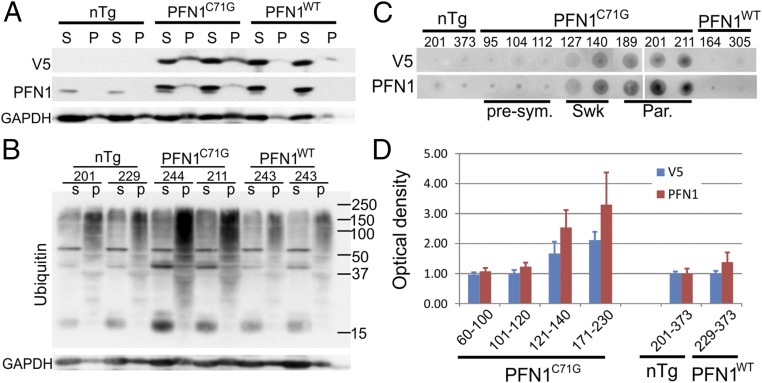
We further investigated the protein aggregation of PFN1C71G and its roles in motor neuron degeneration through centrifugation of spinal cord homogenates. Strong V5 signal was detected in the spinal cord pellets of PFN1C71G mice. In contrast, no signal was observed in the pellets from the nTg mice and only a very weak signal in the pellets from PFN1WT mice (Fig. 7A). In addition, we detected a dramatic increase in polyubiquitined, high-molecular weight protein species in the spinal cord pellets from end-stage PFN1C71G mice tissue but not from similarly aged control mice (Fig. 7B). To determine how protein aggregation evolved during the disease progression, we used a filter trap assay (Materials and Methods) to track changes in protein aggregates at different stages of the disease. PFN1C71G aggregates were clearly visible at day 127, during the swk stage and gradually accumulated along the disease progression peaking at the end stage (Fig. 7 C and D). In contrast, this accumulation of aggregates was absent in nTg and PFN1WT mice (Fig. 7 C and D). Surprisingly, compared with the onset and progression of motor axon degeneration (Fig. 4E), the accumulation of aggregation lags behind, especially at the early stage (101–120 d of age; compare Fig. 7D with Fig. 4E). This result suggests that the mutant PFN1 aggregates are not the initial trigger of motor neuron degeneration.
Fig. 7.
Aggregation of mutant PFN1 is observed in PFN1C71G mice. (A) Lumbar spinal cords from end-stage PFN1C71G mice and age-matched controls were subject to homogenization followed by centrifugation. Proteins in the soluble (S) and pellet (P) fractions were resolved by SDS/PAGE. PFN1 was detected in PFN1C71G mice but not in PFN1WT or nTg mice. (B) Soluble and pellet fractions of lumbar spinal cords were subject to Western blot analysis to detect ubiquitin. The high-molecule weight polyubiquitinated species were increased in PFN1C71G mice relative to PFN1WT and nTg mice. (C) Filter trapping assays were applied to spinal cord protein extracts from PFN1C71G mice at different disease stages to assess the level of protein aggregation. The numbers above the gel indicate the ages of the individual mouse. The abbreviations at the bottom indicate the disease stage: par, paralysis; presym, presymptomatic; swk, slightly weak. (D) The optical density of the dot blots shown in C were quantified and plotted. The bars represent the average of 3–5 mice normalized to the average of the nTg mice. The numbers below the bars indicate range of ages for the mice. Error bars are SD.
Discussion
We report that expression of ALS-associated mutant PFN1 in mice caused relentless progression of motor neuron loss, a cardinal feature of ALS (Figs. 3 and 4). Concomitant with the motor neuron loss was a progressive motor weakness ending in paralysis and death (Fig. 2) and skeletal muscle denervation and atrophy (Fig. 5). Furthermore, we show that expression of mutant PFN1 caused protein aggregation (Figs. 6 and 7) disruption of the neurofilament network and an increase in ubiquitin and p62/SQSTM levels in motor neurons (Fig. 6) similar to the human ALS pathology (12–16). These results establish a progressive disease model for ALS. To our knowledge, the only other transgenic mouse model that shares these features is the transgenic mice that express mutant SOD1 (17).
It is unlikely that the ALS phenotype of this model is caused by gene disruption from the insertion of the transgene rather than from the transgene expression because the former would require the transgene, by a random chance, to be inserted in a gene whose heterozygous loss-of-function leads to the phenotype as shown in Thy1.2-PFN1C71G mice. Additionally, this possibility would require that the phenotype be modifiable by another independently constructed line, Prp-PFN1C71G, in a manner that is consistent with the enhanced ALS phenotype shown by double hemizygous and triple transgenic PFN1C71G mice. Given these considerations, the simplest interpretation of our results is that the expression of the mutant PFN1, rather than a disruption of an unknown gene by the transgene insertion, is the cause for the ALS phenotype observed in this model.
Despite a dramatic increase in the number of causal genes identified and numerous attempts at expressing these genes in mice to model the disease in recent years, the only widely used mammalian model for ALS research remains to be the mice expressing the mutant SOD1 gene, a model generated more than two decades ago (17–20). This situation underscores the difficulty in constructing mammalian models that closely approximate the key features of ALS, namely the late-onset, progressive loss of motor neurons leading to clinical progression from motor weakness and paralysis to death. The lack of mammalian models alternative to the mutant SOD1 model has hindered the understanding of how the disease develops, particularly at the early disease stages. Furthermore, this has prevented verification and generalization of the findings from the mutant SOD1 models with regard to the mechanism of motor neuron degeneration and therapeutic strategies. The progression of motor neuron loss with concomitant progressive muscle weakness ending in paralysis and death of our mutant PFN1 model fills this gap.
In both PFN1 and SOD1 models, only the mutant, but not the wild type, causes motor neuron degeneration when expressed at comparable levels. Furthermore, for both models, the disease severity is correlated with the mutant expression levels (Figs. 1 B and C and 2B) (18, 19). Higher expression of mutant protein results in a more severe disease phenotype and shorter lifespan of the mice. These characteristics are consistent with a gain-of-function type of gene toxicity, which has been well established for mutant SOD1 (21). However, in the case of PFN1, we cannot yet rule out the possibility that mutant PFN1 causes toxicity by a dominant-negative mechanism, whereby the mutant inhibits endogenous PFN1 function. Because PFN1 function is essential for cells (4), a compromised PFN1 function in neurons could lead to their demise. Further experiments will be required to differentiate between the gain of novel toxicity and dominant-negative inhibition of the PFN1 function.
In neuropathology, the most striking similarity between the mutant PFN1 and mutant SOD1 models is the relentless progression of motor neuron degeneration. In both mice, the degeneration is late-onset, begins in mature animals and progresses to >50% loss of motor neurons at the paralysis stage (Figs. 3 and 4) (22). Cytoskeletal disturbances, mutant protein aggregates, and ubiquitin and p62 positivity are also common features in both models and human ALS (Figs. 5–7) (10, 16, 23–25). Given that both mutant proteins are unstable and prone to unfold, misfold, and aggregate and that both activate protein quality control systems in vivo (Figs. 5–7) (5, 11, 26), our results suggest that these mutants cause toxicity, in part, by overwhelming the cellular protein quality control system, thereby disrupting proteostasis on which cellular functions rely.
Further research will be required to fully understand the shared common mechanisms as well as distinct characteristics of these two mutant genes. Two decades of research have accumulated a wealth of data regarding the effects of mutant SOD1 on motor neurons. Numerous mechanisms are proposed for the mutant SOD1 to drive motor neuron degeneration, including mitochondrial damage, oxidative stress, chaperon dysfunction, impaired axonal transport, Golgi and ER stress, glial cell toxicity, excitotoxicity, neuroinflammation, apoptosis, necroptosis, and others (27). Establishing which of these processes are contributing to the mutant PFN1 toxicity remains to be further investigated.
In addition to motor neuron degeneration, we also observed degeneration of DRG neurons (Fig. 4), likely caused by the mutant PFN1 expression in DRG neurons (Fig. S5). This observation indicates that mutant PFN1 toxicity is not specific to motor neurons and suggests that neurons are at risk for degeneration as long as they express sufficiently high levels of the mutant gene. The nonneuron type-specific mutant toxicity is common to gene mutations as demonstrated in a vast variety of model systems as well as in patients. For example, mutant SOD1 toxicity has been shown in neurons outside of the primary motor system in the dorsal root ganglia, midbrain, and brainstem (28–31). Likewise, neurodegeneration has been shown to occur in nonmotor neuron cell populations including DRG neurons in ALS patients, albeit the degeneration develops later than motor neurons during the disease progression (32). Thus, our observation that the motor neurons degenerate more rapidly than the DRG neurons in the PFN1 mutant mice (Fig. 4) is consistent with the notion that motor neurons are more vulnerable than other types of neurons in ALS.
A common feature of the mutants associated with neurodegeneration is a heightened propensity for protein unfolding, misfolding, and aggregation (11). However, the question of whether protein aggregation is toxic or benign or even protective has not been settled (33). Although many studies associate protein aggregation with neurodegeneration (34, 35), recent studies suggest that protein aggregation is neuroprotective (36–38). In this study, we took advantage of the progressive in vivo model and examined the accumulation of protein aggregates along the disease progression. The results demonstrate that protein aggregation lags behind motor neuron neurodegeneration (compare Fig. 4E with Fig. 7 C and D). Whereas neurodegeneration accelerated early at the disease onset (Fig. 4E, 101–120 d of age), protein aggregation was not detectable (Fig. 7 C and D, 101–120 d of age). The peak accumulation of protein aggregation occurred at the end stage (Fig. 7 C and D). However, by this disease stage, the motor axon degeneration began to diminish, most likely due to the exhaustion of surviving axons (Fig. 4E). These data demonstrate that protein aggregation is a lagging indicator of motor neuron degeneration and therefore probably not the initial trigger of motor neuron degeneration.
In summary, we have constructed a mammalian model for ALS by expressing mutant PFN1. This model replicates the key features of ALS including adult-onset, progressive motor neuron loss accompanied with progressive motor weakness ending in paralysis and death. Additionally, this model shares many other features with human ALS and with mouse models expressing mutant SOD1, including protein aggregation, cytoskeletal disruption, and accumulation of ubiquitin and p62. Finally, by examining the timing of motor neuron degeneration and protein aggregation during the disease progression, we demonstrate that protein aggregation is a lagging indicator of motor neuron degeneration. These results establish an in vivo model for ALS, which can be used to test mechanistic and therapeutic hypotheses.
Materials and Methods
Transgenic Mice.
The cDNAs encoding human PFN1C71G and PFN1WT with N-terminal V5 tag were cloned into the XhoI site of the MoPrp.Xho plasmid (ATCC#JHU-2) or mouse thy1.2 plasmid (gift from Joshua Sanes, Harvard University, Cambridge, MA; Addgene plasmid 20736). After sequence verification and tests in cultured cells, the Prp-V5-PFN1 and Thy1-V5-PFN1 constructs were linearized by digestion using PvuI with either Not1 or EcoRI, respectively. The linearized plasmids were used to make the transgenic mice by pronuclear injection into embryos from the FVB/NJ strain. The founder mice were screened by PCR using the forward (GTAAGCCTATCCCTAACCCT) and reverse (TTGAAAGAGCTACAGGTGGA) primers for Prp-V5-PFN1 or forward (CGACGCGTACCGGTTTCGAA) and reverse (ACAGTGACATTGAAGGTG) primers for Thy1.2-V5-PFN1. The positive founders where bred with wild-type FVB/NJ mice and the offspring were killed to determine their expression of the transgene. The lines were terminated if 3–5 animals from the line showed no detectable transgene expression. The lines with the highest expression were maintained by breeding with wild-type FVB/NJ mice.
By the above screening, one Prp-PFN1C71G line, one Thy1.2-PFN1C71G line, and two Prp-PFN1WT lines were obtained, all of which expressed higher levels than the mouse endogenous PFN1 level. To generate mice with various levels of mutant PFN1, the mutant lines were intercrossed to generate homozygotes. Efforts to generate the Prp-PFN1C71G homozygotes failed, but those for Thy1.2-PFN1C71G homozygotes succeeded. By further crossing with the Prp-PFN1C71G hemizygous line, triple transgenic mice with Thy1.2-PFN1C71G homozygous and Prp-PFN1C71G hemizygous genotype were obtained. These mice were maintained by crossing the male triple transgenic mice with female Thy1.2-PFN1C71G homozygous mice. The PFN1C71G triple transgenic mice are available from The Jackson Laboratory as FVB-Tg(Prnp-PFN1*C71G)#Zxu Tg(THY1-PFN1*C71G)#Zxu/J, Stock No. 028608. A line of wild-type PFN1 transgenic mice are available as FVB-Tg(Prnp-PFN1)34Zxu/J, Stock No. 017934. In all experiments, nTg controls were similarly aged littermates of Thy1.2-PFN1C71G, Prp-PFN1C71G, Thy1.2/Prp-PFN1C71G, or PNF1WT.
Behavioral Analysis.
All of the behavioral experiments were approved by the University of Massachusetts Medical School Institutional Animal Care and Use Committee and conducted according to the University policies and procedures regulating the use of animals in research and the provisions of the Guide for the Care and Use of Laboratory Animals (39).
Home cage observation.
Mice were observed daily during the weekdays for their general health and motor behavior. The disease stages were assigned as follows: presympt, swk, Wk, ppar, and par. At the presympt stage, the motor behavior was indistinguishable with the nTg mice. At the swk stage, the mice showed a slight foot dragging in their gait. At the Wk stage, the foot dragging became readily observable and the movement became noticeably slowed. At the ppar stage, one limb became paralyzed, whereas other limbs were still functioning although weak. The animal could still move but with serious difficulty. At the par stage, two or more limbs became paralyzed and the mouse was incapable of locomotion. The par stage was the endpoint of the experiment, and the mouse was killed for tissue harvesting.
Grip strength.
Transgenic animals and age-matched controls were tested for grip strength of four limbs using a force meter (Columbus Instruments) at different time points. Mice were allowed to grasp on a wire grid with their four paws and were then gently pulled back with steady force until they were unable to hold on to the grid. Peak tension was recorded for each of the five consecutive trials, and the best performance was recorded as the grip strength on the trial day.
Accelerating rotorod.
Mice were tested for time on an accelerating rotorod (linear ramp from 12 rpm to 72 rpm in 5 min) at different ages. Three trials were administered in each test. Mice were allowed to have at least 10 min rest between the trials. The best performance among the three trials was recorded as the performance at each age point.
HomeCageScan.
The HomeCageScan system (Clever Systems) was used to continuously monitor mice behavior in their home cage. A single mouse was housed in polycarbonate cages with minimal bedding (about 200 mL). A digital video camera was mounted on one side of the wall. Each mouse was recorded for 24 h, with 12 h daylight and 12 h dim red light, and then returned to its cage with its littermates. Video data were analyzed by HomeCageScan software to quantify verticals, measuring rearing up, jumping, and hanging on the cage top and coming down.
Immunoblotting.
Mice under deep anesthesia were decapitated. Tissues were quickly harvested, snap-frozen in liquid N2, and stored at –80 °C. For protein preparation, frozen tissues were homogenized in a homogenization solution [25 mM phosphate pH 7.2, 1 mM EGTA, 1% (wt/vol) SDS, 0.05% (vol/vol) Triton X-100, protease inhibitor mixture; Thermo Scientific] and heated at 95 °C for 5 min. After clearing by centrifugation, the protein concentration was measured using BCA assay (Pierce). The samples were heated in Laemmli buffer, and equal amounts of protein were loaded and resolved by SDS/PAGE. After transfer to nitrocellulose membranes, blots were blocked with 5% (wt/vol) nonfat dry milk in PBST [0.25% (vol/vol) Triton X-100 in PBS, pH 7.4] for 1 h followed by incubation with primary antibodies overnight at 4 °C. Blots were then incubated with horseradish peroxidase–linked secondary antibodies to rabbit or mouse (GE Healthcare) in PBST with 5% (wt/vol) dry milk for 1 h at room temperature (RT). The source of primary antibodies and dilutions were as follows: GAPDH (Sigma, G9545, 1:10000), PFN1 (Sigma, P7749, 1:1,000), Ubiquitin (Chemicon/Millipore, #05–944, 1:2,000), and V5 (Bethyl Laboratories, A190-119A, 1:1,000). Membranes were washed three times and proteins were visualized using ECL (Pierce) reagent and detected by the LAS-3000 imaging system (Fujifilm).
Sedimentation and Filter Trap Assays.
For the sedimentation assays, mouse lumbar spinal cords were homogenized using a handheld polytron for 20 s in lysis buffer [50 mM Tris·HCl, 150 mM NaCl, 1% (vol/vol) Triton X-100, 5 mM EDTA] with proteinase inhibitor mixture (1:100 dilution, P 8340; Sigma). The homogenates were centrifuged at 12,000 × g at 4 °C for 5 min. The pellets were rinsed three times with the lysis buffer and resuspended by homogenization using a handheld polytron. The homogenates were centrifuged at 12,000 × g at 4 °C for 5 min, and the pellets were resuspended in 1× Laemmli buffer (one-fifth of the original lysis buffer volume). The protein concentration was determined in the supernatants using BCA method (Pierce). Twenty micrograms of protein from the supernatant were mixed with 2× Laemmli buffer. The supernatant sample and an equivalent volume of pellet sample were heated at 95 °C for 5 min, cleared by centrifugation, and then resolved by SDS/PAGE. The gel was then immunoblotted as described above.
For the filter trap assay, the spinal cord homogenates that were prepared in the lysis buffer as described above were assayed for their protein concentration. Two hundred and fifty micrograms of protein were diluted with 10 volumes of PBS (pH 7.4) containing 1% (wt/vol) SDS. The solution was sonicated (70 W, 50% output, 30 s) and then filtered under vacuum through acetate membranes (0.2 mm pore size; Schleicher and Schuell) using a 96-well dot-blot apparatus (Bio-Rad). Each well was washed twice with PBS and the proteins on the membranes were detected by V5 or PFN1 antibodies by immunoblotting as described above. The staining intensity was quantified using ImageJ software (National Institutes of Health), and the intensity ratios between the transgenic mice and nTg mice were then calculated. The value for each group was the average from three to five animals.
Immunofluorescence and Immunohistochemistry.
Mice under deep anesthesia were transcardially perfused with cold PBS followed by 4% (wt/vol) paraformaldehyde in PBS. The perfused mice were then immersed in the same fixative at 4 °C for another 24–48 h. After fixation, tissues were immersed in PBS containing 30% (wt/vol) sucrose at 4 °C for 2–3 d. Tissues were then frozen in optimal cutting temperature (OCT) freezing media (Sakura) and stored at –20 °C. Frozen sections were cut at 20 µm using a cryostat. For immunostaining, sections were incubated in the blocking solution [5% (vol/vol) normal serum in PBS, pH 7.4] for 1 h at RT and then incubated with a primary antibody in the blocking solution overnight at 4 °C. The dilutions and sources of primary antibodies were as follows: V5-tag (Novus, NB100-62264, 1:500 or Bethyl Laboratories, A190-119A, 1:200), GFAP (Abcam Ab7260, 1:1,000), IBA1 (BioCare Medical CP290AB, 1:200), ChAT (Millipore, AB1044P, 1:200), neurofilament L (Cell Signaling, C28E10, 1:100), P62 (BD Biosciences, #610832, 1:250), and Ubiquitin (Chemicon/Millipore, #05–944, 1:2,000). Sections were then washed three times for 5 min each and incubated in the appropriate secondary antibody at RT for 90 min. For immunofluorescence, the sections were washed three times in PBS for 5 min each and mounted with Vectashield mounting medium containing DAPI (Vector Laboratories) and sealed with nail polish. Images of the brain and spinal cord sections were taken with a Nikon Eclipse Ti Widefield florescence microscope equipped with a Retiga-2000RV cooled-CCD camera or a confocal microscope (Leica).
For quantification of V5 signal intensity in motor neurons, sections were doubly stained for the V5 epitope tag and ChAT. After staining, the cells were visualized and photographed using a confocal microscope. The cells in the cortex or ventral horn of the spinal cord were measured for their fluorescence intensity using the Nikon NIS Elements software. For each cell, the average fluorescence intensity was calculated. Cells from at least five different sections from each mouse for three or more mice per genotype were measured.
For immunohistochemistry, sections were washed three times in PBS containing 0.25% (vol/vol) Tween 20 and then stained following the manufacturer’s instructions for Vectastain ABC kit, Elite PK-6100 standard ImmPact tm DAB peroxidase Substrate kit SK-4105 (Vector Lab). The sections were then mounted on slides and dried overnight at 55 °C. After soaking in Xylene twice for 2 min each, the slides were sealed with Permount (Vector Lab).
Visualization and Quantification of Neurodegeneration.
For visualization of ventral root axons, mice were fixed by transcardial perfusion using 4% (wt/vol) paraformaldehyde and 2.5% (wt/vol) glutaraldehyde in 0.1 M sodium cachodylate (pH 7.6). Tissues were further fixed by soaking in the same fixative at 4 °C for 24 h. L5 roots attached to dorsal root ganglia were dissected and postfixed with 2% (wt/vol) osmium tetroxide in 0.1 M sodium cachodylate (pH 7.6), dehydrated in a graded ethanol series, and embedded in Epon-Araldite resin. Sections of 1 μm were stained with toluidine blue and examined and photographed by light microscopy.
For quantification of ventral horn motor neurons, lumbar enlargement of the fixed spinal cords was sectioned on a cryostat at 20 µm thickness. Every other section was collected until a total of 10 or more sections were collected from each spinal cord. The sections were stained with goat anti-ChAT antibody at 4 °C overnight. A secondary donkey anti-goat biotinylated antibody and a Vectastain ABC and DAB peroxidase Substrate kit (Vector Lab) were used to reveal motor neurons. Images of the spinal cord sections were taken using a Nikon microscope, and motor neuron numbers in the ventral horn region were counted manually from each section.
For muscle histology, fresh specimen isolated from gastrocnemius muscle was inserted vertically ∼two-thirds into ice-chilled 10% (wt/vol) gum tragacanth in a small plastic container, which was maintained on ice for 10–20 min. The specimen was then frozen by immersing into liquid nitrogen (with both muscle and gum tragacanth together) for about 10 s and then stored at –80 °C. The frozen tissue was sectioned using a cryostat and stained with Hematoxylin & Eosin (H&E). For SDH staining, the frozen muscle sections were incubated in SDH incubation medium [0.1 M Sodium Succinate, 0.1 M phosphate buffer (pH 7.6), 0.1% Nitro-Blue Tetrazolium) for 1 h at 37C, washed with water for ∼1 min, and mounted in glycerin with coverslips.
Visualization and Quantification of Neuromuscular Junctions.
Animals are euthanized via an overdose of isoflurane and then transcardially perfused with PBS for 2 min followed by 4% (wt/vol) paraformaldehyde for 5 min. Gastrocnemius muscles were dissected out and placed in 1.5% (wt/vol) paraformaldehyde for 24 h at 4 °C. The muscles were then washed with PBS for 30 min at 4 °C and placed in 25% (wt/vol) sucrose overnight at 4 °C. Muscles were embedded in OCT medium, frozen rapidly, and stored at –80 °C. Sections were cut at 35 μm thickness using a Leica Cryostat, placed on Superfrost Plus slides, and stored at –80 °C. Slides were allowed to defrost for 30 min before use. Slides were washed three times with PBS for 5 min and then three times with 0.4% (vol/vol) Triton X-100 for 5 min. Sections were blocked using 10% (vol/vol) donkey serum in PBS for 3.5 h at RT. A primary antibody solution of rabbit anti-synaptophysin (ThermoFisher, 1:1,000) and rabbit anti-Neuronal class III Beta-Tubulin (Biolegend, 1:1,000) diluted in blocking solution was applied for 24 h at 4 °C. Slides were washed again with PBS. A secondary antibody solution of Alexa488nm–labeled Donkey anti-rabbit (ThermoFisher, 1:500) and Alexa-555nm α-Bungarotoxin (ThermoFisher, 1:500) diluted in PBS was applied overnight at 4 °C in the dark. Slides were imaged on a Nikon microscope. Neuromuscular junctions were then counted and quantified as innervated or denervated based on nerve occupancy of the endplates. Those with >50% occupancy were counted as innervated and those with <50% were counted as denervated.
Supplementary Material
Acknowledgments
We are grateful to Ms. Monika Chitre and Ms. Hongru Zhou, University of Massachusetts Medical School Transgenic Animal Modeling Core and Electron Microscopy Facility, for their excellent technical assistance. This work was supported by grants from the ALS Alliance, National Institute of Health (1R21NS076991 and 1R21NS092127), and the Robert Packard Center for ALS Research at Johns Hopkins (to Z.X. and J.E.L.); the ALS Association (Z.X.); and Target ALS (J.E.L.).
Footnotes
The authors declare no conflict of interest.
This article is a PNAS Direct Submission.
This article contains supporting information online at www.pnas.org/lookup/suppl/doi:10.1073/pnas.1605964113/-/DCSupplemental.
References
- 1.Rowland LP, Shneider NA. Amyotrophic lateral sclerosis. N Engl J Med. 2001;344(22):1688–1700. doi: 10.1056/NEJM200105313442207. [DOI] [PubMed] [Google Scholar]
- 2.Smith BN, et al. Novel mutations support a role for Profilin 1 in the pathogenesis of ALS. Neurobiol Aging. 2015;36(3):1602.e1617–1602.1627. doi: 10.1016/j.neurobiolaging.2014.10.032. [DOI] [PMC free article] [PubMed] [Google Scholar]
- 3.Wu CH, et al. Mutations in the profilin 1 gene cause familial amyotrophic lateral sclerosis. Nature. 2012;488(7412):499–503. doi: 10.1038/nature11280. [DOI] [PMC free article] [PubMed] [Google Scholar]
- 4.Witke W. The role of profilin complexes in cell motility and other cellular processes. Trends Cell Biol. 2004;14(8):461–469. doi: 10.1016/j.tcb.2004.07.003. [DOI] [PubMed] [Google Scholar]
- 5.Boopathy S, et al. Structural basis for mutation-induced destabilization of profilin 1 in ALS. Proc Natl Acad Sci USA. 2015;112(26):7984–7989. doi: 10.1073/pnas.1424108112. [DOI] [PMC free article] [PubMed] [Google Scholar]
- 6.Figley MD, Bieri G, Kolaitis RM, Taylor JP, Gitler AD. Profilin 1 associates with stress granules and ALS-linked mutations alter stress granule dynamics. J Neurosci. 2014;34(24):8083–8097. doi: 10.1523/JNEUROSCI.0543-14.2014. [DOI] [PMC free article] [PubMed] [Google Scholar]
- 7.Tebbenkamp AT, Swing D, Tessarollo L, Borchelt DR. Premature death and neurologic abnormalities in transgenic mice expressing a mutant huntingtin exon-2 fragment. Hum Mol Genet. 2011;20(8):1633–1642. doi: 10.1093/hmg/ddr040. [DOI] [PMC free article] [PubMed] [Google Scholar]
- 8.Wang J, et al. Coincident thresholds of mutant protein for paralytic disease and protein aggregation caused by restrictively expressed superoxide dismutase cDNA. Neurobiol Dis. 2005;20(3):943–952. doi: 10.1016/j.nbd.2005.06.005. [DOI] [PubMed] [Google Scholar]
- 9.Balch WE, Morimoto RI, Dillin A, Kelly JW. Adapting proteostasis for disease intervention. Science. 2008;319(5865):916–919. doi: 10.1126/science.1141448. [DOI] [PubMed] [Google Scholar]
- 10.Peters OM, Ghasemi M, Brown RH., Jr Emerging mechanisms of molecular pathology in ALS. J Clin Invest. 2015;125(5):1767–1779. doi: 10.1172/JCI71601. [DOI] [PMC free article] [PubMed] [Google Scholar]
- 11.Mulligan VK, Chakrabartty A. Protein misfolding in the late-onset neurodegenerative diseases: Common themes and the unique case of amyotrophic lateral sclerosis. Proteins. 2013;81(8):1285–1303. doi: 10.1002/prot.24285. [DOI] [PubMed] [Google Scholar]
- 12.Leigh PN, et al. Ubiquitin deposits in anterior horn cells in motor neurone disease. Neurosci Lett. 1988;93(2-3):197–203. doi: 10.1016/0304-3940(88)90081-x. [DOI] [PubMed] [Google Scholar]
- 13.Lowe J, et al. A filamentous inclusion body within anterior horn neurones in motor neurone disease defined by immunocytochemical localisation of ubiquitin. Neurosci Lett. 1988;94(1-2):203–210. doi: 10.1016/0304-3940(88)90296-0. [DOI] [PubMed] [Google Scholar]
- 14.Bergeron C, et al. Neurofilament light and polyadenylated mRNA levels are decreased in amyotrophic lateral sclerosis motor neurons. J Neuropathol Exp Neurol. 1994;53(3):221–230. doi: 10.1097/00005072-199405000-00002. [DOI] [PubMed] [Google Scholar]
- 15.Strong MJ. Neurofilament metabolism in sporadic amyotrophic lateral sclerosis. J Neurol Sci. 1999;169(1-2):170–177. doi: 10.1016/s0022-510x(99)00241-5. [DOI] [PubMed] [Google Scholar]
- 16.Mizuno Y, et al. Immunoreactivities of p62, an ubiqutin-binding protein, in the spinal anterior horn cells of patients with amyotrophic lateral sclerosis. J Neurol Sci. 2006;249(1):13–18. doi: 10.1016/j.jns.2006.05.060. [DOI] [PubMed] [Google Scholar]
- 17.Philips T, Rothstein JD. Rodent models of amyotrophic lateral sclerosis. Curr Protoc Pharmacol. 2015;69:5.67.1–5.67.21. doi: 10.1002/0471141755.ph0567s69. [DOI] [PMC free article] [PubMed] [Google Scholar]
- 18.Gurney ME, et al. Motor neuron degeneration in mice that express a human Cu,Zn superoxide dismutase mutation. Science. 1994;264(5166):1772–1775. doi: 10.1126/science.8209258. [DOI] [PubMed] [Google Scholar]
- 19.Wong PC, et al. An adverse property of a familial ALS-linked SOD1 mutation causes motor neuron disease characterized by vacuolar degeneration of mitochondria. Neuron. 1995;14(6):1105–1116. doi: 10.1016/0896-6273(95)90259-7. [DOI] [PubMed] [Google Scholar]
- 20.Ripps ME, Huntley GW, Hof PR, Morrison JH, Gordon JW. Transgenic mice expressing an altered murine superoxide dismutase gene provide an animal model of amyotrophic lateral sclerosis. Proc Natl Acad Sci USA. 1995;92(3):689–693. doi: 10.1073/pnas.92.3.689. [DOI] [PMC free article] [PubMed] [Google Scholar]
- 21.Xu Z. Mechanism and treatment of motoneuron degeneration in ALS: What have SOD1 mutants told us? Amyotroph Lateral Scler Other Motor Neuron Disord. 2000;1(4):225–234. doi: 10.1080/14660820050515052. [DOI] [PubMed] [Google Scholar]
- 22.Kong J, Xu Z. Massive mitochondrial degeneration in motor neurons triggers the onset of amyotrophic lateral sclerosis in mice expressing a mutant SOD1. J Neurosci. 1998;18(9):3241–3250. doi: 10.1523/JNEUROSCI.18-09-03241.1998. [DOI] [PMC free article] [PubMed] [Google Scholar]
- 23.Dal Canto MC, Gurney ME. A low expressor line of transgenic mice carrying a mutant human Cu,Zn superoxide dismutase (SOD1) gene develops pathological changes that most closely resemble those in human amyotrophic lateral sclerosis. Acta Neuropathol. 1997;93(6):537–550. doi: 10.1007/s004010050650. [DOI] [PubMed] [Google Scholar]
- 24.Watanabe M, et al. Histological evidence of protein aggregation in mutant SOD1 transgenic mice and in amyotrophic lateral sclerosis neural tissues. Neurobiol Dis. 2001;8(6):933–941. doi: 10.1006/nbdi.2001.0443. [DOI] [PubMed] [Google Scholar]
- 25.Gal J, Ström AL, Kilty R, Zhang F, Zhu H. p62 accumulates and enhances aggregate formation in model systems of familial amyotrophic lateral sclerosis. J Biol Chem. 2007;282(15):11068–11077. doi: 10.1074/jbc.M608787200. [DOI] [PubMed] [Google Scholar]
- 26.Borchelt DR, et al. Superoxide dismutase 1 subunits with mutations linked to familial amyotrophic lateral sclerosis do not affect wild-type subunit function. J Biol Chem. 1995;270(7):3234–3238. doi: 10.1074/jbc.270.7.3234. [DOI] [PubMed] [Google Scholar]
- 27.Hayashi Y, Homma K, Ichijo H. SOD1 in neurotoxicity and its controversial roles in SOD1 mutation-negative ALS. Adv Biol Regul. 2016;60:95–104. doi: 10.1016/j.jbior.2015.10.006. [DOI] [PubMed] [Google Scholar]
- 28.Guo YS, et al. Sensory involvement in the SOD1-G93A mouse model of amyotrophic lateral sclerosis. Exp Mol Med. 2009;41(3):140–150. doi: 10.3858/emm.2009.41.3.017. [DOI] [PMC free article] [PubMed] [Google Scholar]
- 29.Sábado J, et al. Accumulation of misfolded SOD1 in dorsal root ganglion degenerating proprioceptive sensory neurons of transgenic mice with amyotrophic lateral sclerosis. BioMed Res Int. 2014;2014:852163. doi: 10.1155/2014/852163. [DOI] [PMC free article] [PubMed] [Google Scholar]
- 30.Kostic V, et al. Midbrain dopaminergic neuronal degeneration in a transgenic mouse model of familial amyotrophic lateral sclerosis. Ann Neurol. 1997;41(4):497–504. doi: 10.1002/ana.410410413. [DOI] [PubMed] [Google Scholar]
- 31.An T, et al. Oxidative stress and autophagic alteration in brainstem of SOD1-G93A mouse model of ALS. Mol Neurobiol. 2014;49(3):1435–1448. doi: 10.1007/s12035-013-8623-3. [DOI] [PubMed] [Google Scholar]
- 32.Swinnen B, Robberecht W. The phenotypic variability of amyotrophic lateral sclerosis. Nat Rev Neurol. 2014;10(11):661–670. doi: 10.1038/nrneurol.2014.184. [DOI] [PubMed] [Google Scholar]
- 33.Treusch S, Cyr DM, Lindquist S. Amyloid deposits: Protection against toxic protein species? Cell Cycle. 2009;8(11):1668–1674. doi: 10.4161/cc.8.11.8503. [DOI] [PMC free article] [PubMed] [Google Scholar]
- 34.Taylor JP, Hardy J, Fischbeck KH. Toxic proteins in neurodegenerative disease. Science. 2002;296(5575):1991–1995. doi: 10.1126/science.1067122. [DOI] [PubMed] [Google Scholar]
- 35.Lansbury PT, Lashuel HA. A century-old debate on protein aggregation and neurodegeneration enters the clinic. Nature. 2006;443(7113):774–779. doi: 10.1038/nature05290. [DOI] [PubMed] [Google Scholar]
- 36.Arrasate M, Mitra S, Schweitzer ES, Segal MR, Finkbeiner S. Inclusion body formation reduces levels of mutant huntingtin and the risk of neuronal death. Nature. 2004;431(7010):805–810. doi: 10.1038/nature02998. [DOI] [PubMed] [Google Scholar]
- 37.Bodner RA, et al. Pharmacological promotion of inclusion formation: A therapeutic approach for Huntington’s and Parkinson’s diseases. Proc Natl Acad Sci USA. 2006;103(11):4246–4251. doi: 10.1073/pnas.0511256103. [DOI] [PMC free article] [PubMed] [Google Scholar]
- 38.Yang D, et al. FTD/ALS-associated poly(GR) protein impairs the Notch pathway and is recruited by poly(GA) into cytoplasmic inclusions. Acta Neuropathol. 2015;130(4):525–535. doi: 10.1007/s00401-015-1448-6. [DOI] [PMC free article] [PubMed] [Google Scholar]
- 39. Committee for the Update of the Guide for the Care and Use of Laboratory Animals (2011) Guide for the Care and Use of Laboratory Animals (National Academies Press, Washington, DC), 8th Ed.
Associated Data
This section collects any data citations, data availability statements, or supplementary materials included in this article.


