Significance
A nanokit was generated by filling a nanometer-sized capillary with a ring electrode at the tip with components from traditional kits, and it was applied to characterize the reactivity and concentrations of cellular compounds in single cells. The nanokit has adapted features of the well-established kits and integrated the kit components and detector in one nanometer-sized capillary, which avoids a complicated structural design or surface functionalization for the recognition of the analytes and could be applied to the analysis of cellular compounds that are challenging to measure using the current methods. The simple and low-cost device provides a specific strategy that should facilitate single-cell analyses.
Keywords: nanokit, single cell, electrochemical analyses, SMase activity, cellular heterogeneity
Abstract
The development of more intricate devices for the analysis of small molecules and protein activity in single cells would advance our knowledge of cellular heterogeneity and signaling cascades. Therefore, in this study, a nanokit was produced by filling a nanometer-sized capillary with a ring electrode at the tip with components from traditional kits, which could be egressed outside the capillary by electrochemical pumping. At the tip, femtoliter amounts of the kit components were reacted with the analyte to generate hydrogen peroxide for the electrochemical measurement by the ring electrode. Taking advantage of the nanotip and small volume injection, the nanokit was easily inserted into a single cell to determine the intracellular glucose levels and sphingomyelinase (SMase) activity, which had rarely been achieved. High cellular heterogeneities of these two molecules were observed, showing the significance of the nanokit. Compared with the current methods that use a complicated structural design or surface functionalization for the recognition of the analytes, the nanokit has adapted features of the well-established kits and integrated the kit components and detector in one nanometer-sized capillary, which provides a specific device to characterize the reactivity and concentrations of cellular compounds in single cells.
The analysis of small molecules and proteins in single cells is critical to understanding the pathways associated with cellular heterogeneity and disease states (1–3). Fluorescence probes that emit specific spectral signals on binding the target molecules are widely used, present the current state of the art technology, and have provided much of our current understanding of intracellular signaling (4–6). The challenges for the analysis of additional molecules using standard fluorescence approaches are in the concerns about cytotoxicity and the structural requirements, making the design and synthesis of nonnative probes a bottleneck to new discoveries (7). For fluorescently tagged proteins, questions regarding the consequences of the altered chemical structure on cellular processes offer opportunities for advances through the development of new analytical technologies for cellular analyses (8). Researchers must investigate the reactivity of a protein with its physiological partners to understand its role in cellular pathways; concentration measurements alone could be misleading, because the local environment of a protein can drastically alter its activity. Emerging capillary micro-/nanofabrication technologies allow the chemical reactivity of the target species to be investigated (3, 9–21). Allbritton and coworkers (11, 12) embarked on the development of this technology and used capillary electrophoresis to analyze intracellular kinase activity. The combination of these advances in characterizing the reactivity and concentrations of cellular compounds with even smaller, more intricate devices will certainly advance our knowledge of cellular heterogeneity and signaling cascades.
Kit-based analysis is well-developed in biology to measure small molecules and proteins in a cell population. The kit components are used to convert small molecules or the substrate of the target proteins into products and by-products that are directly detected using standard fluorescence probes or electrodes. Compared with the fluorescence method described above, the kits use highly specific commercially available enzymes for the detection of small molecules and protein activity, avoiding the structural design of fluorescence probes for individual molecules. Therefore, the adaption of kit-based assays to single cells should provide a specific detection strategy to facilitate single-cell analysis.
Here, a nanokit was developed by adding the kit components to a nanometer-sized capillary that was inserted into one cell. The pumping of the kit components out of the capillary permitted the reaction between small molecules or proteins with the kit components at the nanotip to achieve single-cell analyses. Because of the rapid kit-mediated reaction, obtaining the background fluorescence immediately after the introduction of kit components into the cell was challenging. Therefore, coulometry was used to collect the electrons from the oxidation or reduction of electroactive by-products to quantify the analytes. A single injection of a femtoliter of solution was required to reduce the volume of the solution injected into the cell and produce minimal interruptions of cellular activity, which could not be achieved using mechanical pumping. Recently, an electrochemical attosyringe using electrochemical control of the fluid motion was reported to dispense attoliter to picoliter volumes of aqueous solutions into the cell, which was adapted into our nanokit for the flow of the kit components (22). As a result, electrochemical pumping was integrated into the nanokit to control the fluid flow and initiate the kit reaction at the tip. The nanokit was composed of the kit components, the kit reaction, and the detection at the capillary tip, which should provide a simple but comprehensive sensor for single-cell analyses.
Results
Design of the Nanokit for Electrochemical Analysis.
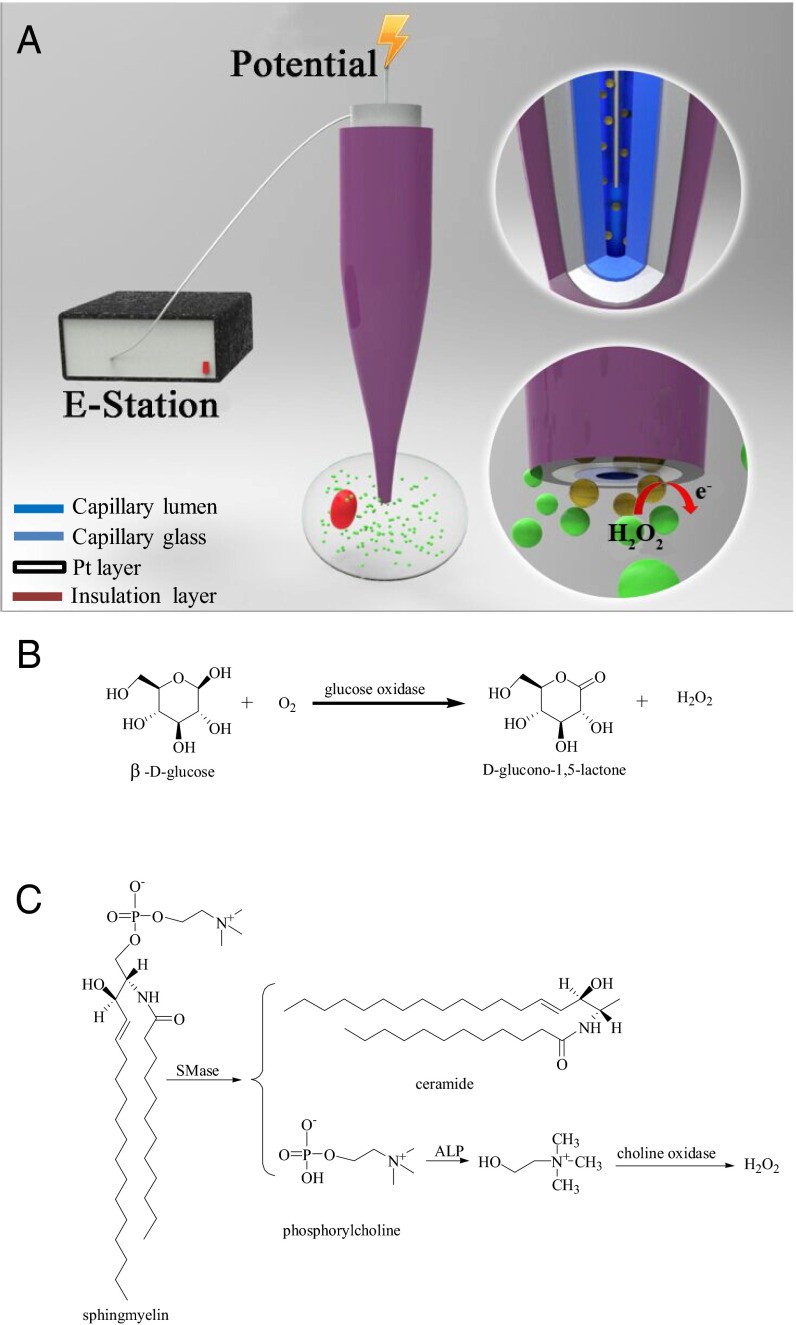
As illustrated in Fig. 1A, our nanokit included a hollow capillary with an ∼130-nm tip opening, a Pt ring at the nanotip, a Pt wire inserted in the capillary, and kit components retained in the capillary. On application of voltage to the Pt wire, the electrochemical control allowed the kit components to flow outside the capillary and react with the target molecules or proteins. The by-product, hydrogen peroxide, was electrochemically oxidized on the Pt layer, and the charge was collected. Because the nonfaradic charge was not associated with the targets and was included in the collected charge, the nanokit was preconditioned in the solution without the analyte, and the amount of the nonfaradic charge was determined. The nonfaradic charge was excluded from the total charge to quantify the reactivity and concentrations of the cellular compounds.
Fig. 1.
(A) Schematic of the nanokit used for the single-cell electrochemical analysis. (B) Chemical reaction between glucose and glucose oxidase. (C) Chemical reaction between sphingomyelin, SMase, alkaline phosphatase (ALP), and choline oxidase.
Glucose and sphingomyelinase (SMase) were chosen as the models for the small molecule and protein, respectively, to assess the ability of our nanokit to sense molecules in single cells. Glucose is a simple but important sugar that provides the body with its primary source of energy. Traditionally, a fluorescent glucose analog mimicking natural glucose was introduced into the cell to study the intracellular glucose levels or uptake (23). Electrochemical sensors were developed to analyze the glucose levels in serum and cell populations (24); however, the electrochemical analysis of intracellular glucose levels at the single-cell level was still challenging (25, 26). Thus, we attempted to use our nanokit to analyze the glucose levels in single cells. Additionally, SMase is a hydrolase enzyme involved in sphingolipid metabolism reactions, and SMase activation has been suggested as a major route for the production of ceramide in response to cellular stresses (27). Information about the chemical activity of SMase is important to understand cellular stress; however, the analysis of SMase activity in single cells has not been achieved, which will also be addressed using our nanokit.
In our strategy, glucose oxidase was added into the capillary and could be pushed outside the capillary to oxidize glucose and generate hydrogen peroxide at the tip for the detection of glucose as depicted in Fig. 1B. Similarly, a mixture including sphingomyelin, alkaline phosphatase, and choline oxidase was prepared in the capillary to determine SMase activity (28). In the presence of intracellular SMase, sphingomyelin underwent serial reactions with SMase, alkaline phosphatase, and choline oxidase to generate hydrogen peroxide as illustrated in Fig. 1C. The amount of hydrogen peroxide should correlate with the amount of glucose and the SMase activity, and thus, information about the intracellular glucose levels and SMase activity should be provided using our nanokits.
Characterization of the Nanokit.
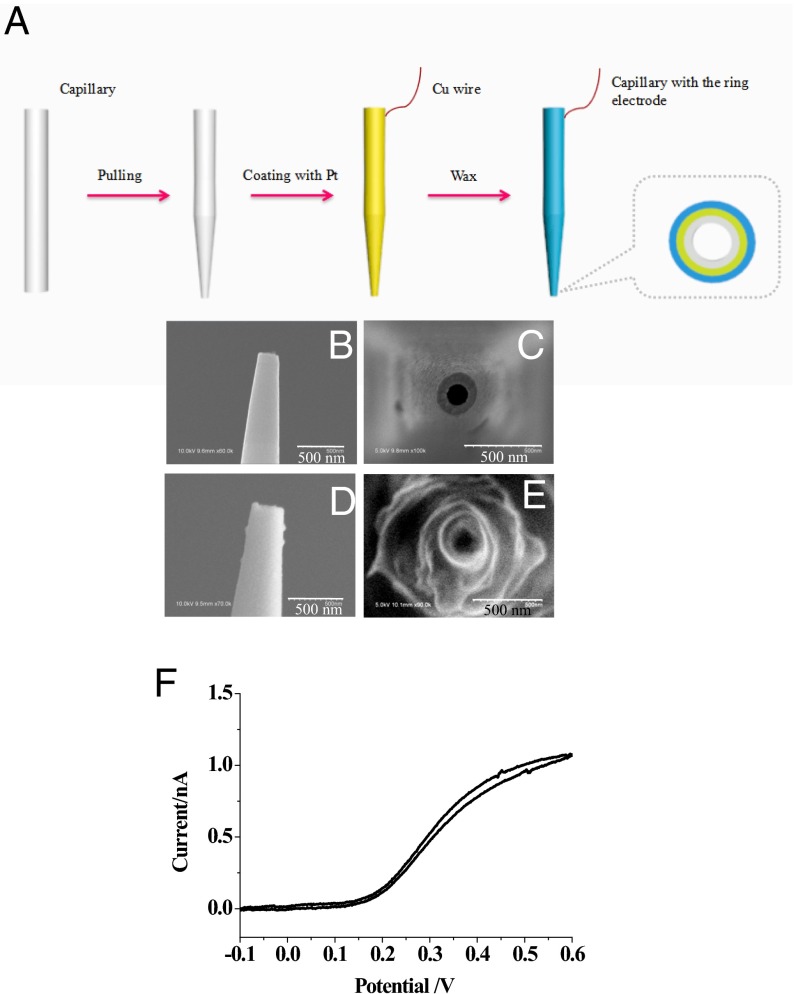
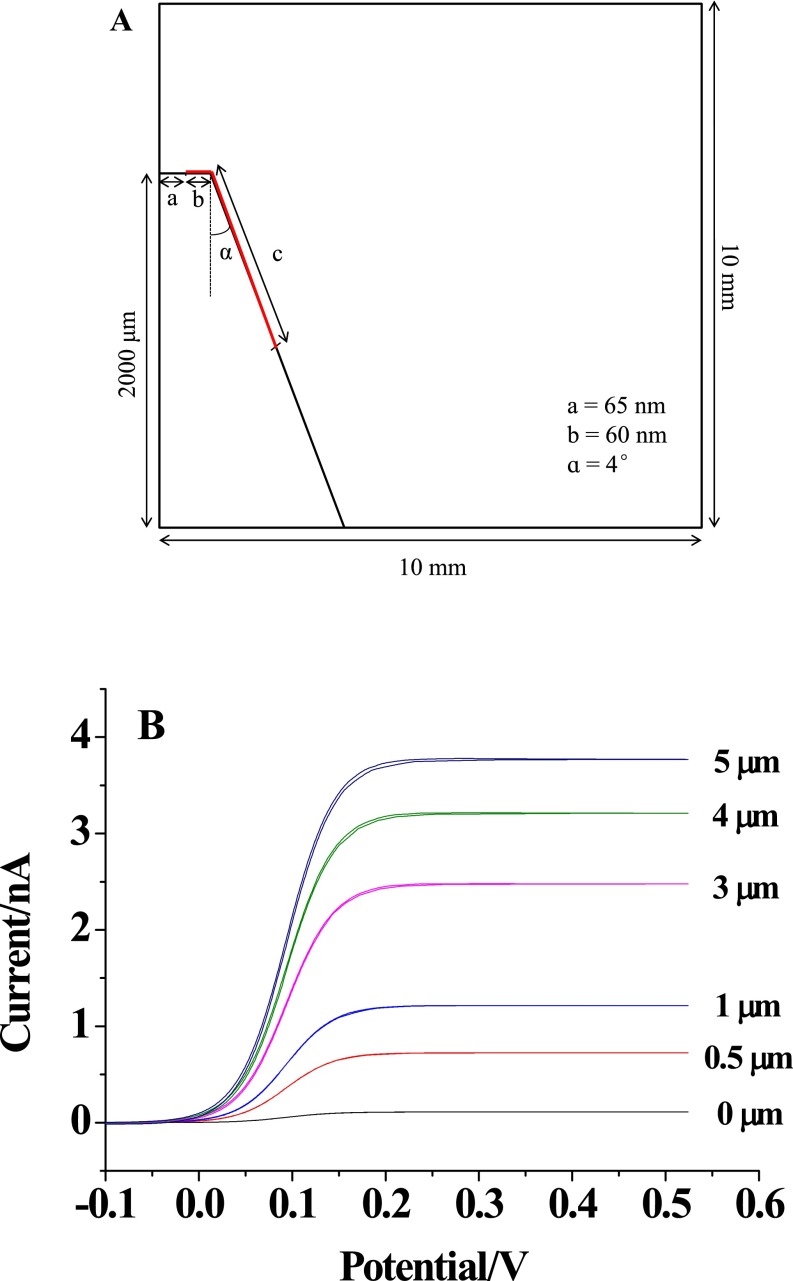
The fabrication of the nanocapillary with the ring electrode at the tip was performed using the classic protocol for generating an atomic force microscope tip as shown in Fig. 2A, including pulling the capillary to generate a 130-nm tip opening, coating the Pt layer on the capillary, and insulating the Pt layer using Apiezon wax (29). This insulation process using wax had been proven to generate a ring of exposed Pt that could be used for subsequent electrochemical detection (30). The SEM imaging shown in Fig. 2 B–E showed that the opening of the capillary was maintained at ∼130 nm during the preparation process, and the outer diameter of Pt coated on capillary tip increased from ∼200 to ∼300 nm after insulation. The size of the capillary was far smaller than that of the cell, so that the capillary would be suitable for the insertion into one cell with minor interruption of cellular activity. The capillary was placed in 100 mM PBS (pH 7.4) with 5 mM ferrocyanide to confirm the presence of Pt layer at the tip. As shown in Fig. 2F, after insulation, the voltammetry of the capillary exhibited a limiting current of ∼1 nA. For the quantitative characterization of this exposed area, the voltammetry of this region was stimulated using Comsol software as shown in Fig. S1 (31). Because the experimental current was larger than the theoretical value from the ring electrode, an additional Pt region at the capillary tip existed. To match the theoretical current, the length of this Pt region was estimated to be ∼1 µm.
Fig. 2.
(A) The preparation of the capillary with the Pt ring at the nanotip. (B–E) SEM imaging of the capillary tip coated with the Pt layer (B shows side view, and C shows front view) and the Pt-coated tip covered with wax (D shows side view, and E shows front view). (Scale bars: 500 nm.) (F) Voltammetry of the Pt ring at the tip in 100 mM PBS with 5 mM ferrocyanide. The scan rate was 100 mV/s.
Fig. S1.
(A) The model of the ring electrode at the tip of capillary used in finite element simulations. The region of the electrode (labeled in red) included the ring electrode at the tip surface (curve b) and an additional Pt region at the capillary tip (curve c). The simulation process followed the procedure reported by White and coworkers (31). (B) The voltammetry collected on the ring electrode and the ring electrode with the Pt lengths of 0.5, 1, 3, 4, and 5 µm.
Nanokit for the Assay of Aqueous Glucose Levels and SMase Activity.
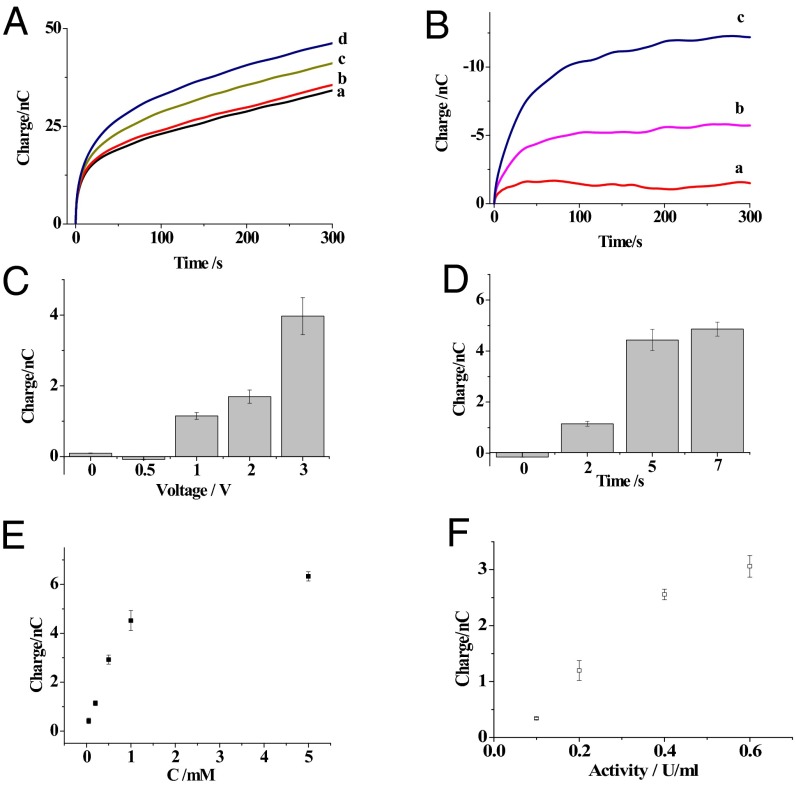
The voltage and the time required for the kit components to egress out of the tip were optimized to minimize the volume of solution entering the cell, analyze a smaller region, and induce minor interruptions of cellular activity. In this process, the physiological buffer (10 mM PBS, pH 7.4) with glucose oxidase was added to the capillary to detect the aqueous glucose levels. Based on previously reported conditions (22), a voltage of 1.0 V was applied to the capillary for 2 s for the initial egress of glucose oxidase. The charge curve in Fig. 3A showed that more charge was observed at the capillary in the presence of glucose, indicating that glucose was detected. No additional increase in charge was observed at the capillary when glucose or glucose oxidase was removed from the system. After extracting the nonfaradic charge collected in buffer, the increase in the faradic charge reached a steady state, and the timing was dependent on the glucose concentrations as shown in Fig. 3B. The steady-state charge was attributed to the diffusion of the limited amount of glucose oxidase at the tip into the bulk solution, so that the low concentration of glucose oxidase could not initiate the reaction with glucose.
Fig. 3.
(A) The charges of the nanokit exposed to 10 mM PBS (pH 7.4; curve a) or 10 mM PBS with 0.2 (curve b), 1 (curve c), or 5 mM glucose (curve d). (B) The differences in the charges collected in 0.2 (curve a), 1 (curve b), and 5 mM glucose (curve c) after extracting the nonfaradic charge collected in PBS. (C) The differences in the charges of the nanokit exposed to 0.2 mM glucose and different voltages for 2 s. (D) The differences in the charges of the nanokit exposed to 0.2 mM glucose and 1 V for different times. (E) The correlation between the differences in the charges and the glucose concentrations. (F) The correlation between the differences in charges and SMase activity. The error bars represent the SDs from three independent experiments.
The voltage applied on the capillary was varied, and the charges were successively collected from the capillary in PBS with 0.2 mM glucose to determine the minimal voltage. After the exclusion of nonfaradic charge collected in PBS, a measurable charge for glucose was obtained with a minimal voltage of 1 V as shown in Fig. 3C. Fig. 3D illustrates that the shortest time that this voltage could be applied was 2 s; therefore, a voltage of 1 V for 2 s was determined to be the optimal condition to achieve the expulsion of the kit components outside the capillary for the nanokit assay. According to the previous theoretical estimation (22), the volume of liquid egressed from our capillary was smaller than 10 fL and encompassed a region of ∼3 µm in diameter around the tip. Based on the charge obtained from the oxidase–glucose reaction, a larger region of ∼36 µm in diameter was determined, which was consistent with the diffusion of glucose oxidase in bulk solution. Eventually, aqueous glucose in concentrations from 0.05 to 5mM was successfully detected by the nanokit as shown in Fig. 3E. The nonlinearity between the charge and glucose concentration over 1 mM might be complicated by diffusional loss of hydrogen peroxide at relative high concentration. The relative SD of results from three nanokits was less than 9.04% at these concentrations, suggesting good reproducibility of our kit.
A mixture of sphingomyelin, alkaline phosphatase, and choline oxidase was added to the buffer to detect SMase activity. The concentrations of sphingomyelin, alkaline phosphatase, and choline oxidase were optimized as 1 mM, 5 U/mL, and 5 U/mL, respectively, using an SMase-amplex red assay, which was adapted to our nanokit. The same procedure was performed with the conditions used to sense the glucose concentrations. As shown in Fig. 3F, the SMase activity from 0.1 to 0.6 U/mL was correlated with the increase in faradic charge, which revealed that SMase activity could be measured using the nanokits. The removal of sphingomyelin, alkaline phosphatase, or choline oxidase did not induce an increase in charge after the expulsion of the kit components, which validated the SMase activity assay.
Nanokits for the Analysis of Glucose Levels and SMase Activity in Single Cells.
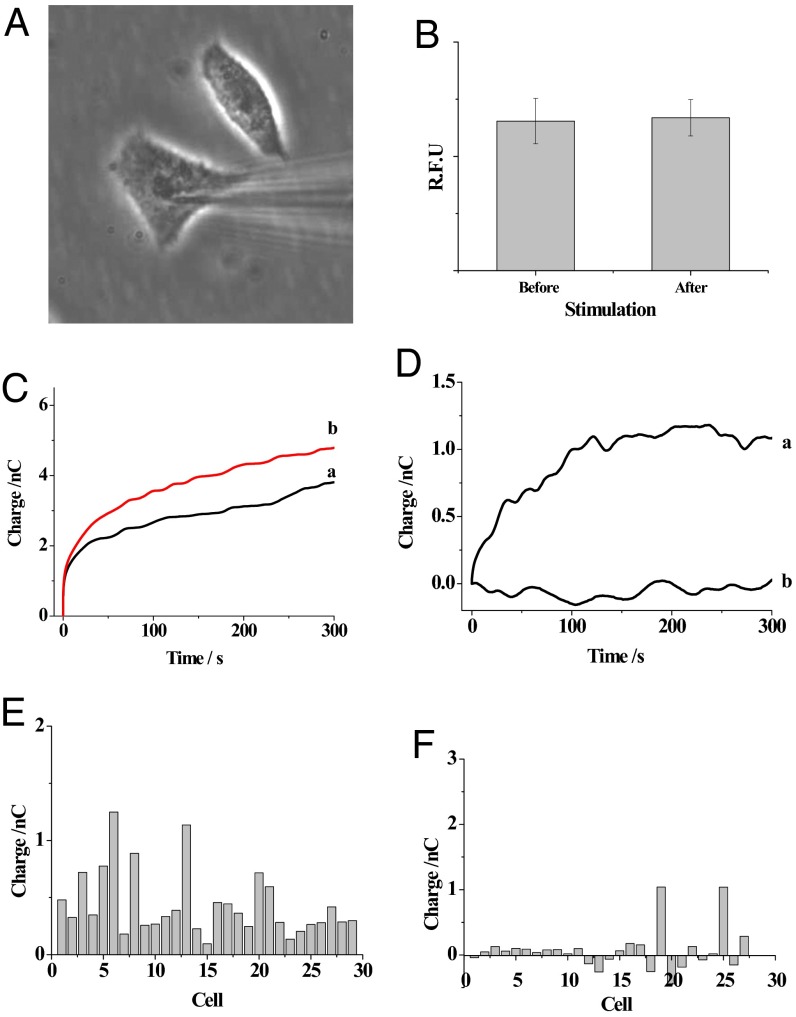
Fig. 4A shows the bright-field imaging of the capillary insertion into the cell. It was critical that the insertion of the capillary into the cell and the subsequent electrochemical-induced injection of the kit components did not interrupt the cellular activity, so that the assays of the intracellular glucose levels and SMase activity were meaningful. Because calcium is involved in multiple cellular pathways, the fluctuations in SMase activity or glucose concentrations should be associated with the changes in the intracellular calcium concentrations (32). Therefore, the intracellular calcium concentrations were measured using the fluorescence probe Fluo-3 before and after capillary insertion and the initial voltage application. As shown in Fig. 4B, no significant increase in fluorescence intensity was observed after capillary insertion and the application of 1 V for 30 s. The near-constant calcium concentration inside the cell revealed that the application of 1 V for 2 s during the measurement did not significantly interrupt the cellular activity. Thus, the nanokit could be applied to the intracellular assay of small molecule levels and protein activity.
Fig. 4.
(A) Bright-field image of a nanocapillary inserted into the cell. (B) The fluorescence intensity (R.F.U.) (intracellular calcium concentration) observed in the cells (n = 10) before and after capillary insertion and the application of voltage for egression of the solution. (C) The charges of the capillary before (trace a) and after (trace b) capillary insertion into the cell. (D) The difference in the charges after the extraction of the nonfaradic charge collected outside the cell using capillaries including glucose oxidase (trace a) or PBS alone (trace b). (E) The faradic charge collected in 29 HeLa cells. (F) The faradic charge collected in 27 starved cells.
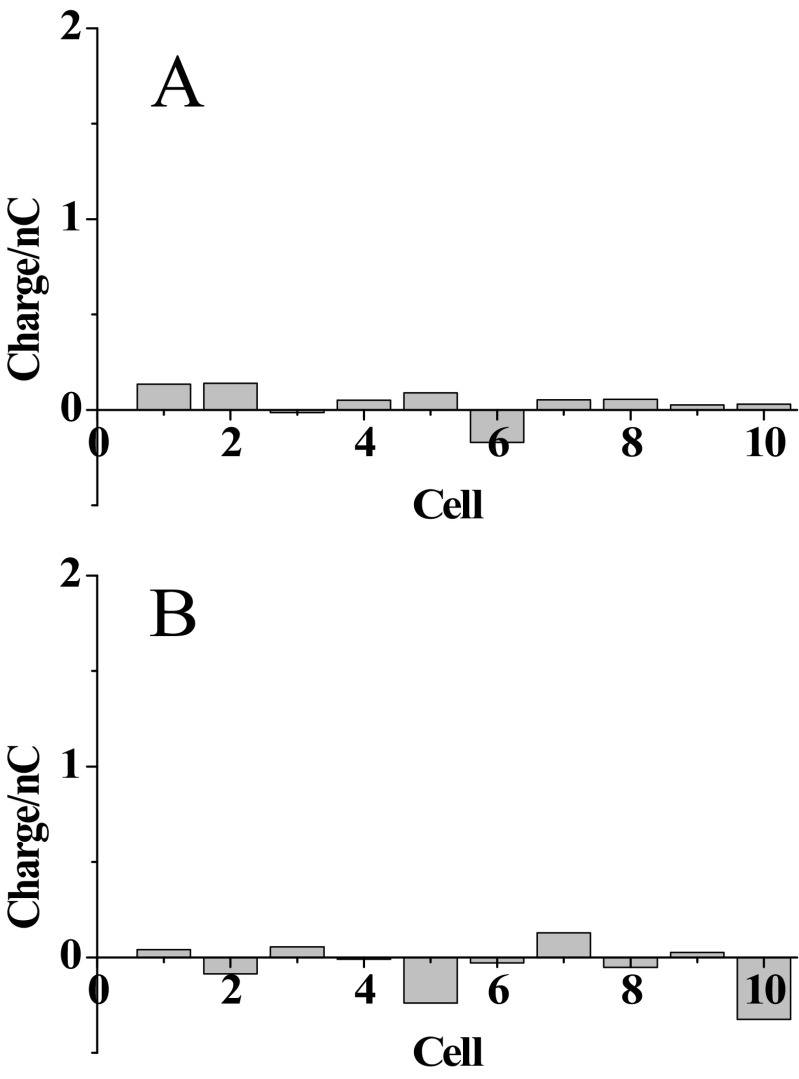
To minimize the time that the voltage was applied at the cells, the nonfaradic charge was collected outside the cells after the application of 1 V for 2 s and used as the background charge in the analysis. Control experiments were presented in Fig. S2A, showing that the nonfaradic charge was not significantly different inside and outside of the cell. The data indicated that cell components adsorbing at the ring electrode surface did not obviously affect the nonfaradic charge. After the egression of glucose oxidase into the cell, more charge was observed from the capillary in Fig. 4C. Fig. 4D, trace a shows that a constant increase in faradic charge was observed after the exclusion of the background charge, which was attributed to the limited amounts of intracellular glucose and glucose oxidase at the tip. PBS alone was placed in the capillary and injected into the cell. The lack of an increase in charge associated with PBS in Fig. 4D, trace b and Fig. S2B confirmed that injection of glucose oxidase was required for detection of glucose using the nanokit. Fig. 4E shows the charge increase in single HeLa cells, suggesting that intracellular glucose was detected. According to the average charge of 0.44 nC collected from single cells, the intracellular glucose level was estimated to be 2 mM, which was similar to published data and our previous results (25, 26). The relative SD of 63.6% from single-cell analysis was much larger than that of 9.04% from the measurement of aqueous glucose using three electrodes, which indicated the cellular heterogeneity of the intracellular glucose levels. This high cellular heterogeneity of intracellular glucose was similar to our previous results obtained using electrochemiluminescence imaging (26).
Fig. S2.
(A) The changes of nonfaradic charge that flowed after the potential (600 mV) perturbation for 120 s on inserting the tip inside 10 individual cells compared with the background nonfaradic charge collected outside the cells. (B) The changes of nonfaradic charge from the capillary after the egression of 10 mM PBS solution into 10 individual cells compared with the background nonfaradic charge collected outside the cells. The background charge was collected from the ring electrode for 120 s after the egression of glucose oxidase into the bulk solution.
For the confirmation of intracellular glucose analysis, the cells were harvested for 12 h to lower intracellular glucose level. After the exclusion of nonfaradic charge, the faradic charges from the harvested cells were as shown in Fig. 4F. The average charge was less than that collected from the untreated cells, which confirmed that our nanokit could determine the fluctuations in the intracellular glucose levels in single cells.
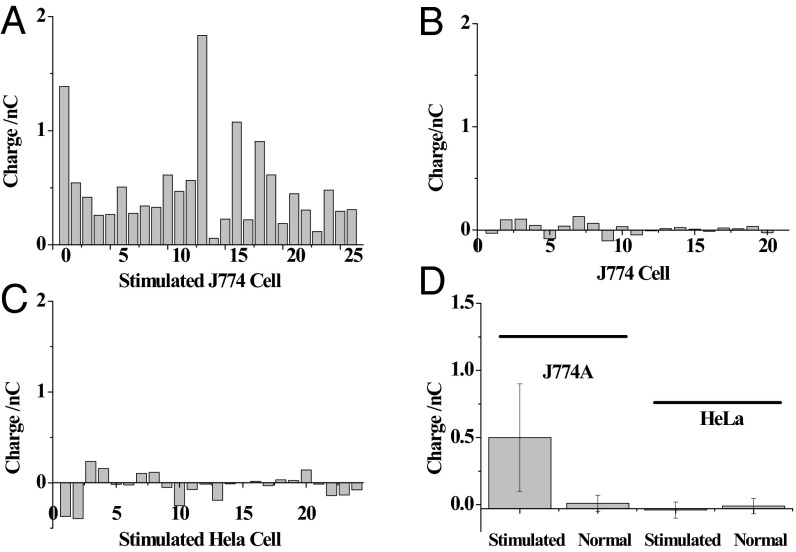
Intracellular SMase activity was analyzed in single J774 cells, which up-regulated SMase activity on stimulation with 0.1 mM Zn(II) ions (33). Using the protocol for the determination of aqueous SMase activity, sphingomyelin, alkaline phosphatase, and choline oxidase were added to the capillary. Similar to the process for the single-cell glucose analysis, the capillary was inserted into a Zn(II)-stimulated cell, and the kit components were injected into the cell. Compared with background charge, the average increase of the charges in Fig. 5A after the egression of kit components and the subsequent collection of charge for 120 s was 0.5 nC in all 26 cells, indicating that intracellular SMase activity could be measured in single cells. The diffusion of kit components, mainly proteins (alkaline phosphatase and oxidase), in the crowded cytoplasm will be restricted compared with the measurements outside the cell. Based on literature approximations, a threefold reduction for the diffusion of GFP was observed in cytoplasm compared with that in water (34). Therefore, this reduction in the diffusion was adapted in our estimation, and some systematic error in gauging protein activity might exist. The diffusion region of the kit components was likely decreased from ∼36 µm in aqueous solution to ∼12 µm in cells, which was close to the size of the cell. The charge of 0.5 nC collected in 120 s suggested that 2.5 × 10⁻⁹ µmol sphingomyelin was converted in this time period. The average activity of SMase in the cell was estimated to be 1.25 nU in the cell. The relative SD of these charges was 80.4%, revealing the high heterogeneity of SMase activity after the stimulation.
Fig. 5.
The faradic charge of the electrode collected in (A) Zn-stimulated J774 cells (n = 26), (B) unstimulated J774 cells (n = 20), and (C) Zn-stimulated HeLa cells (n = 24) after the extraction of the nonfaradic charge collected outside the cell. (D) Statistical analysis of the cells at different states.
For the nonstimulated cells, the faradic charges in all of the measured cells were close to zero as shown in Fig. 5B, indicating low intracellular SMase activity. Because the introduction of the Zn(II) ions might increase the intracellular ion concentration and result in more charge on the electrode, a control experiment was performed in Zn(II)-stimulated HeLa cells that did not express SMase on stimulation. As expected, almost no faradic charges were collected in all HeLa cells after stimulation (Fig. 5C), showing that the SMase activity in HeLa cells was low. As illustrated in Fig. 5D, the statistical analysis of these two cell lines confirmed that more charge was observed in the Zn-stimulated J774 cells, indicating that SMase activity was measured in single cells using our nanokit.
Conclusions
In summary, nanokits were successfully developed to detect intracellular glucose levels and SMase activity in single cells. The components of traditional kits were inserted into a nanometer-sized capillary, and thus, optimization of the components was not required to analyze the targets. The by-product, hydrogen peroxide, was produced from the reaction between the analyte and kit components and electrochemically oxidized on the ring electrode for quantification, which permitted the integration of kit components and detectors on one capillary to facilitate single-cell analysis. The adaption of well-developed kits resulted in the analysis of additional molecules in single cells that might not be detected using current methods. Moreover, the strategy avoided the complicated structural design of fluorescent probes or the electrode functionalization, simplifying the single-cell analysis. The future automation of the insertion of the nanokit into single cells and the subsequent measurements could offer a high-throughput strategy for single-cell analysis. Meanwhile, this nanokit strategy could be applied as an alternative method for surface functionalization in electrochemical sensing technologies. Multiple steps are needed to fix more than one enzyme on the electrode surface in classic surface modification, and these steps must be optimized to maintain enzyme activity. However, using the nanokit, all of the enzymes were retained in solution at the capillary tip and maintained their activity; thus, there was no restriction on the number of enzymes that could be added. Therefore, the nanokit could be developed for future electrochemical sensing assays, and the detailed characterization of this nanokit-based electrochemical sensing is under investigation.
Methods
Nanokit Fabrication.
A glass capillary (BF100-58-10) was pulled using a micropipette puller (P2000; Sutter Instrument Co.) to create a tip with an ∼130-nm opening. The capillary was sputtered with a layer of Pt with a thickness of ∼70 nm. Then, the capillary was covered with Apiezon wax according to a previous protocol (30) to leave a small region of the Pt layer at the tip as the electrochemical detector. For the glucose nanokit, 100 U/mL glucose oxidase in 10 mM PBS (pH 7.4) was retained in the capillary. For the SMase nanokit, 10 mM PBS with 1 mM sphingomyelin, 5 U/mL alkaline phosphatase, and 5 U/mL choline oxidase were included in the capillary. A Pt wire was inserted into the capillary to electrochemically egress the fluid in the capillary.
Characterization of the Capillary with a Ring Electrode.
The capillary tips covered with a Pt layer were characterized before and after insulation using SEM (Hitachi S-4800 Instrument). An accelerating voltage of 10 kV was used on an Au-coated sample. The capillary was exposed to 100 mM PBS (pH 7.4) with 5 mM ferrocyanide to characterize the region of the Pt layer exposed at the tip. The Ag/AgCl and Pt electrodes were used as the reference and counterelectrodes, respectively. The voltage cycle ranged from −0.1 to 0.6 V, and a scanning rate of 100 mV/s was applied to collect the current using an electrochemical station (CHI 630E; CH Instruments).
Detection of Aqueous Glucose and SMase Activity.
Initially, the capillary with the kit components was immersed in 10 mM PBS (pH 7.4). A voltage was applied between the Pt wire in the capillary and the Ag/AgCl wire in the solution for a certain time to initiate the expulsion of the kit components outside the capillary. Then, a voltage of 600 mV was applied on the Pt ring at the nanotip to collect the nonfaradic charge using the electrochemical station (CHI 630E; CH Instruments). Afterward, glucose or SMase was introduced into the solution, and the same process was repeated to collect the charge from the kit reaction.
Single-Cell Analysis.
The capillary with the kit components was mounted on a 3D translation stage to achieve single-cell analysis. The cells were cultured in 10 mM PBS immediately before the analysis. Initially, the capillary was positioned outside the cell, and the nonfaradic charge was collected using the procedure for the detection of the aqueous glucose levels or SMase activity. Then, the cell was inserted into the cell, and the same procedure was repeated to collect the charge from the kit reaction inside the cell.
Acknowledgments
This work was supported by 973 Program Grants 2012CB932600 and 2013CB933800 and National Natural Science Foundation of China Grants 21327902, 21135003, and 21575060.
Footnotes
The authors declare no conflict of interest.
This article is a PNAS Direct Submission.
This article contains supporting information online at www.pnas.org/lookup/suppl/doi:10.1073/pnas.1609618113/-/DCSupplemental.
References
- 1.Schubert C. Single-cell analysis: The deepest differences. Nature. 2011;480(7375):133–137. doi: 10.1038/480133a. [DOI] [PubMed] [Google Scholar]
- 2.Chattopadhyay PK, Gierahn TM, Roederer M, Love JC. Single-cell technologies for monitoring immune systems. Nat Immunol. 2014;15(2):128–135. doi: 10.1038/ni.2796. [DOI] [PMC free article] [PubMed] [Google Scholar]
- 3.Rubakhin SS, Romanova EV, Nemes P, Sweedler JV. Profiling metabolites and peptides in single cells. Nat Methods. 2011;8(4) Suppl:S20–S29. doi: 10.1038/nmeth.1549. [DOI] [PMC free article] [PubMed] [Google Scholar]
- 4.Dean KM, Palmer AE. Advances in fluorescence labeling strategies for dynamic cellular imaging. Nat Chem Biol. 2014;10(7):512–523. doi: 10.1038/nchembio.1556. [DOI] [PMC free article] [PubMed] [Google Scholar]
- 5.Cohen D, et al. Chemical cytometry: Fluorescence-based single-cell analysis. Annu Rev Anal Chem (Palo Alto, Calif) 2008;1:165–190. doi: 10.1146/annurev.anchem.1.031207.113104. [DOI] [PubMed] [Google Scholar]
- 6.Giepmans BNG, Adams SR, Ellisman MH, Tsien RY. The fluorescent toolbox for assessing protein location and function. Science. 2006;312(5771):217–224. doi: 10.1126/science.1124618. [DOI] [PubMed] [Google Scholar]
- 7.Wang Y, Shyy JYJ, Chien S. Fluorescence proteins, live-cell imaging, and mechanobiology: Seeing is believing. Annu Rev Biomed Eng. 2008;10:1–38. doi: 10.1146/annurev.bioeng.010308.161731. [DOI] [PubMed] [Google Scholar]
- 8.Coralli C, Cemazar M, Kanthou C, Tozer GM, Dachs GU. Limitations of the reporter green fluorescent protein under simulated tumor conditions. Cancer Res. 2001;61(12):4784–4790. [PubMed] [Google Scholar]
- 9.Olefirowicz TM, Ewing AG. Capillary electrophoresis in 2 and 5 microns diameter capillaries: Application to cytoplasmic analysis. Anal Chem. 1990;62(17):1872–1876. doi: 10.1021/ac00216a026. [DOI] [PubMed] [Google Scholar]
- 10.Hogan BL, Yeung ES. Determination of intracellular species at the level of a single erythrocyte via capillary electrophoresis with direct and indirect fluorescence detection. Anal Chem. 1992;64(22):2841–2845. doi: 10.1021/ac00046a031. [DOI] [PubMed] [Google Scholar]
- 11.Lee CL, Linton J, Soughayer JS, Sims CE, Allbritton NL. Localized measurement of kinase activation in oocytes of Xenopus laevis. Nat Biotechnol. 1999;17(8):759–762. doi: 10.1038/11691. [DOI] [PubMed] [Google Scholar]
- 12.Meredith GD, Sims CE, Soughayer JS, Allbritton NL. Measurement of kinase activation in single mammalian cells. Nat Biotechnol. 2000;18(3):309–312. doi: 10.1038/73760. [DOI] [PubMed] [Google Scholar]
- 13.Rubakhin SS, Garden RW, Fuller RR, Sweedler JV. Measuring the peptides in individual organelles with mass spectrometry. Nat Biotechnol. 2000;18(2):172–175. doi: 10.1038/72622. [DOI] [PubMed] [Google Scholar]
- 14.Woods LA, Gandhi PU, Ewing AG. Electrically assisted sampling across membranes with electrophoresis in nanometer inner diameter capillaries. Anal Chem. 2005;77(6):1819–1823. doi: 10.1021/ac048589y. [DOI] [PubMed] [Google Scholar]
- 15.Sun P, et al. Nanoelectrochemistry of mammalian cells. Proc Natl Acad Sci USA. 2008;105(2):443–448. doi: 10.1073/pnas.0711075105. [DOI] [PMC free article] [PubMed] [Google Scholar]
- 16.Amatore C, Arbault S, Guille M, Lemaître F. Electrochemical monitoring of single cell secretion: Vesicular exocytosis and oxidative stress. Chem Rev. 2008;108(7):2585–2621. doi: 10.1021/cr068062g. [DOI] [PubMed] [Google Scholar]
- 17.Ramsay LM, Dickerson JA, Dada O, Dovichi NJ. Femtomolar concentration detection limit and zeptomole mass detection limit for protein separation by capillary isoelectric focusing and laser-induced fluorescence detection. Anal Chem. 2009;81(5):1741–1746. doi: 10.1021/ac8025948. [DOI] [PMC free article] [PubMed] [Google Scholar]
- 18.Singhal R, et al. Multifunctional carbon-nanotube cellular endoscopes. Nat Nanotechnol. 2011;6(1):57–64. doi: 10.1038/nnano.2010.241. [DOI] [PubMed] [Google Scholar]
- 19.Wang Y, et al. Nanoelectrodes for determination of reactive oxygen and nitrogen species inside murine macrophages. Proc Natl Acad Sci USA. 2012;109(29):11534–11539. doi: 10.1073/pnas.1201552109. [DOI] [PMC free article] [PubMed] [Google Scholar]
- 20.Trouillon R, Passarelli MK, Wang J, Kurczy ME, Ewing AG. Chemical analysis of single cells. Anal Chem. 2013;85(2):522–542. doi: 10.1021/ac303290s. [DOI] [PubMed] [Google Scholar]
- 21.Actis P, et al. Electrochemical nanoprobes for single-cell analysis. ACS Nano. 2014;8(1):875–884. doi: 10.1021/nn405612q. [DOI] [PubMed] [Google Scholar]
- 22.Laforge FO, Carpino J, Rotenberg SA, Mirkin MV. Electrochemical attosyringe. Proc Natl Acad Sci USA. 2007;104(29):11895–11900. doi: 10.1073/pnas.0705102104. [DOI] [PMC free article] [PubMed] [Google Scholar]
- 23.O’Neil RG, Wu L, Mullani N. Uptake of a fluorescent deoxyglucose analog (2-NBDG) in tumor cells. Mol Imaging Biol. 2005;7(6):388–392. doi: 10.1007/s11307-005-0011-6. [DOI] [PubMed] [Google Scholar]
- 24.Hsueh C-J, Janyasupab M, Lee Y-H, Liu C-C. Electrochemical glucose sensors. In: Kreysa G, Ota K-i, Savinell RF, editors. Encyclopedia of Applied Electrochemistry. Springer; New York: 2014. pp. 479–485. [Google Scholar]
- 25.Nascimento RA, et al. Single cell “glucose nanosensor” verifies elevated glucose levels in individual cancer cells. Nano Lett. 2016;16(2):1194–1200. doi: 10.1021/acs.nanolett.5b04495. [DOI] [PMC free article] [PubMed] [Google Scholar]
- 26.Xu J, Huang P, Qin Y, Jiang D, Chen H-Y. Analysis of intracellular glucose at single cells using electrochemiluminescence imaging. Anal Chem. 2016;88(9):4609–4612. doi: 10.1021/acs.analchem.6b01073. [DOI] [PubMed] [Google Scholar]
- 27.Hannun YA, Obeid LM. The Ceramide-centric universe of lipid-mediated cell regulation: Stress encounters of the lipid kind. J Biol Chem. 2002;277(29):25847–25850. doi: 10.1074/jbc.R200008200. [DOI] [PubMed] [Google Scholar]
- 28.Zhang Y, et al. Involvement of the acid sphingomyelinase pathway in uva-induced apoptosis. J Biol Chem. 2001;276(15):11775–11782. doi: 10.1074/jbc.M006000200. [DOI] [PMC free article] [PubMed] [Google Scholar]
- 29.Amemiya S, Bard AJ, Fan F-RF, Mirkin MV, Unwin PR. Scanning electrochemical microscopy. Annu Rev Anal Chem (Palo Alto, Calif) 2008;1:95–131. doi: 10.1146/annurev.anchem.1.031207.112938. [DOI] [PubMed] [Google Scholar]
- 30.Nagahara LA, Thundat T, Lindsay SM. Preparation and characterization of STM tips for electrochemical studies. Rev Sci Instrum. 1989;60(10):3128–3130. [Google Scholar]
- 31.Zhang B, Zhang Y, White HS. Steady-state voltammetric response of the nanopore electrode. Anal Chem. 2006;78(2):477–483. doi: 10.1021/ac051330a. [DOI] [PubMed] [Google Scholar]
- 32.Sharma K, Shi Y. The yins and yangs of ceramide. Cell Res. 1999;9(1):1–10. doi: 10.1038/sj.cr.7290001. [DOI] [PubMed] [Google Scholar]
- 33.Schissel SL, Schuchman EH, Williams KJ, Tabas I. Zn2+-stimulated sphingomyelinase is secreted by many cell types and is a product of the acid sphingomyelinase gene. J Biol Chem. 1996;271(31):18431–18436. doi: 10.1074/jbc.271.31.18431. [DOI] [PubMed] [Google Scholar]
- 34.Swaminathan R, Hoang CP, Verkman AS. Photobleaching recovery and anisotropy decay of green fluorescent protein GFP-S65T in solution and cells: Cytoplasmic viscosity probed by green fluorescent protein translational and rotational diffusion. Biophys J. 1997;72(4):1900–1907. doi: 10.1016/S0006-3495(97)78835-0. [DOI] [PMC free article] [PubMed] [Google Scholar]


