Significance
Infectious complications can be lethal in patients with cancer when chemotherapy depletes white blood cells (WBCs) needed to clear microbes. Prevention of infection by vaccination also requires WBCs, and thus has not been effective in saving patients with low WBC counts during chemotherapy. Using a mouse model, we discovered a kind of lung WBC that survives chemotherapy. This cell is found in the lung and can engulf and remove bacteria when activated by a vaccine. This vaccination strategy results in excellent survival in a mouse model of lethal bacterial pneumonia in the setting of chemotherapy. These findings suggest that a protective, chemotherapy-stable lung WBC could be exogenously induced to protect patients with cancer who are at high risk of life-threatening infections.
Keywords: chemotherapy, neutropenia, vaccine, macrophage, Pseudomonas aeruginosa pneumonia
Abstract
Infection is the single greatest threat to survival during cancer chemotherapy because of depletion of bone marrow-derived immune cells. Phagocytes, especially neutrophils, are key effectors in immunity to extracellular pathogens, which has limited the development of new approaches to protect patients with cancer and chemotherapy-induced neutropenia. Using a model of vaccine-induced protection against lethal Pseudomonas aeruginosa pneumonia in the setting of chemotherapy-induced neutropenia, we found a population of resident lung macrophages in the immunized lung that mediated protection in the absence of neutrophils, bone marrow-derived monocytes, or antibodies. These vaccine-induced macrophages (ViMs) expanded after immunization, locally proliferated, and were closely related to alveolar macrophages (AMs) by surface phenotype and gene expression profiles. By contrast to AMs, numbers of ViMs were stable through chemotherapy, showed enhanced phagocytic activity, and prolonged survival of neutropenic mice from lethal P. aeruginosa pneumonia upon intratracheal adoptive transfer. Thus, induction of ViMs by tissue macrophage remodeling may become a framework for new strategies to activate immune-mediated reserves against infection in immunocompromised hosts.
Chemotherapy and radiotherapy have been mainstays of cancer treatment for ∼80 y (1). Both therapies target dividing cells with the collateral cost of damaging and killing proliferating noncancerous cells in essential tissues such as bone marrow, lung, gut, skin, and mucosal surfaces. Defining the resources the body could use to adapt to broad tissue damage is essential to mitigating the negative effects of current cancer therapy.
Humans make ∼109 neutrophils per kilogram per day, a rate that increases after infection by bacteria, fungi, viruses, and parasites (2). Chemotherapy agents such as cyclophosphamide (CY) kill dividing cells in the granulocyte–macrophage progenitor fraction of the bone marrow. Neutropenia (<0.5 × 10³ neutrophils per microliter of blood) is a prevalent consequence of chemotherapy-induced damage to the bone marrow, and the degree of neutropenia correlates with the incidence of life-threatening infections (3–5). Neutropenia can be abated in some cases by systemic granulocyte colony-stimulating factor (G-CSF) therapy that forces the remnant neutrophil progenitors into cycle (6). However, when the progenitors are severely depleted or damaged by intense chemotherapy, G-CSF cannot induce neutrophil rebound and the patient remains at risk for serious infections.
Here, we determined that the lung immune microenvironment harbors myeloid cells that can expand by exogenous stimulation, survive chemotherapy, and mediate host defense against lethal bacterial infection in the setting of chemotherapy-induced bone marrow suppression. Our whole-animal model sequentially combined three components: vaccination with a live-attenuated Pseudomonas aeruginosa vaccine; CY as the systemic bone marrow-suppressive chemotherapy agent; and challenge with virulent P. aeruginosa, the leading cause of bacterial pneumonia in patients with cancer and neutropenia (7). We found that resident lung macrophages, most of which originate in embryogenesis, respond to vaccination and protect the lung in the absence of circulating neutrophils, antibodies, or bone marrow-derived monocytes normally required for lung protection in infection. Our study suggests ways to harness the natural defensive capacity of lung resident macrophages to compensate for depletion of neutrophils in cancer therapy.
Results
Vaccination Protects Against Lethal P. aeruginosa Pneumonia During Chemotherapy.
Neutrophils are essential for immunity to P. aeruginosa (8, 9), the leading cause of bacterial pneumonia in patients with cancer and neutropenia (7). First, we validated our animal model of lethal P. aeruginosa pneumonia in the setting of chemotherapy-induced neutropenia. CY treatment alone without bacterial challenge did not cause death (Fig. 1A). Mice that were not treated with CY survived intranasal (i.n.) infection with P. aeruginosa strain IT4 (10) at 7.7 × 10⁵ cfu. In contrast, when mice were pretreated with CY, a challenge dose of 77 cfu (104-fold less than the dose used for CY-untreated mice) led to 100% mortality (Fig. 1A). Lung histopathology 30 h after challenge demonstrated neutrophil infiltration in the lung of CY-untreated mice (Fig. 1B, Left), which was associated with elevated blood neutrophil numbers (Fig. 1C) and without secondary bacteremia (Fig. 1D). In CY-treated mice, neutrophils were absent in the lung tissue where the bacteria were abundant (Fig. 1B, Right), which was associated with neutropenia (Fig. 1C) and high-grade bacteremia (Fig. 1D). Thus, in the setting of CY-induced neutropenia, even a low dose of P. aeruginosa expanded in the lung and spread systemically, leading to death.
Fig. 1.
Mouse model of immunization and lethal P. aeruginosa pneumonia during chemotherapy-induced neutropenia. (A) Survival of mice ± CY treatment (no. alive/total as indicated) at the challenge doses shown. (B) Representative photomicrographs of lung histology (Top; H&E stain) and immunohistochemistry (IHC) stain for neutrophils (Middle) and P. aeruginosa (Bottom). Blood neutrophil counts (C) and blood P. aeruginosa burden (D) from mice ± CY 30 h after challenge (n = 5 per group; challenge dose of 6.9 × 10⁶ cfu for No CY or 69 cfu for CY). (E) Time line of the standard experimental treatment schedule (Left) and survival of immunized or unimmunized mice after challenge following CY treatment (Right, no. alive/total as indicated). Data combined from two independent experiments (challenge doses of 52–61 cfu) are shown. (F) P. aeruginosa burden in BALF 30 h postchallenge in CY-treated mice ± prior vaccination (n = 20 per group). Data combined from two independent experiments (challenge doses of 68–70 cfu) are shown. Each symbol in the graphs represents one mouse, and error bars represent median with interquartile ranges. Dashed lines represent lower limit of detection. **P < 0.01 and ***P < 0.001 by the Mann–Whitney test; #P < 0.0001 by log-rank test.
To test the idea that a neutropenic host could be protected against lethal P. aeruginosa infection by vaccination, mice were i.n. immunized with three weekly doses of live-attenuated P. aeruginosa vaccine strain PAO1ΔaroA (11) and then challenged 4 wk later i.n. with wild-type P. aeruginosa strain IT4 (a strain bearing heterologous lipopolysaccharide O-antigens compared with the vaccine stain) following three doses of CY (Fig. 1E, Left). Immunized mice were protected from the lethal infection in the context of CY treatment (Fig. 1E, Right). This vaccine-induced protection was associated with an ∼5-log10 reduction in bacterial load in the lungs (Fig. 1F). Thus, vaccination was protective, even in the absence of neutrophils.
Lung Macrophages Are Required for the Vaccine-Induced Protection During Neutropenia.
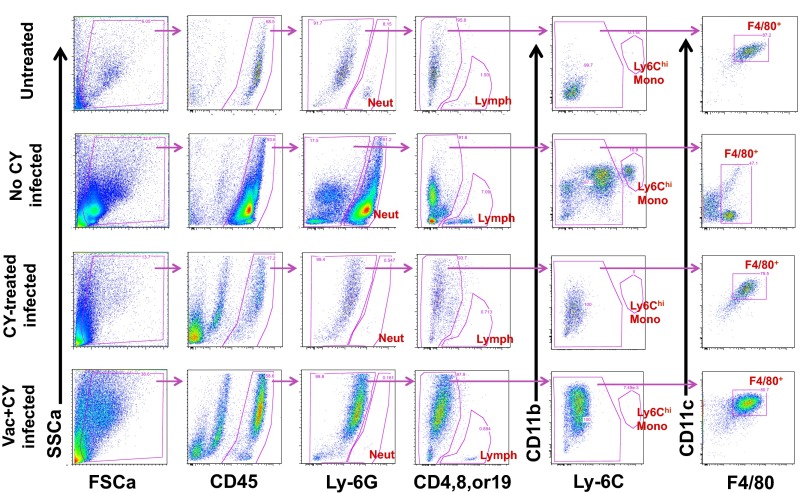
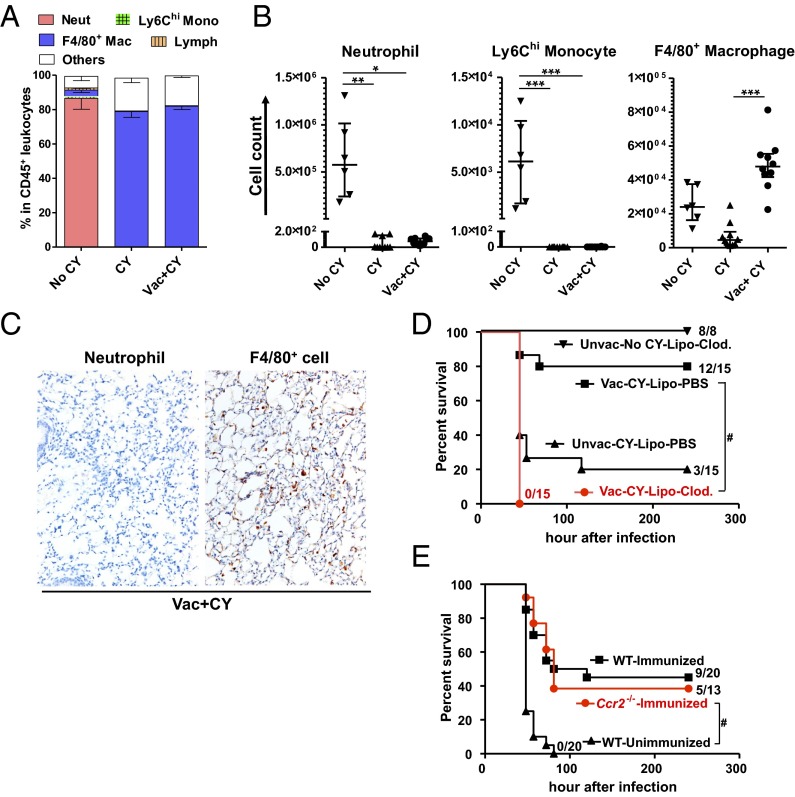
The data in Fig. 1 suggested that vaccination altered the lung immune microenvironment to compensate for the absence of neutrophils. Because phagocytes are the primary terminal effectors in clearance of extracellular bacteria, we quantified the number and proportions of phagocytes in the lung during infection in CY-untreated normal mice (controls) and CY-treated mice with or without preceding vaccination (gating strategy in Fig. S1). In CY-treated mice, all of the phagocytes except for F4/80+ macrophages were depleted from the bronchoalveolar lavage fluid (BALF) regardless of the vaccination history (Fig. 2 A and B). Importantly, prior vaccination was associated with higher numbers of F4/80+ macrophages in the BALF during infection (Fig. 2B). Neutrophil depletion and persistence of F4/80+ cells after CY treatment were also confirmed in the lung parenchyma of immunized mice (Fig. 2C). Thus, macrophages are the primary remnant phagocytes in the lung associated with vaccine-induced protection in the setting of chemotherapy-induced neutropenia.
Fig. S1.
Basic gating strategy used in immune cell analysis from BALF. Representative flow data on BALF samples from each treatment group are shown. Neutrophils (Ly-6Ghi), T or B lymphocytes (CD4+, CD8+, or CD19+), Ly-6Chi monocytes (Ly-6Chi CD11bhi), and F4/80+ macrophages (F4/80+ CD11c variable) were defined as shown. FSCa, forward scatter; SSCa, side scatter; Vac, PAO1ΔaroA-immunized; Vac+CY, immunized plus CY-treated.
Fig. 2.
Macrophages are required for vaccine-induced protection during chemotherapy. Quantitation of immune cell types in BALF during infection expressed as the fraction in total CD45+ leukocytes recovered from the total BALF per mouse (A) or by absolute number in the BALF (B). Mono, monocyte; Neut, neutrophil; Vac, PAO1ΔaroA-immunized; Vac+CY, immunized plus CY-treated. BALF was obtained from untreated mice or CY-treated mice ± prior vaccination 30 h after P. aeruginosa challenge (n = 6–10 per group; 6.8 × 10⁶ cfu for untreated mice and 68 cfu for CY-treated mice). Each symbol represents one mouse, and error bars represent median with interquartile ranges. *P < 0.05, **P < 0.01, and ***P < 0.001 by the Kruskal–Wallis test, followed by Dunn’s multiple comparisons test. (C) IHC stain for neutrophils (negative) or F4/80+ cells (brown) in lung parenchyma of immunized, CY-treated mice 30 h postinfection (69 cfu). A positive neutrophil stain performed side by side with these samples is shown in Fig. 1B. Representative data are shown from five mice. (Magnification: 20×). (D) Survival of immunized, CY-treated mice given either i.n. liposomal clodronate (lipo-Clod.) or lipo-PBS 24 h before challenge (65 cfu; no. alive/total as indicated). Unimmunized, CY-treated mice with i.n. lipo-PBS before challenge (65 cfu) or unimmunized, CY-untreated normal mice with i.n. lipo-Clod. before challenge (5.8 × 10⁵ cfu, performed in an independent experiment from the other groups) were controls. Survival was monitored twice daily starting 24 h postinfection. #P < 0.0001 by log-rank test. Unvac, unvaccinated. (E) Survival of CCR2-deficient mice that were immunized, CY-treated, and challenged (60–69 cfu; no. alive/total as indicated). Immunized or unimmunized wild-type mice that were challenged following CY treatment were controls. Data combined from two independent experiments are shown. #P < 0.0001 by log-rank test.
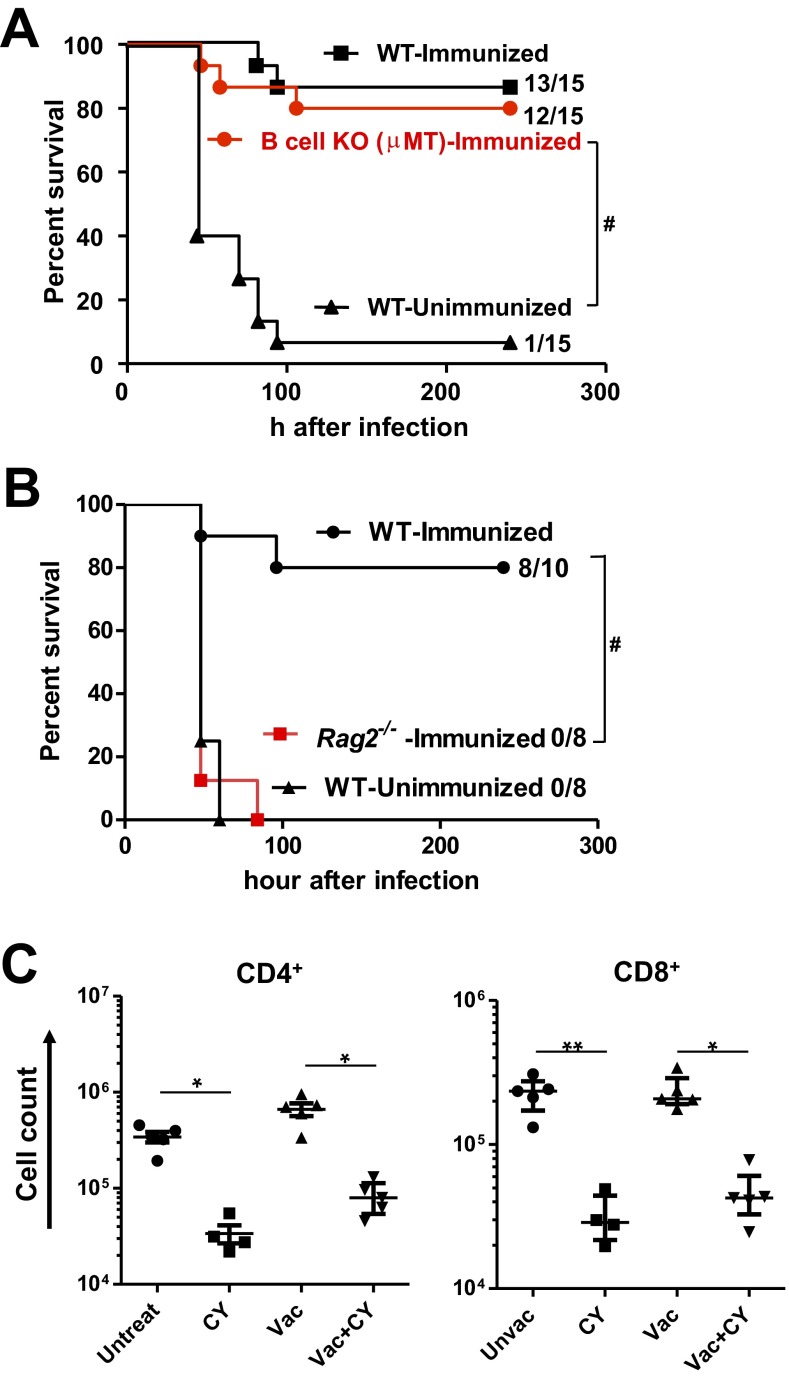
Bacterial clearance by phagocytes is enhanced by humoral and cellular immune effectors induced by the P. aeruginosa live-attenuated vaccines such as antibodies and Th17 cells (12, 13). To determine if adaptive effectors also contribute to protection in the current model, we tested for the vaccine efficacy in B-cell–deficient (µMT) mice and Rag2−/− mice. B-cell–deficient mice were protected by the vaccination (Fig. S2A), confirming that antibodies are not required for the protection. In contrast, vaccine efficacy was abolished in Rag2−/− mice (Fig. S2B), suggesting critical contributions by T cells in bacterial clearance by the remnant phagocytes in the lung. Although numbers of lung CD4+ and CD8+ cells declined ∼10-fold following CY treatment (Fig. S2C), our data suggest certain remnant T-cell populations, such as pulmonary resident memory T cells, are likely to play some roles in phagocyte-mediated bacterial clearance.
Fig. S2.
Vaccine efficacy in B-cell–deficient or Rag2-deficient mice. (A) Survival of μMT−/− mice that were immunized, CY-treated, and challenged (52 cfu, no. alive/total as indicated). Immunized or unimmunized wild-type (WT) mice that were challenged following CY treatment were controls. #P 0.0001 by log-rank test. Data are representative of two independent experiments. (B) Survival of Rag2−/− mice that were immunized, CY-treated, and then challenged (71 cfu, no. alive/total as indicated). Immunized or unimmunized WT mice that were infected following CY treatment were controls. #P 0.0001 by log-rank test. (C) CD4+ or CD8+ T-cell numbers in the lungs from mice treated as indicated (n = 4–5 per group). Each symbol represents one mouse, and error bars represent median with interquartile ranges. *P < 0.05 and **P < 0.01 by the Kruskal–Wallis test, followed by Dunn’s multiple comparisons test, where comparisons were made between untreated (Untreat) vs. CY-treated (CY) and Vac vs. Vac+CY to determine the effect of CY on T-cell numbers.
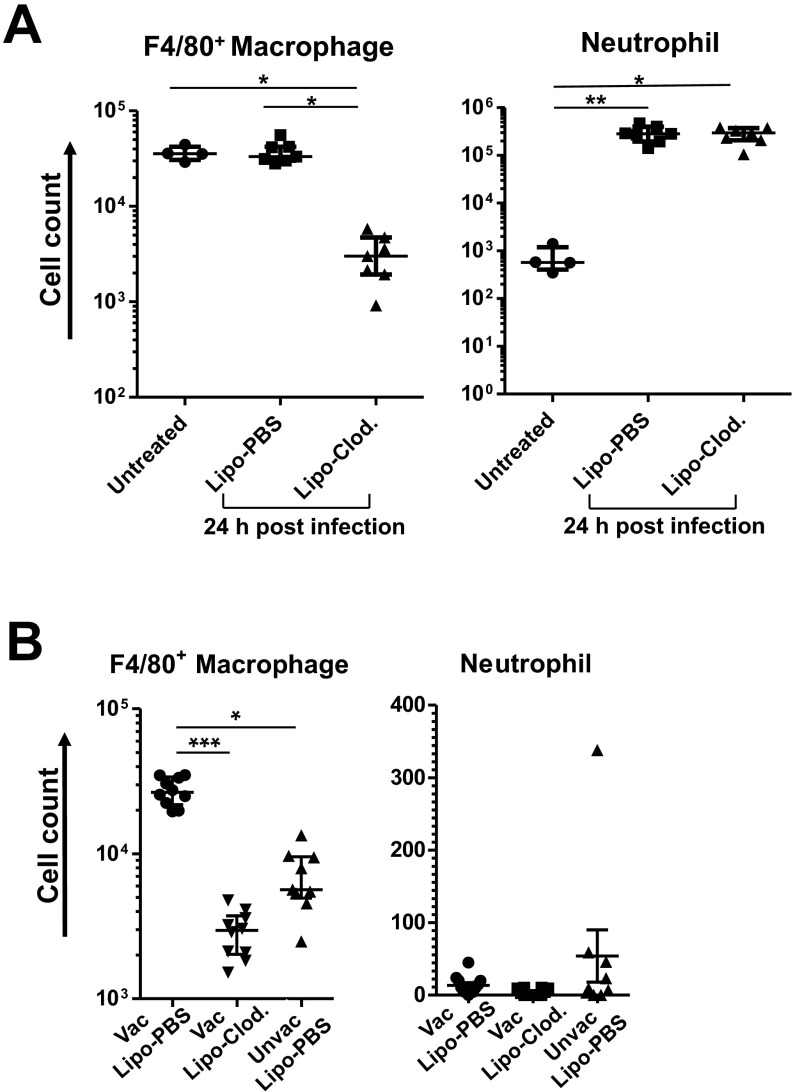
Next, to confirm whether macrophages were the critical effector of the vaccine efficacy during chemotherapy-induced neutropenia, we performed in vivo macrophage depletion experiments. In the absence of CY treatment, i.n. administration of liposomal clodronate before P. aeruginosa challenge (strain IT4, 5.8 × 10⁵ cfu) did not affect the survival of mice (Fig. 2D), where ∼90% of F4/80+ macrophages were depleted from the BALF, but in the presence of neutrophil accumulation during infection (Fig. S3A). In the setting of CY-induced neutropenia, however, an ∼log10 reduction of F4/80+ by i.n. liposomal clodronate (Fig. S3B) abolished the vaccine efficacy (Fig. 2D), confirming that lung macrophages that survive CY treatment are required for the vaccine-induced protection in the setting of neutropenia.
Fig. S3.
Effect of i.n. liposomal clodronate (Clod.) treatment on BALF macrophage and neutrophil counts. Macrophage or neutrophil numbers in total BALF per mouse treated as indicated in the presence (A) or absence (B) of CY treatment. Mice were given either i.n. Clod. or lipo-PBS (control) 24 h before challenge (6.1 × 10⁵ cfu for CY-untreated mice or 63 cfu for CY-treated mice). BALF was obtained 24 h postchallenge (n = 4 for untreated control group, n = 7–10 per group for lipo-Clod.–treated or lipo-PBS–treated). Each symbol represents one mouse, and error bars represent median with interquartile ranges. *P < 0.05, **P < 0.01, and ***P < 0.001 by the Kruskal–Wallis test, followed by Dunn’s multiple comparisons test. Unvac, unvaccinated.
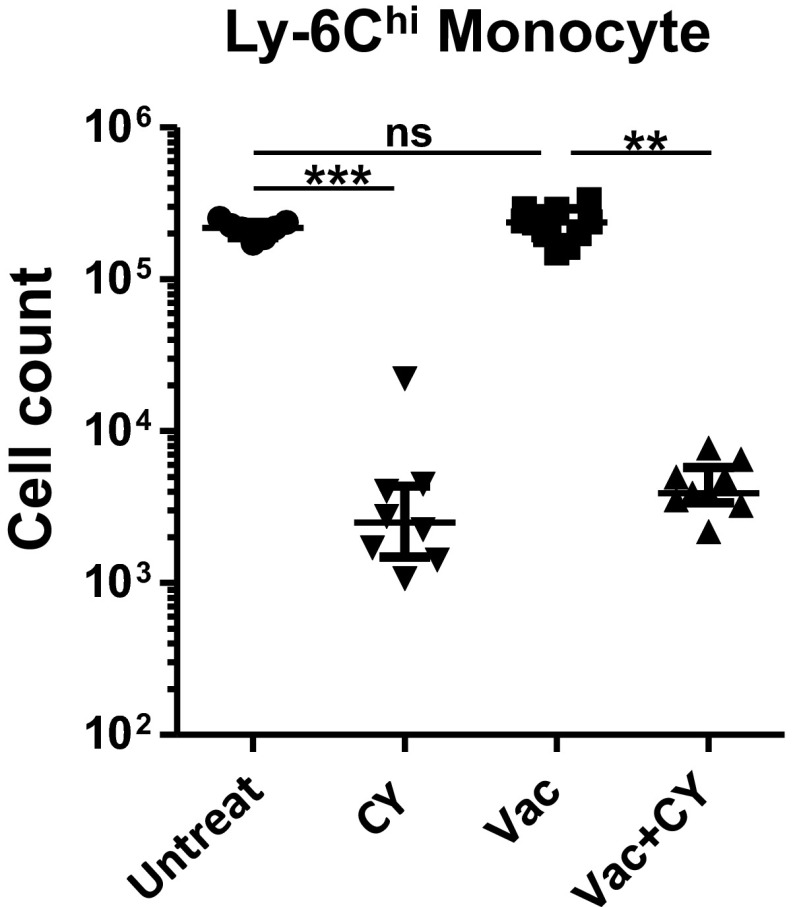
In addition to disrupting neutrophil production, systemic chemotherapy targets monocytes, which originate from the same myeloid progenitor pools as neutrophils and seed the macrophage lung pool. Bone marrow-derived inflammatory monocytes recruited from the blood following signals from the chemokine (C-C motif) ligand 2 (CCL2) are essential for controlling lung infections (14–17). Although CY significantly depleted Ly-6Chi monocytes from the whole lung (Fig. S4), the possibility remained that residual bone marrow-derived monocytes could contribute to the protective effects of vaccination. To distinguish between the contributions of local lung macrophages versus bone marrow-derived macrophages, we immunized chemokine (C-C motif) receptor 2 (CCR2)-deficient mice and challenged with the bacteria after CY treatment. Survival curves were identical between the vaccinated wild-type mice and vaccinated Ccr2−/− mice (Fig. 2E). We therefore concluded a CCR2-independent macrophage population contributed to protective lung immunity in chemotherapy-induced neutropenia.
Fig. S4.
Ly6Chi monocyte counts in whole lung. Cell numbers from mice treated as indicated (n = 7–10 per group). Each symbol represents one mouse, and error bars represent median with interquartile ranges. **P < 0.01 and ***P < 0.001 by the Kruskal–Wallis test, followed by Dunn’s multiple comparisons test, where comparisons were made between Untreat vs. Vac, Untreat vs. CY, and Vac vs. Vac+CY. ns, not significant.
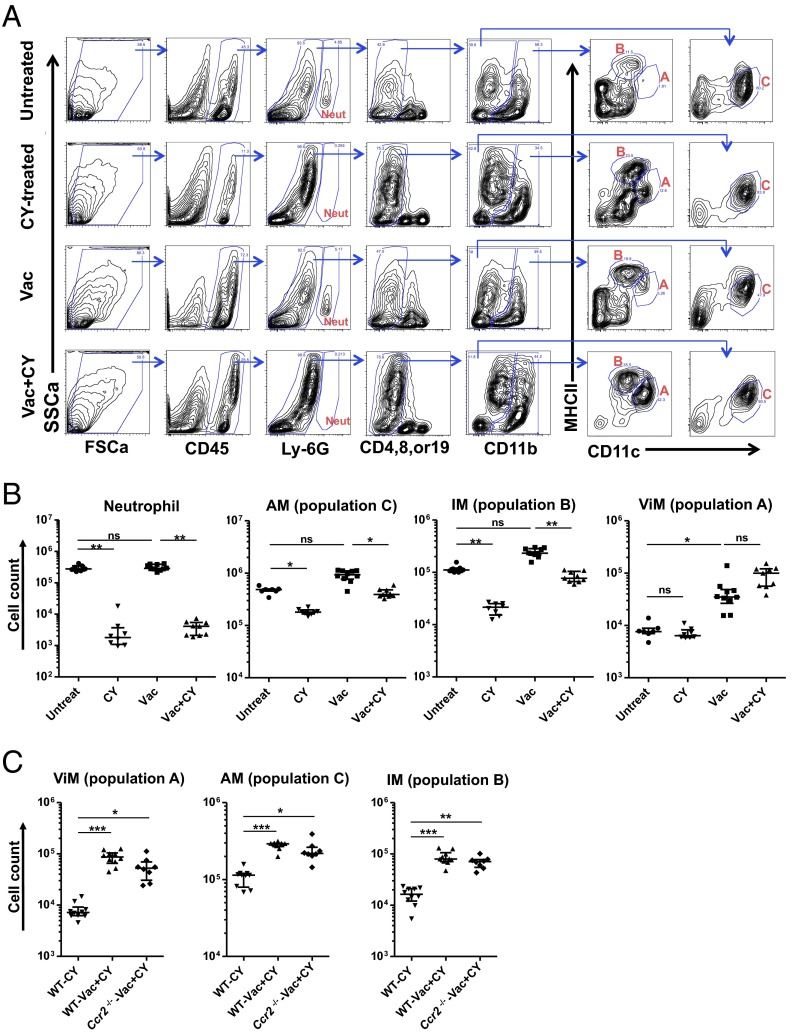
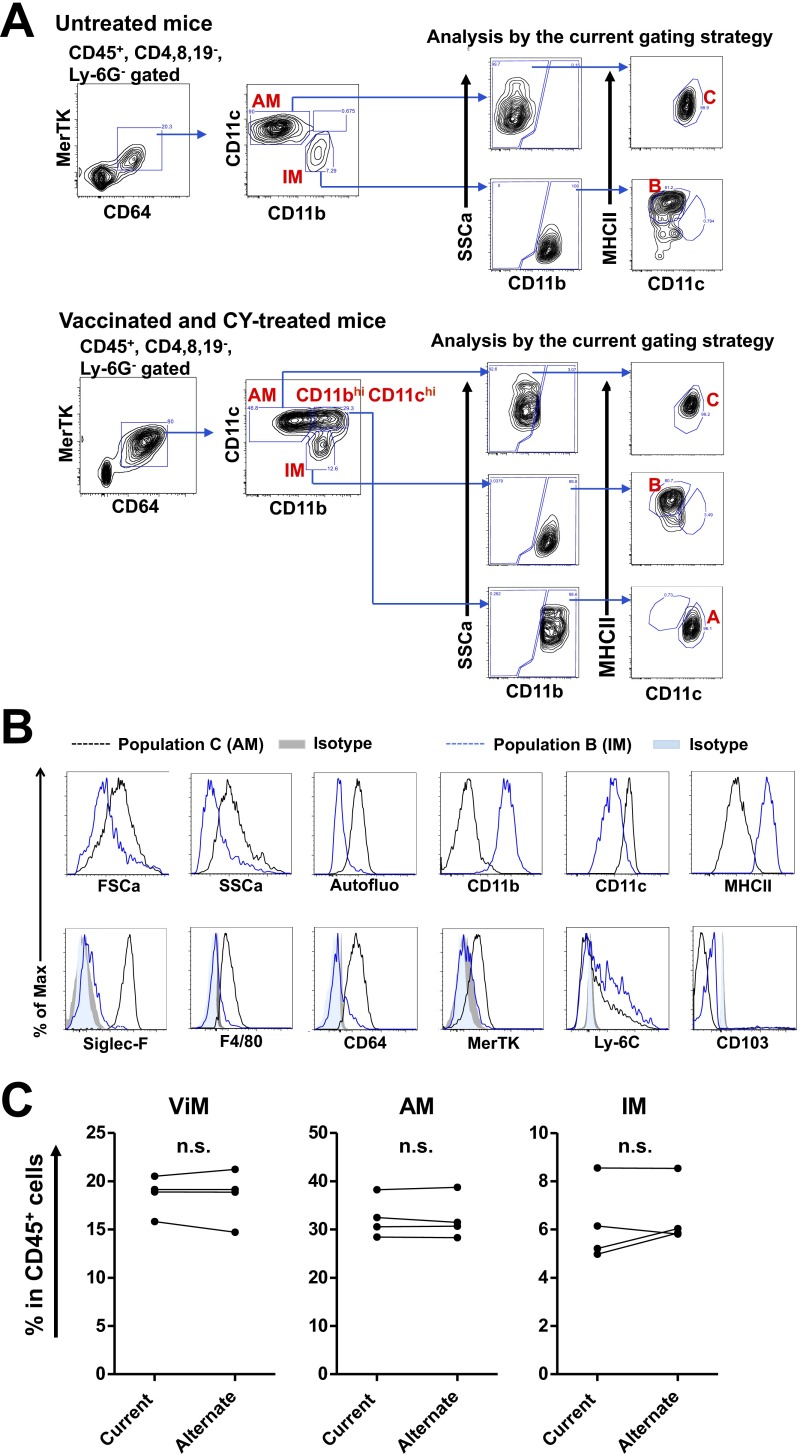
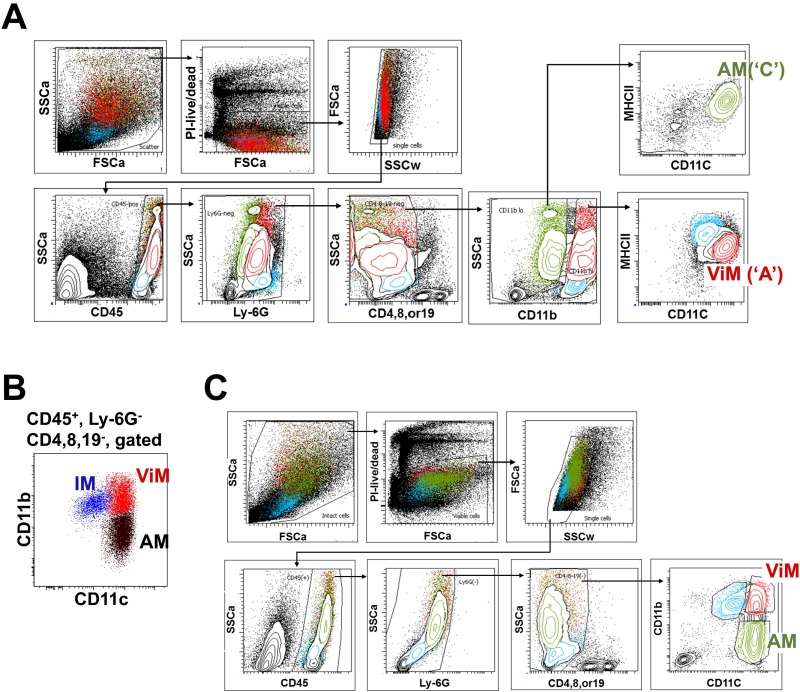
Lung resident macrophages comprise two ontologically distinct groups: alveolar macrophages (AMs) and interstitial macrophages (IMs). AMs originate in the embryo and are self-maintained in adults with very slow turnover at homeostasis (18–20). They patrol air-exposed surfaces of alveoli, are dependent on granulocyte-macrophage (GM)-CSF, and can divide to replace cells lost during infection or damage (21). IMs populate the interstitial spaces between alveoli and are derived from the bone marrow (22). Extensive ontogenic studies and phenotyping of the different myeloid cells have allowed unambiguous discrimination of the different lung myeloid populations (18, 22–27). To identify the lung resident macrophages associated with protection, we undertook a phenotypic analysis of the lung macrophage populations in vaccinated or unvaccinated mice with or without CY treatment. Of note, the analysis was performed in the absence of bacterial challenge to elucidate the baseline lung macrophage subsets in chemotherapy-treated hosts when they first encounter microorganisms. Building upon flow cytometric studies of lung myeloid cells (18, 21–23, 25–27), we adopted a gating scheme that reproducibly identified macrophages in vaccinated, CY-treated lungs (Fig. 3A). CY treatment caused elimination of Ly6G+ cells (neutrophils) as expected. Within the CD45+ Lin− fraction, CD11b was used to identify CD11blo and CD11bhi fractions that were subfractionated with CD11c and MHCII. Using this approach, the CD11blo, CD11chi, MHCIIlo cells were designated as AMs (population “C” in Fig. 3A), which was confirmed by an alternate strategy and additional surface markers (22, 25, 28, 29) (Fig. S5 A and B).
Fig. 3.
Alterations in lung myeloid cell composition induced by immunization and chemotherapy. (A) Representative flow data from collagenase-digested whole-lung samples from untreated, CY-treated, Vac, or Vac+CY mice. Note the three dominant cell populations (populations A, B and C in red) in the lungs from Vac+CY mice. FSCa, forward scatter; SSCa, side scatter. (B) Cell numbers for neutrophils, AMs (population C), IMs (population B), and ViMs (population A) in the lungs from mice treated as indicated (n = 7–10 per group). (C) Macrophage counts in the lungs from wild-type (WT) or CCR2-deficient mice that were immunized and CY-treated. Unimmunized WT mice treated with CY were controls (n = 8–10 per group). Each symbol in the graphs represents one mouse, and error bars represent median with interquartile ranges. *P < 0.05, **P < 0.01, and ***P < 0.001 by the Kruskal–Wallis test, followed by Dunn’s multiple comparisons test (comparisons were made between untreated (Untreat) vs. Vac, Untreat vs. CY, and Vac vs. Vac+CY in B). ns, not significant. Lungs were harvested at 4 wk after the third dose of vaccination and 2 d after the third dose of CY. Data are representative of at least two independent experiments.
Fig. S5.
Verification of the current gating strategy. (A) In untreated mice (Top) or vaccinated plus CY-treated mice (Bottom), AMs and IMs from whole lung were first defined as described by Gibbings et al. (22), and those cells were then reanalyzed with the strategy used in the present study (Fig. 3A). AMs and IMs defined by the alternate strategy fractionated in populations C and B, respectively. In vaccinated plus CY-treated mice, a CD11bhi CD11chi population was found within the CD64+ MerTK+ gate, which fractionated in population A using the current scheme. (B) FSCa and SSca, autofluorescence, and surface marker expression by cell populations C (AMs) and B (IMs) in the lungs of untreated mice as defined in Fig. 3A. Max, maximum. (C) Fraction of each lung macrophage population in total lung leukocytes from vaccinated plus CY-treated mice that were measured by the current or alternate gating scheme using the same samples (n = 4). Each symbol represents one mouse, and data from the same mouse sample are linked together. n.s., not significant by paired t test.
The CD11bhi fraction contained multiple populations that were separated with CD11c and MHCII staining. The CD11bhi, CD11clo, MHCIIhi cells (population “B” in Fig. 3A) were designated IMs, as confirmed by an alternate gating strategy and additional surface markers (22, 25, 28, 29) (Fig. S5 A and B), although we note this population B potentially incudes lung dendritic cell (DC) subsets. Vaccination, with or without CY treatment, resulted in the appearance within the CD11bhi fraction of CD11chi, MHCIIlo cells (population “A” in Fig. 3A). For brevity, we termed these cells “vaccine-induced macrophages” (ViMs). The current gating strategy (Fig. 3A) uses MHCII expression levels to exclude lung DCs from populations A and C, whereas the alternate strategy (Fig. S5A) uses MerTK and CD64 expression to exclude lung DC subsets robustly (29). To rule out the possibility of substantial DC contaminations into population A, B, or C (Fig. 3A) in vaccinated plus CY-treated mice, we compared the fractions of AMs, IMs, or ViMs within total lung leukocytes measured by those two gating schemes using the same samples, and the numbers were not significantly different (Fig. S5C).
ViMs Expand by Vaccination and Are Stable in Number Through Chemotherapy.
Next, we performed a quantitative analysis of ViMs following vaccination. Over the three weekly doses of immunization, ViMs expanded in absolute number as well as in relative proportion within total lung leukocytes when measured at 1 wk after each vaccine dose (Fig. S6A). We next quantified the number of ViMs and the other phagocytes in the lung with or without CY treatment at 4 wk after the third dose of vaccination, at which time point mice were challenged for survival studies. In both vaccinated and unvaccinated mice, when neutrophil numbers precipitously declined after CY treatment (Fig. 3B), the absolute number of AMs (population C) and IMs (population B) also declined following chemotherapy (Fig. 3B). In contrast, ViMs (population A) showed no significant change in absolute number after CY treatment (Fig. 3B) (with a trend for increase in number following CY but only in vaccinated mice) and demonstrated an ∼log10 increase when expressed as a relative proportion in the total lung leukocytes (Fig. S6B). These data were further confirmed by measuring the lung cell counts for ViMs, AMs, IMs, and neutrophils after no, one, two, or three doses of CY. Under these conditions, only ViMs were stable in number, whereas the others declined over the dosing regime (Fig. S6C). Furthermore, for each of these macrophage populations, the lung cell counts in vaccinated, CY-treated mice were comparable between wild-type mice and Ccr2−/− mice (Fig. 3C). Therefore, expansion of the ViMs (CD11bhi, CD11chi, MHCIIlo) by vaccination and persistence during chemotherapy occurred in mice bearing genetic depletion of circulating bone marrow-derived monocytes.
Fig. S6.
Alterations in lung myeloid cell composition induced by immunization and chemotherapy. (A) ViM cell numbers in the lungs from individual mice at 1 wk after the first, second, or third dose of weekly vaccination expressed as the absolute number (Left) or as the fraction in total lung leukocytes (Right). (B) Fractions of each lung macrophage population in total lung leukocytes from mice treated as indicated (n = 7–10 per group). Lungs were harvested at 4 wk after the third dose of vaccination and 2 d after the third dose of CY. (C) Cell numbers for each macrophage population or neutrophils in the lung of immunized mice over repeated doses of CY treatment. Before lung harvest at 4 wk after vaccination, mice were given three doses of CY on days −6, −4, and −2 of harvest; two doses on days −4 and −2 of harvest; a single dose on day −2 of harvest; or no dose (n = 5 per group). Each symbol represents one mouse, and error bars represent median with interquartile ranges. *P < 0.05, **P < 0.01, and ***P < 0.001 by the Kruskal–Wallis test, followed by Dunn’s multiple comparisons test. Comparisons were made between untreated mice versus the others in A and C, whereas in B, comparisons were made between Untreat vs. CY, Untreat vs. Vac, and Vac vs. Vac+CY.
Lung CD11bhi, CD11chi, MHCIIlo Macrophages Are Related to AMs.
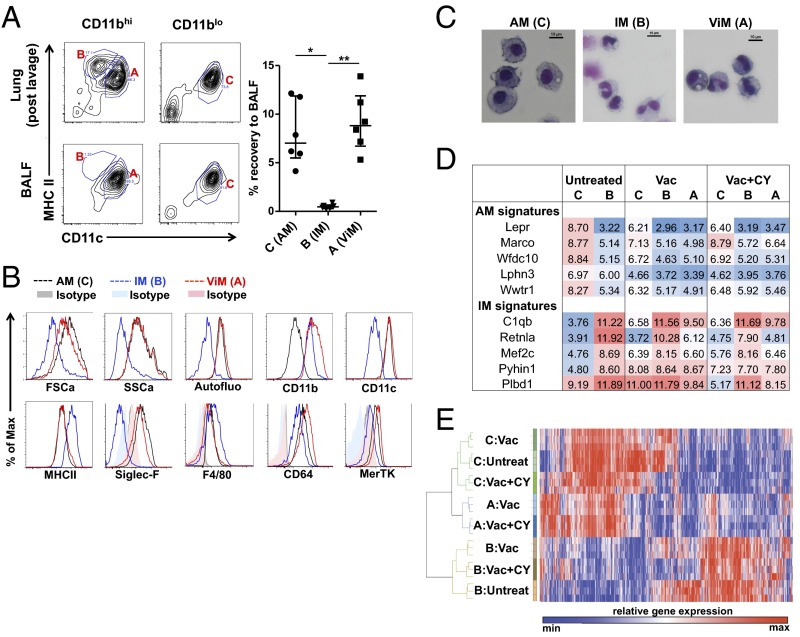
We next sought to determine the relationship of ViMs to other resident lung macrophage populations. AMs populate the air-exposed surfaces of the alveolar sacs and are present in lung lavage fluid, whereas IMs reside in the lung interstitium providing a means to distinguish the anatomical location of the ViMs compared with IMs that are recovered only from whole-lung digests. Comparison of immune cell counts in BALF versus postlavage whole lung from immunized, CY-treated mice revealed that the recovery rate of ViMs by BAL was equivalent to the recovery rate of AMs and ∼20-fold higher than IMs (Fig. 4A), suggesting that ViMs were associated with the air interface of the alveolar sacs at steady state. ViMs were autofluorescent in the FITC channel, sialic acid-binding Ig-like lectin-F+ (Siglec-F+), and F4/80+, features characteristic of AMs (29) (Fig. 4B). However, observation of the cytocentrifuged macrophages revealed that although AMs had morphology consistent with prior reports, where the cells are round in shape with a large round nucleus (23, 26, 27), ViMs were smaller in size with irregular nuclear morphology (Fig. 4C). These data prompted us to take a molecular approach to analyze ViMs further. Recent parabiosis data and advanced flow cytometry approaches have identified markers that distinguish between embryonic-derived AMs and blood-derived macrophages (e.g., IMs) at homeostasis (22). For example, leptin receptor is very highly expressed in AMs relative to all other myeloid cells, and is stably expressed across time of residence in the lung. We investigated the mRNA expression of five markers of AMs (Lepr, Marco, Wfdc10, Lphn3, and Wwtr1) or IMs (C1qb, Retnla, Mefc2, Pyhin1, and Plbd1) in each lung macrophage population. Of note, ViMs are not substantially present in unimmunized normal mice (Fig. 3B). As shown in Fig. 4D, the patterns of expression of the 10 mRNAs showed the expected differences between AMs and IMs from untreated mice. In vaccinated mice with or without CY, the same markers showed new patterns for AMs and ViMs, but not for IMs, suggesting modulation by mucosal immunization 4 wk prior or cytotoxic chemotherapy for AMs and ViMs.
Fig. 4.
Characterization of lung macrophages in the context of immunization and CY treatment. (A) Representative flow data on BALF (Left Lower) or postlavage whole-lung samples (Left Upper) from immunized plus CY-treated mice. (Right) Fraction of the cells recovered from the lungs by bronchoalveolar lavage is shown. Each symbol represents one mouse, and error bars represent median with interquartile ranges. *P < 0.05 and **P < 0.01 by the Kruskal–Wallis test, followed by Dunn’s multiple comparisons test. (B) Flow cytometric analysis of each macrophage population. Max, maximum. (C) Gross morphology of cytocentrifuged macrophages with Giemsa stain. (Scale bars: 10 μm.) (D) Tabulation of relative gene expression (log2[Signal]) associated with homeostatic populations of AMs or IMs as assigned by Gibbings et al. (22). C, B, and A refer to the lung macrophage populations defined in C. (E) Hierarchical clustering of lung macrophages from mice treated as indicated. Shown is a heat map and clustering based on 4,984 robustly expressed RNA transcripts (greater than twofold over background) with greater than twofold differential expression across cell populations.
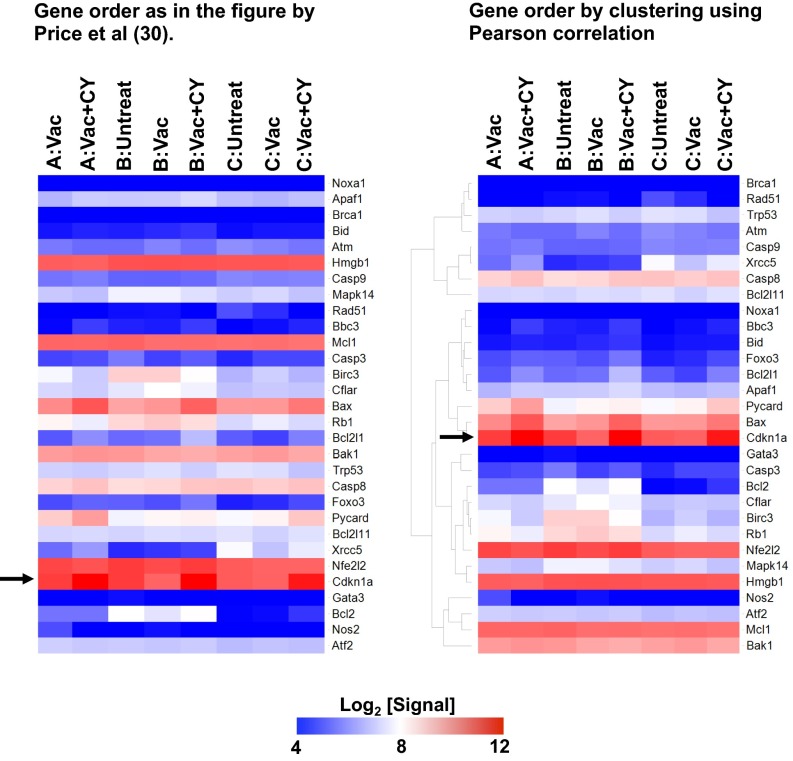
We next isolated AMs and the two CD11bhi macrophage populations from untreated mice; immunized mice; or immunized, CY-treated mice and compared their global transcriptomes. Using the Pearson correlation, we found the ViMs were closely related to AMs but distinct from IMs at the transcriptome level (Fig. 4E). Of note, ViM gene expression profiles were not concordant with the signature of epidermal Langerhans cells that are resistant to ionizing irradiation (30) (Fig. S7). Taken together, cellular and molecular evidence indicates that ViMs, the chemotherapy-stable lung resident macrophages that expand by vaccination, are related to AMs. Because CD11b is modulated by activation on AMs (23, 24), our data are consistent with a model where ViMs are an activated form of resident AMs.
Fig. S7.
Gene expression profiles of lung macrophages in comparison to radiation-resistant epidermal Langerhans cells. Shown are heat maps of relative gene expression (log2 [Signal]) in the lung macrophages regarding the genes tested in the work by Price et al. (30). The order of the genes shown is as in the study by Price et al. (30) (Left) or based on clustering by Pearson correlation (Right). A, B, and C refer to the lung macrophage populations defined in Fig. 3A. The arrow points to Cdkn1a expression.
Physiological Characteristics of ViM.
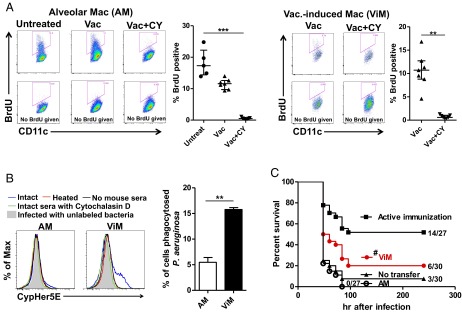
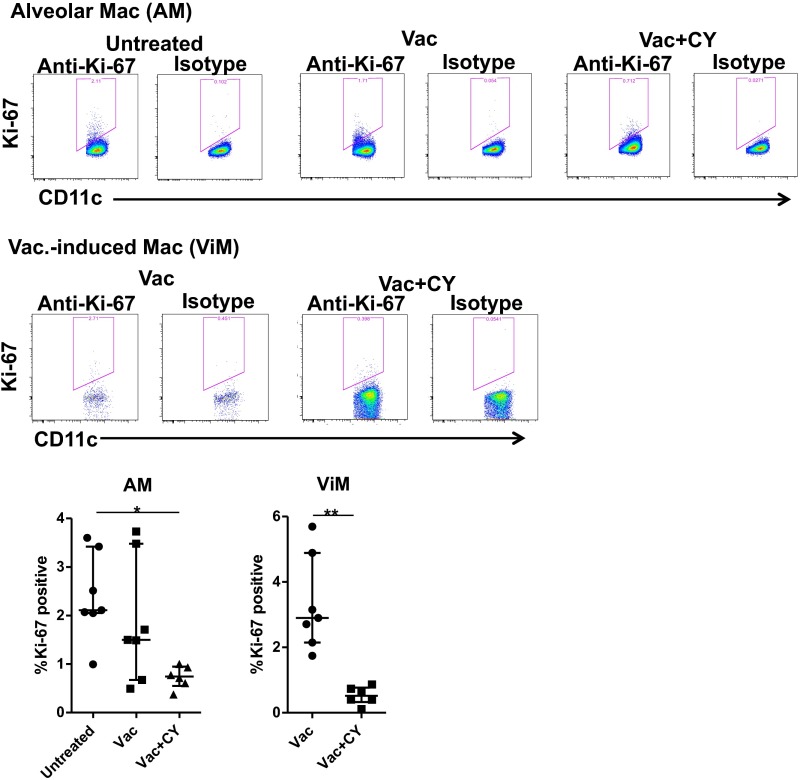
AMs derive from embryonic monocytes that seed the lung and are maintained locally after birth under homeostatic conditions where their replacement with bone marrow-derived macrophages occurs very slowly over years (18, 20, 21, 31). To ensure adequate AM number as the lung grows in size or repairs after damage, AMs have GM-CSF–dependent proliferative capacity (21). Given that ViMs have characteristics of activated AMs, we determined if these macrophages had proliferative capacity. Untreated mice or mice immunized 4 wk prior with or without subsequent CY were treated with BrdU for 3 d, followed by measurement of BrdU incorporation into AMs or ViMs. Without CY, ∼10% or more of the cells were BrdU+ in both macrophage populations (Fig. 5A), indicating those macrophages or their progenitors had undergone cell division in the preceding 72 h. These data were further confirmed with Ki-67 expression by the macrophages (Fig. S8), suggesting that, like AMs, ViMs locally proliferate under homeostasis. BrdU incorporation and Ki-67 expression were reduced by CY treatment (Fig. 5A and Fig. S8), as expected for a cytotoxic drug that targets mitotic cells.
Fig. 5.
ViMs are protective against bacterial infection in neutropenic hosts. (A) BrdU incorporation into lung macrophages in untreated mice or mice at 4 wk after vaccination ± CY (n = 5–7 per group). Mice were labeled i.p. with BrdU for 3 d before lung harvest. Representative flow data and BrdU+ fractions in macrophage (Mac) gates are shown for AMs (Left) and ViMs (Right). Data are representative of two independent experiments. Each symbol represents one mouse, and error bars represent median with interquartile ranges. ***P < 0.001 by the Kruskal–Wallis test, followed by Dunn’s multiple comparisons test for AMs. **P < 0.01 by the Mann–Whitney test for ViMs. (B) Phagocytic activity of AMs and ViMs in vitro. Macrophages isolated from the lungs pooled from Vac+CY-treated mice (n = 17–25 animals) were incubated in vitro with CypHer5E-labeled P. aeruginosa strain IT4 (in vivo challenge strain, LPS O-antigens heterologous to the vaccine strain) for 60 min in the presence of either intact or heat-inactivated sera from PAO1ΔaroA-immunized mice. Representative flow data (Left) and the fluorescence-positive fractions in macrophage gates in the presence of intact sera (Right) are shown. Bars represent mean of data from two independent experiments (three replicates for each). Error bars represent SEM. **P < 0.01 by unpaired t test. (C) Effect of macrophage adoptive transfer on survival (no. alive/total as indicated). AMs or ViMs isolated from the lungs pooled from immunized plus CY-treated mice were intratracheally administered (1 × 10⁵ cells per mouse) to unimmunized CY-treated mice. Recipients were challenged 14 h after the transfer. Unimmunized mice or actively immunized mice (both treated with CY) that did not receive the macrophages were controls. Data combined from two independent experiments (challenge doses of 59–63 cfu) are shown. #P = 0.03023 by log-rank test comparing ViM transfer vs. no transfer.
Fig. S8.
Ki-67 expression by the macrophages. Lung macrophages were isolated from untreated mice or mice at 4 wk after the vaccination ± CY (n = 6–7 per group). Representative flow data (Top) and Ki-67+ fractions in AM or ViM gates (Bottom) are shown. Data are representative of two independent experiments. Each symbol represents one mouse, and error bars represent median with interquartile ranges. *P < 0.05 by the Kruskal–Wallis test, followed by Dunn’s multiple comparisons test for AMs or **P < 0.01 by the Mann–Whitney test for ViMs.
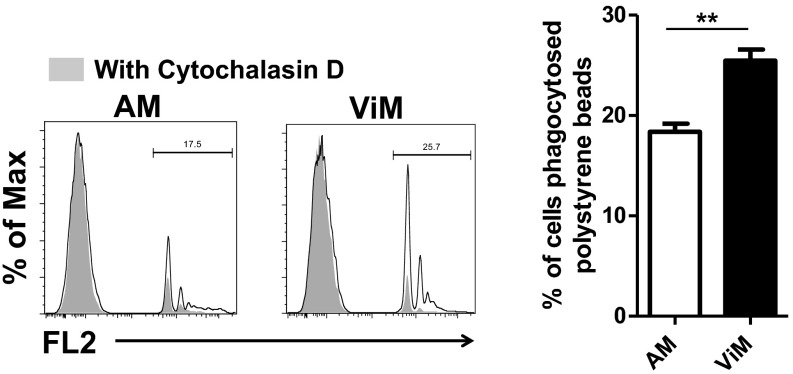
In the absence of neutrophils, even a low dose of P. aeruginosa expanded in the lung and spread systemically (Fig. 1 B–D). However, in vaccinated mice, the bacterial expansion in the lung was suppressed (Fig. 1F), which correlated with the survival advantage (Fig. 1E). To account for this difference in bacterial clearance, we documented the phagocytic capacity of ViMs using fluorescent polystyrene beads or CypHer5E-labeled P. aeruginosa strain IT4. CypHer5E is a pH-sensitive dye that fluoresces only when bacteria are delivered to the acidic environment of phagosomes (32), thus differentiating phagocytosed bacteria from bacteria remaining outside the cell. ViMs phagocytosed both polystyrene beads and bacteria more efficiently than AMs (Fig. 5B and Fig. S9). In this in vitro system, the superior bacterial phagocytosis by ViMs was documented in the presence of intact immunized mouse sera, but not heat-inactivated immune sera (Fig. 5B), suggesting heat-liable factors, such as complement, contribute to the superior phagocytic activity of ViMs.
Fig. S9.
Phagocytosis of latex beads by the macrophages. Lung macrophages isolated from immunized plus CY-treated mice were incubated in vitro with fluorescent latex beads for 60 min. Representative flow data (Left) and the fluorescence-positive fractions in macrophage gates (Right) are shown. Bars represent mean of three to four replicates from an experiment using macrophages pooled from 15 mice. Error bars represent SEM. **P < 0.01 by unpaired t test. FL2, fluorescence channel 2.
Based on the increased phagocytic capacity of ViMs, we next evaluated if direct transfer of purified ViMs into unvaccinated CY-treated mice could provide baseline protection against bacterial challenge. We therefore compared the protective efficacy against lethal P. aeruginosa pneumonia of ViMs versus AMs upon intratracheal adoptive transfer of the cells in unimmunized neutropenic mice. At an intratracheal dose of 1 × 10⁵ cells per mouse, only ViMs prolonged the survival of the neutropenic, infected mice (Fig. 5C). It should be noted that this protective effect was unexpected, because macrophages transferred into the lung, regardless of their origin, rapidly (within days) alter their phenotype (33, 34). Overall, based on depletion (Fig. 2D), population stability (Fig. 3B), ex vivo phagocytosis (Fig. 5B), and transfer (Fig. 5C), we concluded ViMs are essential protective cells in the lung that adapt to the altered local and systemic immune environment caused by the chemotherapy.
Discussion
Infectious complications remain a major obstacle to the effective management of patients with cancer. We conducted this study to elucidate the immune mechanisms that are stable during chemotherapy and could compensate for chemotherapy-induced bone marrow suppression. We have discovered a previously unrecognized lung macrophage population, termed here ViM, which survives chemotherapy and mediates protection against lethal P. aeruginosa pneumonia when activated by vaccination. This finding suggests that immune-mediated “reserve” pathways exist for the host to survive life-threatening infections in the setting of chemotherapy-induced ablation of normal hematopoiesis. ViMs protect the lungs from lethal bacterial infection in the setting of profound neutropenia. Importantly, ViMs are active under coincident chemotherapy-induced monocytopenia, or monocytopenia caused by genetic inactivation of the CCL2/CCR2 axis. Collectively, our results argue that exogenous conditioning of the lung immune microenvironment is a potential strategy to protect the lung during chemotherapy independent of bone marrow seeding of myeloid cells to the lungs. In the current protection model, where ViMs served as the key terminal effector of bacterial clearance, antibodies were not required. In contrast, comparison of vaccine efficacy in B-cell–deficient versus T- and B-cell–deficient mice indicated that T cells were required at some point for the protection. It is possible that lung resident memory T-cell populations assisted the macrophage-mediated bacterial clearance by enhancing, for example, expansion, survival, and/or activity of ViMs. However, to elucidate the precise nature of the T-cell–ViM interplay, the use of tools to deplete or transfer specific T-cell subsets accurately will be required, and at specific times in the vaccine-chemotherapy-infection model.
ViMs are a population of CD11chi, MHCIIlo macrophages within the CD11bhi fraction that increase with vaccination but are not depleted by CY treatment. Four lines of evidence are consistent with the concept that ViMs are closely related to AMs. First, these cells are associated with the airway lumen. Second, at the whole-transcriptome level, ViMs cluster with AMs but not IMs. Third, ViMs are autofluorescent, F4/80+, and Siglec-F+, hallmarks of AMs (26, 27, 29). Fourth, ViMs are observed in CCR2-deficient mice, which have reduced numbers of circulating monocytes. However, we note that ViMs lose the normal AM morphology. Furthermore, hallmark gene expression patterns of lung AMs in homeostasis, such as the leptin receptor mRNA (22), were modulated in ViMs. The simplest interpretation of the totality of the data is that ViMs are a form of activated AM that is locally maintained by proliferation and effectively protects the lung from infections in the absence of neutrophils. Whether ViMs originate from the sessile or nonsessile AMs (35) remains to be elucidated. A different interpretation of these data is that a CCR2-independent blood-derived cell could populate the lung and expand after vaccination. Given that macrophages from nonlung sources rapidly acquire characteristics of lung macrophages after transfer (33, 34), it is possible that a nonresident lung macrophage migrates to the lung and could turn into ViMs. Differentiating between the activated AM versus migratory CCR2-independent models will require use of techniques such as lineage tracing or parabiosis, but in the setting of vaccination, chemotherapy, and lung challenge as described here. Regardless of where the ViMs come from, their functional properties convey protection to the host in chemotherapy-induced neutropenia. ViMs are proliferative to a degree similar to AMs, but their numbers are more stable than AMs under chemotherapeutic duress. The mechanisms whereby ViMs show more enhanced chemotherapy stability than AMs remain unclear at present. We note that this stability was not linked solely to increased expression of cyclin-dependent kinase inhibitor p21 as was reported in radiation resistance by epidermal Langerhans cells (30).
ViMs are highly phagocytic for P. aeruginosa, which is likely to contribute to their ability to eradicate the bacteria efficiently at an early stage of infection. ViMs are also protective against bacterial challenge when transferred into unvaccinated neutropenic hosts. Defining the live-attenuated vaccine component that could effectively expand ViM may lead to a safer vaccine candidate for lung infections in bone marrow-suppressed patients. In addition, we suggest that CD11b could be used as a surrogate marker to identify additional human lung macrophages that are activated and antibacterial, as previously analyzed in patients with respiratory disease (24). As suggested by CD11b up-regulation by AMs following CY treatment in the current mouse model, cytotoxic chemotherapy may also play a role in activation of resident macrophages, and possibly in emergence of ViMs in vaccine-primed lungs. Correlating the human and mouse flow cytometry data or transcriptome data could serve as a means to identify activated lung macrophages important for host defense under a variety of pathological insults.
In conclusion, we demonstrate that exogenous conditioning of the lung microenvironment can expand chemotherapy-stable lung macrophage subsets and protect the chemotherapy-treated host from lethal bacterial infection in the setting of profound bone marrow suppression. This approach may become a framework for new strategies against infectious diseases in the immunocompomised hosts. Finally, we note that medical advances such as systemic chemotherapy, broad radiotherapy, and transplantation were invented recently in the evolutionary history of humans; there is no obvious precedent for these procedures in terms of “natural” adaptation of cells and tissues. Therefore, we conclude that the body has a repertoire of pathways that adapt to broad tissue damage, and the presence of ViMs in the lungs may be one adaptive pathway selected for other host tissue defense purposes.
Materials and Methods
Bacteria.
P. aeruginosa strain PAO1ΔaroA (aroA deletion mutant of strain PAO1; LPS smooth, serogroup O2/O5) was used for vaccination (11). PAO1ΔaroA is an auxotrophic mutant that is highly attenuated, as evidenced by clearance from the lung of normal mice within 100 h (11) and also by inability of systemic dissemination even in neutropenic mice (36). P. aeruginosa strain IT4 (LPS smooth, serogroup O1, heterologous to the vaccine strain) (10), a clinical blood isolate, was used for i.n. challenge. Bacterial preparation and quantitation were as previously described (13).
Mouse Model.
C57BL/6 wild-type mice, Ccr2−/− mice, B-cell–deficient (μMT) mice, and Rag2−/− mice (all C57BL/6 background) were purchased from The Jackson Laboratory. Ccr2−/− mice and Rag2−/− mice were bred in-house under specific pathogen-free conditions. Age- and gender-matched mice were used in each experiment. Mice were used according to protocols approved by the Institutional Animal Care and Use Committee of St. Jude Children’s Research Hospital. A previously described mouse model was used for immunization and infection during chemotherapy-induced neutropenia (37). Briefly, mice at 6–8 wk of age were anesthetized by i.p. ketamine and xylazine for i.n. inoculation of the live-attenuated vaccine three times at weekly intervals using escalating doses of 1 × 10⁸, 5 × 10⁸, and 1 × 10⁹ cfu. From 67–100% of the bacterial inoculum is consistently and rapidly translocated to the lungs from the nose (38). During the fourth week after vaccination, CY (Sigma–Aldrich) was administered i.p. once daily every other day for 3 d (150 mg/kg per dose) to induce profound neutropenia [absolute neutrophil count (ANC) <50 cells per microliter of blood] from 1 d after the final dose of CY until at least 4 d later (9). During CY treatment, mice were kept on drinking water containing 150 μg/mL gentamicin (Research Product International) to suppress gram-negative bacteria in the gastrointestinal tract (9, 37). In survival experiments, at 4 wk (±2 d) after the final dose of vaccination and 1 d after the final dose of CY, mice were anesthetized by i.p. ketamine and xylazine and challenged i.n. with wild-type P. aeruginosa strain IT4 (60–70 cfu as a target dose). Survival was monitored for 10 d after challenge. Age- and gender-matched mice were used for the unimmunized control group. For some experiments, to eliminate macrophages in the airway, clodronate-containing liposomes (39) were administered i.n. to anesthetized mice starting 24 h before bacterial challenge (100 µL per mouse in two divided doses) (9). Liposomes containing PBS were given i.n. to control mice. For histopathology analysis and immunohistochemistry staining, lungs were harvested from euthanized mice and processed as described in SI Materials and Methods.
Adoptive Transfer.
Macrophages were isolated by flow cytometry from collagenase-digested lungs pooled from immunized plus CY-treated mice at 4 wk after the final dose of vaccination and 2 d after the final dose of CY. Unimmunized mice (12- to 13-wk-old female mice) that had been pretreated with three doses of CY were anesthetized with isoflurane, and administered 1 × 10⁵ live cells of macrophages (in 50 μL of PBS) to the lungs through an endotracheal catheter that was placed by visualization of the larynx (40). Recipient mice were challenged i.n. with P. aeruginosa strain IT4 14 h after transfer.
Isolation and Quantitation of Immune Cells from Mice.
Lung immune cells from immunized mice were isolated at 4 wk (±2 d) after the third dose of vaccination and 2 d after the third dose of CY unless otherwise specified. BALF was obtained from euthanized mice by injecting and removing 1 mL of ice-cold calcium- and magnesium-free HBSS through exposed trachea three times. For whole-lung cell analysis or cell sorting, lungs were harvested from unchallenged mice and digested with collagenase as described in SI Materials and Methods. The absolute number of each cell population in individual mice was calculated by the fraction of the cell population in a sample multiplied by total live cell counts in the same sample. Blood samples were obtained by cardiac puncture in euthanized mice and the ANC was measured by an automated complete blood cell count analyzer with manual differential count on blood smears.
Flow Cytometry and Cell Sorting.
After red blood cell lysis, BALF or collagenase-digested lung samples were incubated with anti-CD16/32 antibody (BioLegend) for 20 min on ice and then stained with mAbs (SI Materials and Methods). Ly6Ghi populations and CD4+, CD8+, or CD19+ populations were out-gated from CD45+ populations and then further analyzed with the gating strategies shown in Fig. S1 (BALF samples), Fig. 3A (whole lung), or Fig. S10 (cell sorting).
Fig. S10.
Gating strategy for cell sorting. (A) Used in cell sorting for macrophage morphology, gene expression analysis, and adoptive cell transfer experiments. (B) Populations A, B, and C as defined in Fig. 3A were plotted on the x axis for CD11c and on the y axis for CD11b to verify the strategy shown next. (C) Gating strategy used in cell sorting for phagocytosis assay. This gating scheme was adopted to minimize the interference between mAb-conjugated fluorochromes and fluorescent beads or CypHer5E.
Gene Expression Analysis.
Macrophages were sorted by flow cytometry from collagenase-digested lungs of untreated mice, immunized mice, or immunized plus CY-treated mice at 4 wk after the final dose of vaccination and 2 d after the final dose of CY without bacterial challenge. Five mice from each treatment group were pooled and treated as a single sample to guarantee a large enough number of cells for each assay. Each treatment group consisted of biologically independent triplicates that were processed in three independent experiments. RNA was extracted from the samples using an RNeasy Plus Mini Kit (Qiagen), and the microarray assay was performed using GeneChip Mouse Gene 2.0 ST arrays (Affymetrix) as described in SI Materials and Methods.
Cell Cycle Analysis.
Mice received i.p. BrdU (Sigma–Aldrich) once daily for three consecutive days (200 mg/kg per dose), and lungs were harvested from the euthanized mice 1 d after the final dose of BrdU (41). Collagenase-digested lung cells were stained for surface markers first and then for intranuclear BrdU using a BrdU Flow Kit (BD Biosciences). Ki-67 staining of lung cells was performed using the same kit with substitution of anti–BrdU-APC Ab with anti–Ki-67-APC Ab (Biolegend) (42). Cells were analyzed by flow cytometry for quantification of BrdU+ or Ki-67+ fractions in macrophage gates.
Phagocytosis Assay.
Macrophages were isolated by flow cytometry from collagenase-digested lungs pooled from immunized plus CY-treated mice at 4 wk after the final dose of vaccination and 2 d after the final dose of CY. Cells were incubated in vitro with fluorescent latex beads (43) or CypHer5E-labeled P. aeruginosa strain IT4 (32) for 60 min, and then analyzed by flow cytometry for quantification of the fluorescence-positive fractions. For P. aeruginosa phagocytosis, cells were supplemented with either intact or heat-inactivated mouse sera obtained from PAO1ΔaroA-immunized mice. Cells treated with Cytochalasin D (Sigma–Aldrich) were used for negative controls (44). Further details are provided in SI Materials and Methods.
Statistics.
Nonparametric data were compared by the Mann–Whitney test for pairwise comparisons or by the Kruskal–Wallis test with Dunn’s posttest for comparisons of more than two groups. Parametric data between two groups were compared by unpaired t test. Survival curves were compared by log-rank test. P values of <0.05 were considered as statistically significant. All of the above analyses were performed using GraphPad Prism software. Statistics used in hierarchical clustering of gene expression data are described in SI Materials and Methods.
SI Materials and Methods
Immunohistochemistry.
Mice were euthanized 30 h postchallenge. Lungs were infused with intratracheally injected 10% (vol/vol) neutral buffered formalin (NBF), harvested from the mice, and then fixed by immersion in 10% (vol/vol) NBF. All tissues were embedded in paraffin, sectioned at 4 μm, mounted on positively charged glass slides (Superfrost Plus; Thermo Fisher Scientific), and dried at 60 °C for 20 min. For detection of F4/80+ cells, tissue sections underwent antigen retrieval in a modified citrate buffer, pH 6.1 (Target Retrieval Solution; Dako) at 110 °C for 15 min in a pressure cooker, followed by 30 min in blocking reagent (Background Sniper; Biocare Medical) at room temperature (RT). A rat monoclonal anti-F4/80 antibody (MF480; Invitrogen) diluted 1:50 was applied for 30 min at RT, followed by biotinylated secondary rabbit anti-rat antibody diluted 1:200 (Vector Laboratories) and then SA-HRP (Thermo Fisher Scientific) with 3,3′-diaminobenzidine (DAB) as a chromogenic substrate and a hematoxylin counterstain (all from Thermo Fisher Scientific). For detection of neutrophils, antigen retrieval at 100 °C for 20 min in epitope retrieval solution 2 was performed on a Bond Max immunostainer (Leica Biosystems). A rat monoclonal primary antibody to Ly-6B.2 (7/4) diluted 1:30,000 (NBP2-13077; Novus Biologicals) was applied for 15 min, followed by biotinylated secondary rabbit anti-rat antibody diluted 1:400 (Vector Laboratories) for 10 min and then ready-to-use BOND DAB Enhancer (AR9432; Leica Biosystems) and a hematoxylin counterstain. For detection of Pseudomonas aeruginosa, antigen retrieval at 100 °C for 32 min was completed in cell conditioning 1 buffer on a Discovery Ultra immunostainer (Ventana Medical Systems). A rabbit polyclonal primary antibody to P. aruginosa diluted 1:8,000 (ab68538; Abcam) was applied for 60 min at 37 °C, followed by a 12-min incubation at 37 °C with secondary goat anti-rabbit polyclonal antibodies labeled with a proprietary hapten nitropyrazole, followed by another 12 min at RT with an alkaline phosphatase-conjugated mouse mAb to nitropyrazole, and then developed with Discovery Red chromogen and a hematoxylin counterstain (all from Ventana Medical Systems).
Lung Digestion with Collagenase and Red Blood Cell Lysis.
Lungs were minced by scissors in cell culture media [RPMI with 10% (vol/vol) heat-inactivated FBS and 2 mM l-alanyl–l-glutamine] containing 2 mg/mL collagenase type II (Worthington), incubated for 45 min at 37 °C, and then mushed through a 70-μm cell strainer. BALF or collagenase-digested lung samples were centrifuged and resuspended in red blood cell lysis buffer (155 mM ammonium chloride, 10 mM potassium bicarbonate, and 0.1 mM EDTA) for 5 min at RT, washed with PBS, and then resuspended in the cell culture media for subsequent analysis.
Flow Cytometry and Cell Sorting.
After Fc receptor blocking, cells were incubated with appropriate combinations of mAbs for 30 min on ice in the dark and then washed with PBS containing 1 mg/mL BSA (Gibco). Fluorochrome-conjugated mAbs used in the study include the following: anti–CD45-BV605 (clone 30-F11); CD3-FITC (17A2); CD4-phycoerythrin (PE)-Cy7 or-eFluoro450 (clone RM4-4); CD8-PE-Cy7 or -Alexa700 (clone 53-6.7); CD19-PE-Cy7 (clone 6D5); Ly6G-FITC (clone 1A8); Ly-6C-PE (clone HK1.4); MHCII-peridinin-chlorophyll proteins (PerCP)-Cy5.5 (clone M5/114.15.2); CD11b-allophycocyanin (APC)-eFluor 780, -APC, or -PE (clone M1/70); CD11c-eFluor450 (clone N418); F4/80-APC (clone BM8); CD64-APC (clone X 54-5/7.1); Siglec-F-PE (clone E50-2440); MerTK-PE (clone DS5MMER); CD103-PE (clone 2E7); BrdU-APC (APC BrdU Flow Kit; BD Biosciences); Ki-67-APC (clone 16A8); and isotype controls. MAbs were purchased from BioLegend, eBioscience, or BD Biosciences. Flow cytometric data were acquired by LSRFortessa with FACSDiva software (BD Biosciences) and analyzed with FlowJo software (TreeStar). FACSAria (BD Biosciences) was used for cell sorting.
Microarray.
Total RNA within a range of 4–12 ng was amplified using the Ovation Pico WTA System V2 (Nugen Technologies). Then, 5 μg of amplified cDNA was labeled using the Encore Biotin Module (Nugen Technologies). After labeling, 3.4 μg of labeled cDNA was hybridized to GeneChip Mouse Gene 2.0 ST arrays (Affymetrix), and the arrays were then stained and scanned according to the manufacturer’s instructions. RNA transcript signals were summarized using the robust multichip algorithm (RMA) method (45).
Hierarchical Clustering.
A subset of robust and variable transcripts was used for hierarchical cluster analysis. These transcripts were selected by setting a threshold where the Max(GroupSignal) was >1 log (twofold) higher than the average background signal observed on antigenomic control probes, and where the Max(GroupSignal) was >1 log (twofold) higher than the Min(GroupSignal). Agglomerative hierarchical clustering was performed on samples and transcripts using GENE-E software (www.broadinstitute.org/cancer/software/GENE-E/index.html). The data matrix comprised log2 [RMA signal] values as the data input. The Pearson correlation method was used to determine cluster similarity, and the average linkage method [Unweighted Pair Group Method with Arithmetic Mean (UPGMA)] was used to define cluster linkage.
Phagocytosis Assay.
Macrophages were suspended in cell culture media [RPMI with 10% (vol/vol) heat-inactivated FBS and 2 mM l-alanyl–l-glutamine], aliquoted on a 96-well plate (105 cells per well for bead phagocytosis, 0.5 × 10⁵ cells per well for P. aeruginosa phagocytosis), and incubated for 3 h at 37 °C before the assay. For bead phagocytosis, 1.0 μm of carboxylate-modified fluorescent polystyrene microspheres (excitation/emission of 488/560 nm; Invitrogen) (43) was added to the macrophages (10 beads per cell), followed by incubation for 60 min at 37 °C. For fluorescent labeling of the bacteria, P. aeruginosa strain IT4 was grown to logarithmic growth phase in tryptic soy broth, washed with PBS, and then suspended in 0.1 M sodium carbonate (pH 9.0) with 10 mg/mL CypHer5E mono NHS ester (GE Healthcare Life Science) for 2 h at RT (32). The labeled bacteria were washed with PBS, diluted in the cell culture media, and added to the macrophages (∼20 cfu per cell) in the presence or absence of either intact or heat-inactivated (56 °C for 30 min) mouse sera [40% (vol/vol) in final] obtained from PAO1ΔaroA-immunized mice at 4 wk after the final dose of immunization. Macrophages with the labeled bacteria were centrifuged in a 96-well plate at 400 × g for 5 min at 4 °C and then incubated for 60 min at 37 °C. After incubation with the beads or bacteria, macrophages were washed with the cell culture media, incubated on ice for 30 min, and then harvested from the 96-well plate for flow cytometry. Cells treated with 20 μM Cytochalasin D (Sigma–Aldrich) from 30 min before infection until the end of infection were used for negative controls (44).
Acknowledgments
We thank Drs. Jon McCullers, Terrence Geiger, and Joshua Wolf for discussion; Dr. Richard Ashmun for flow cytometry cell sorting; Dr. Nico van Rooijen for provision of liposomal PBS and clodronate; Mr. Jay Morris and Ms. Melanie Loyd for gene expression assay; and Ms. Meifen Lu for immunohistochemistry staining. This work was supported by a Pediatric Infectious Diseases Society-St. Jude Basic Research Fellowship Grant (to A.K.), Department of Health and Human Services Contract HHSN272201400006C (to P.G.T.), National Institute of Allergy and Infectious Diseases Grant R01AI027913 (to E.I.T.), National Cancer Institute Cancer Center Support Grant P30 CA21765, and the American Lebanese Syrian Associated Charities.
Footnotes
The authors declare no conflict of interest.
This article is a PNAS Direct Submission.
Data deposition: The data reported in this paper have been deposited in the Gene Expression Omnibus (GEO) database, www.ncbi.nlm.nih.gov/geo (accession no. GSE85336).
This article contains supporting information online at www.pnas.org/lookup/suppl/doi:10.1073/pnas.1607787113/-/DCSupplemental.
References
- 1.Joensuu H. Systemic chemotherapy for cancer: From weapon to treatment. Lancet Oncol. 2008;9(3):304. doi: 10.1016/S1470-2045(08)70075-5. [DOI] [PubMed] [Google Scholar]
- 2.Christopher MJ, Link DC. Regulation of neutrophil homeostasis. Curr Opin Hematol. 2007;14(1):3–8. doi: 10.1097/00062752-200701000-00003. [DOI] [PubMed] [Google Scholar]
- 3.Freifeld AG, et al. Infectious Diseases Society of America Clinical practice guideline for the use of antimicrobial agents in neutropenic patients with cancer: 2010 update by the infectious diseases society of america. Clin Infect Dis. 2011;52(4):e56–e93. doi: 10.1093/cid/cir073. [DOI] [PubMed] [Google Scholar]
- 4.Bodey GP, Buckley M, Sathe YS, Freireich EJ. Quantitative relationships between circulating leukocytes and infection in patients with acute leukemia. Ann Intern Med. 1966;64(2):328–340. doi: 10.7326/0003-4819-64-2-328. [DOI] [PubMed] [Google Scholar]
- 5.Rosenberg PS, et al. Severe Chronic Neutropenia International Registry The incidence of leukemia and mortality from sepsis in patients with severe congenital neutropenia receiving long-term G-CSF therapy. Blood. 2006;107(12):4628–4635. doi: 10.1182/blood-2005-11-4370. [DOI] [PMC free article] [PubMed] [Google Scholar]
- 6.Mehta HM, Malandra M, Corey SJ. G-CSF and GM-CSF in neutropenia. J Immunol. 2015;195(4):1341–1349. doi: 10.4049/jimmunol.1500861. [DOI] [PMC free article] [PubMed] [Google Scholar]
- 7.Vento S, Cainelli F, Temesgen Z. Lung infections after cancer chemotherapy. Lancet Oncol. 2008;9(10):982–992. doi: 10.1016/S1470-2045(08)70255-9. [DOI] [PubMed] [Google Scholar]
- 8.Sun L, et al. Effect of IL-10 on neutrophil recruitment and survival after Pseudomonas aeruginosa challenge. Am J Respir Cell Mol Biol. 2009;41(1):76–84. doi: 10.1165/rcmb.2008-0202OC. [DOI] [PMC free article] [PubMed] [Google Scholar]
- 9.Koh AY, Priebe GP, Ray C, Van Rooijen N, Pier GB. Inescapable need for neutrophils as mediators of cellular innate immunity to acute Pseudomonas aeruginosa pneumonia. Infect Immun. 2009;77(12):5300–5310. doi: 10.1128/IAI.00501-09. [DOI] [PMC free article] [PubMed] [Google Scholar]
- 10.Priebe GP, Meluleni GJ, Coleman FT, Goldberg JB, Pier GB. Protection against fatal Pseudomonas aeruginosa pneumonia in mice after nasal immunization with a live, attenuated aroA deletion mutant. Infect Immun. 2003;71(3):1453–1461. doi: 10.1128/IAI.71.3.1453-1461.2003. [DOI] [PMC free article] [PubMed] [Google Scholar]
- 11.Priebe GP, et al. Construction and characterization of a live, attenuated aroA deletion mutant of Pseudomonas aeruginosa as a candidate intranasal vaccine. Infect Immun. 2002;70(3):1507–1517. doi: 10.1128/IAI.70.3.1507-1517.2002. [DOI] [PMC free article] [PubMed] [Google Scholar]
- 12.Priebe GP, et al. IL-17 is a critical component of vaccine-induced protection against lung infection by lipopolysaccharide-heterologous strains of Pseudomonas aeruginosa. J Immunol. 2008;181(7):4965–4975. doi: 10.4049/jimmunol.181.7.4965. [DOI] [PMC free article] [PubMed] [Google Scholar]
- 13.Kamei A, Coutinho-Sledge YS, Goldberg JB, Priebe GP, Pier GB. Mucosal vaccination with a multivalent, live-attenuated vaccine induces multifactorial immunity against Pseudomonas aeruginosa acute lung infection. Infect Immun. 2011;79(3):1289–1299. doi: 10.1128/IAI.01139-10. [DOI] [PMC free article] [PubMed] [Google Scholar]
- 14.Serbina NV, Hohl TM, Cherny M, Pamer EG. Selective expansion of the monocytic lineage directed by bacterial infection. J Immunol. 2009;183(3):1900–1910. doi: 10.4049/jimmunol.0900612. [DOI] [PMC free article] [PubMed] [Google Scholar]
- 15.Samstein M, et al. Essential yet limited role for CCR2⁺ inflammatory monocytes during Mycobacterium tuberculosis-specific T cell priming. eLife. 2013;2:e01086. doi: 10.7554/eLife.01086. [DOI] [PMC free article] [PubMed] [Google Scholar]
- 16.Xiong H, et al. Distinct contributions of neutrophils and CCR2+ monocytes to pulmonary clearance of different Klebsiella pneumoniae strains. Infect Immun. 2015;83(9):3418–3427. doi: 10.1128/IAI.00678-15. [DOI] [PMC free article] [PubMed] [Google Scholar]
- 17.Epelman S, Lavine KJ, Randolph GJ. Origin and functions of tissue macrophages. Immunity. 2014;41(1):21–35. doi: 10.1016/j.immuni.2014.06.013. [DOI] [PMC free article] [PubMed] [Google Scholar]
- 18.Guilliams M, et al. Alveolar macrophages develop from fetal monocytes that differentiate into long-lived cells in the first week of life via GM-CSF. J Exp Med. 2013;210(10):1977–1992. doi: 10.1084/jem.20131199. [DOI] [PMC free article] [PubMed] [Google Scholar]
- 19.Lavin Y, Mortha A, Rahman A, Merad M. Regulation of macrophage development and function in peripheral tissues. Nat Rev Immunol. 2015;15(12):731–744. doi: 10.1038/nri3920. [DOI] [PMC free article] [PubMed] [Google Scholar]
- 20.Ginhoux F, Guilliams M. Tissue-resident macrophage ontogeny and homeostasis. Immunity. 2016;44(3):439–449. doi: 10.1016/j.immuni.2016.02.024. [DOI] [PubMed] [Google Scholar]
- 21.Hashimoto D, et al. Tissue-resident macrophages self-maintain locally throughout adult life with minimal contribution from circulating monocytes. Immunity. 2013;38(4):792–804. doi: 10.1016/j.immuni.2013.04.004. [DOI] [PMC free article] [PubMed] [Google Scholar]
- 22.Gibbings SL, et al. Transcriptome analysis highlights the conserved difference between embryonic and postnatal-derived alveolar macrophages. Blood. 2015;126(11):1357–1366. doi: 10.1182/blood-2015-01-624809. [DOI] [PMC free article] [PubMed] [Google Scholar]
- 23.Duan M, et al. Distinct macrophage subpopulations characterize acute infection and chronic inflammatory lung disease. J Immunol. 2012;189(2):946–955. doi: 10.4049/jimmunol.1200660. [DOI] [PubMed] [Google Scholar]
- 24.Duan M, et al. 2016. CD11b immunophenotyping identifies inflammatory profiles in the mouse and human lungs. Mucosal Immunol 9(2):550–563ol.
- 25.Gautier EL, et al. Immunological Genome Consortium Gene-expression profiles and transcriptional regulatory pathways that underlie the identity and diversity of mouse tissue macrophages. Nat Immunol. 2012;13(11):1118–1128. doi: 10.1038/ni.2419. [DOI] [PMC free article] [PubMed] [Google Scholar]
- 26.Misharin AV, Morales-Nebreda L, Mutlu GM, Budinger GR, Perlman H. Flow cytometric analysis of macrophages and dendritic cell subsets in the mouse lung. Am J Respir Cell Mol Biol. 2013;49(4):503–510. doi: 10.1165/rcmb.2013-0086MA. [DOI] [PMC free article] [PubMed] [Google Scholar]
- 27.Zaynagetdinov R, et al. Identification of myeloid cell subsets in murine lungs using flow cytometry. Am J Respir Cell Mol Biol. 2013;49(2):180–189. doi: 10.1165/rcmb.2012-0366MA. [DOI] [PMC free article] [PubMed] [Google Scholar]
- 28.Jakubzick C, et al. Minimal differentiation of classical monocytes as they survey steady-state tissues and transport antigen to lymph nodes. Immunity. 2013;39(3):599–610. doi: 10.1016/j.immuni.2013.08.007. [DOI] [PMC free article] [PubMed] [Google Scholar]
- 29.Kopf M, Schneider C, Nobs SP. The development and function of lung-resident macrophages and dendritic cells. Nat Immunol. 2015;16(1):36–44. doi: 10.1038/ni.3052. [DOI] [PubMed] [Google Scholar]
- 30.Price JG, et al. CDKN1A regulates Langerhans cell survival and promotes Treg cell generation upon exposure to ionizing irradiation. Nat Immunol. 2015;16(10):1060–1068. doi: 10.1038/ni.3270. [DOI] [PMC free article] [PubMed] [Google Scholar]
- 31.Perdiguero EG, Geissmann F. The development and maintenance of resident macrophages. Nat Immunol. 2016;17(1):2–8. doi: 10.1038/ni.3341. [DOI] [PMC free article] [PubMed] [Google Scholar]
- 32.Beletskii A, et al. High-throughput phagocytosis assay utilizing a pH-sensitive fluorescent dye. Biotechniques. 2005;39(6):894–897. doi: 10.2144/000112001. [DOI] [PubMed] [Google Scholar]
- 33.van de Laar L, et al. Yolk sac macrophages, fetal liver, and adult monocytes can colonize an empty niche and develop into functional tissue-resident macrophages. Immunity. 2016;44(4):755–768. doi: 10.1016/j.immuni.2016.02.017. [DOI] [PubMed] [Google Scholar]
- 34.Lavin Y, et al. Tissue-resident macrophage enhancer landscapes are shaped by the local microenvironment. Cell. 2014;159(6):1312–1326. doi: 10.1016/j.cell.2014.11.018. [DOI] [PMC free article] [PubMed] [Google Scholar]
- 35.Westphalen K, et al. Sessile alveolar macrophages communicate with alveolar epithelium to modulate immunity. Nature. 2014;506(7489):503–506. doi: 10.1038/nature12902. [DOI] [PMC free article] [PubMed] [Google Scholar]
- 36.Koh AY, Priebe GP, Pier GB. Virulence of Pseudomonas aeruginosa in a murine model of gastrointestinal colonization and dissemination in neutropenia. Infect Immun. 2005;73(4):2262–2272. doi: 10.1128/IAI.73.4.2262-2272.2005. [DOI] [PMC free article] [PubMed] [Google Scholar]
- 37.Kamei A, et al. Collaboration between macrophages and vaccine-induced CD4+ T cells confers protection against lethal Pseudomonas aeruginosa pneumonia during neutropenia. J Infect Dis. 2013;207(1):39–49. doi: 10.1093/infdis/jis657. [DOI] [PMC free article] [PubMed] [Google Scholar]
- 38.Allewelt M, Coleman FT, Grout M, Priebe GP, Pier GB. Acquisition of expression of the Pseudomonas aeruginosa ExoU cytotoxin leads to increased bacterial virulence in a murine model of acute pneumonia and systemic spread. Infect Immun. 2000;68(7):3998–4004. doi: 10.1128/iai.68.7.3998-4004.2000. [DOI] [PMC free article] [PubMed] [Google Scholar]
- 39.Van Rooijen N, Sanders A. Liposome mediated depletion of macrophages: Mechanism of action, preparation of liposomes and applications. J Immunol Methods. 1994;174(1-2):83–93. doi: 10.1016/0022-1759(94)90012-4. [DOI] [PubMed] [Google Scholar]
- 40.Happle C, et al. Pulmonary transplantation of macrophage progenitors as effective and long-lasting therapy for hereditary pulmonary alveolar proteinosis. Sci Transl Med. 2014;6(250):250ra113. doi: 10.1126/scitranslmed.3009750. [DOI] [PubMed] [Google Scholar]
- 41.Balu DT, et al. Flow cytometric analysis of BrdU incorporation as a high-throughput method for measuring adult neurogenesis in the mouse. J Pharmacol Toxicol Methods. 2009;59(2):100–107. doi: 10.1016/j.vascn.2008.12.002. [DOI] [PMC free article] [PubMed] [Google Scholar]
- 42.Challen GA, Boles NC, Chambers SM, Goodell MA. Distinct hematopoietic stem cell subtypes are differentially regulated by TGF-beta1. Cell Stem Cell. 2010;6(3):265–278. doi: 10.1016/j.stem.2010.02.002. [DOI] [PMC free article] [PubMed] [Google Scholar]
- 43.Steinkamp JA, Wilson JS, Saunders GC, Stewart CC. Phagocytosis: Flow cytometric quantitation with fluorescent microspheres. Science. 1982;215(4528):64–66. doi: 10.1126/science.7053559. [DOI] [PubMed] [Google Scholar]
- 44.DeLoid GM, Sulahian TH, Imrich A, Kobzik L. Heterogeneity in macrophage phagocytosis of Staphylococcus aureus strains: High-throughput scanning cytometry-based analysis. PLoS One. 2009;4(7):e6209. doi: 10.1371/journal.pone.0006209. [DOI] [PMC free article] [PubMed] [Google Scholar]
- 45.Irizarry RA, et al. Exploration, normalization, and summaries of high density oligonucleotide array probe level data. Biostatistics. 2003;4(2):249–264. doi: 10.1093/biostatistics/4.2.249. [DOI] [PubMed] [Google Scholar]


