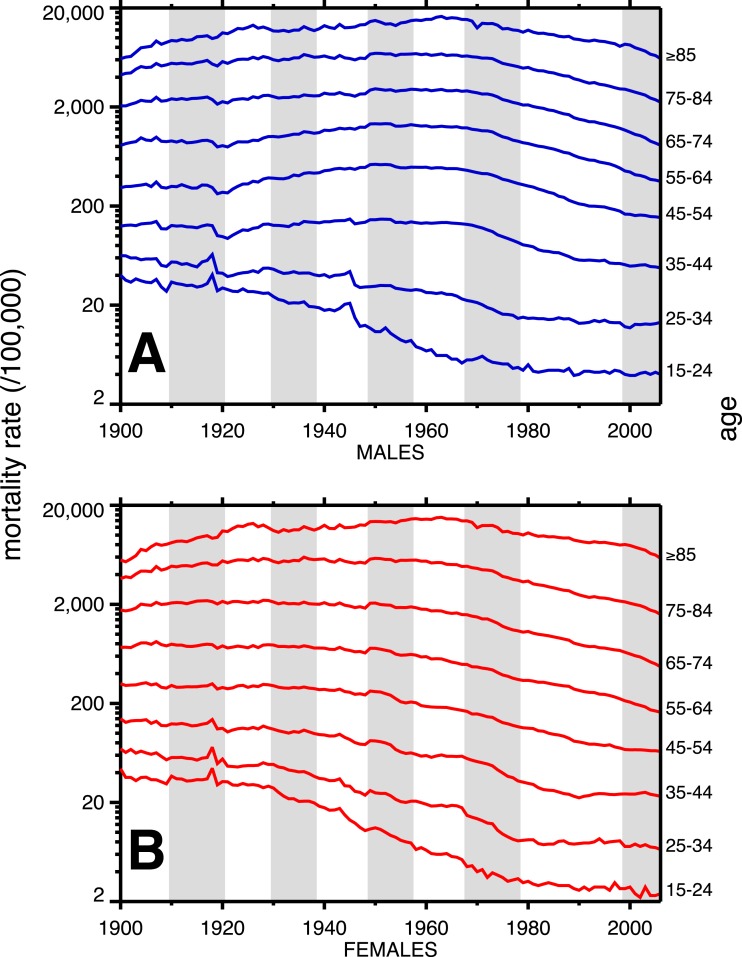
Figure 2. Heart disease age-specific death rates, United States Death Registration Area (1900–32) and United States (1933–2006).
(A) Males, (B) females. Age groups are labeled on the right-hand vertical axes. Data sources and component causes listed in the Appendix. Alternating shading marks disease classification from ICD-1 to ICD-10.

