Summary
A liquid chromatography/ion trap mass spectrometry-based method to determine six ergot alkaloids and their isomers is presented. The samples were cleaned on neutral alumina-based solid-phase extraction cartridges. The following method parameters were obtained (depending on the analyte and spiking level): method recovery from 63.0 to 104.6%, relative standard deviation below 18%, linear range from 1 to 325 µg/kg, linear correlation coefficient not less than 0.98. The developed analytical procedure was applied to determine the levels of ergot alkaloids in 65 samples of selected rye-based food products (flour – 34 samples, bran – 12 samples, rye – 18 samples, flakes – 1 sample). Measurable levels of alkaloids were found in majority of the analysed samples, particularly in rye flour. Additionally, alkaloids were determined in ergot sclerotia isolated from rye grains. Total content was nearly 0.01% (97.9 mg/kg). However, the alkaloid profile was dominated by ergocristine at 45.6% (44.7 mg/kg), an alkaloid not commonly found in the tested food products. Ergocorninine at 0.2% (0.2 mg/kg) was the least abundant alkaloid.
Key words: liquid chromatography/ion trap mass spectrometry, ergot alkaloids, rye, cereals
Introduction
Ergot alkaloids are mainly produced by Claviceps purpurea parasitic fungi during the plant flowering period (1). Ergot grows on cereals such as rye, triticale, wheat and barley, where its sclerotia replace grains in the plant ears. Total content of alkaloids in ergot sclerotia may vary from 0.01 to 0.5%. Sclerotia harvested together with cereal may contaminate food and feed. The consumption of food contaminated with ergot toxins may cause numerous diseases (1, 2).
Poisoning with ergot alkaloid-contaminated food; i.e. ergotoxicosis, was in medieval Europe commonly referred to as St. Anthony’s fire (3–5). Ergot alkaloids may cause adrenergic cramps, swelling and red marks; in extreme cases limb necrosis may lead to death. Chronic exposure to ergot alkaloids may disturb the central nervous system, inducing dizziness, pins and needles, nausea, limb seizure, paralysis, psychoses, dementia and even death (5, 6). Clinical symptoms in animals may include gangrene, miscarriage, convulsions, loss of lactation, oversensitivity and/or ataxia, i.e. disorder of muscle movement coordination (3).
Major ergot alkaloids produced by C. purpurea include ergopeptines (ergometrine, ergocornine, ergocristine, ergokryptine, ergosine, and ergotamine) and ergopeptinines, i.e. (S)-diastereoisomers produced by epimerisation at the C-8 position, of which respective names end with the ‘-inine’ suffix (Fig. 1) (7). The former are derivatives of lysergic acid, whereas the latter are relatives of isolysergic acid (5). The isomerisation speed and ratio of isomers depend on the conditions (particularly pH and temperature) and on the alkaloid structure (7).
Fig. 1.
Chemical structure of major ergot alkaloids
In nature, ergot alkaloids are organic bases. The values of acid dissociation constant, pKa, for ergopeptines range from 5.5 (ergocristine) to 6.0 (ergometrine), while those for ergopeptinines range from 4.8 (ergocorninine) to 6.2 (ergometrinine). Natural ergopeptines are always accompanied by ergopeptinines. Ergopeptines may transform into ergopeptinines during long-term storage (particularly if storage conditions are improper) or during the extraction of ergot alkaloids from cereals. Different epimers may have different biological and physicochemical properties. Ergopeptines are more active biologically than ergopeptinines (2).
Currently, natural levels of ergot alkaloids in cereals are rarely reported (3). Nevertheless, some studies in Germany showed that the Claviceps purpurea rate of occurrence in cereals increased in recent years, which might be attributed to the common cultivation of monocultures and mixed varieties of cereals (2). Despite efficient grain cleaning procedures, ergot alkaloids can still be found in grain, particularly in rye-based cereals (3, 8). Poisoning in humans with ergot alkaloids has been practically eliminated even if measurable contents of the toxins may be found in foodstuffs. However, alkaloids remain an important veterinary issue, particularly in feeding of cattle, horses, sheep, pigs and chickens (3).
No maximum permissible levels (MPLs) of ergot alkaloids in grain and/or cereals have been set in the EU, whereas regulations in Switzerland specify that the level in cereals is 100 µg/kg (1). In fact, it is difficult to set the MPLs because many structurally similar forms of ergot alkaloids may coexist (9). Furthermore, C. purpurea sclerotia content in grain to be used in an unground form in a fodder is limited by the 2002/32/EC European Directive to 1000 mg/kg (2). In a Recommendation issued on March 15, 2012, the European Commission recommended monitoring at least six ergot alkaloids (ergometrine, ergocornine, ergocristine, ergokryptine, ergosine and ergotamine) and their epimers in grain and cereals that are intended for human consumption or animal feeding (Recommendation (EC) No 2012/154/EU) (10).
Suitable analytical methods are required to acquire data on the occurrence of ergot alkaloids necessary to assess human exposure and to suggest respective MPL regulations. High-performance liquid chromatography (HPLC)-based methods are the most popular instrumental methods among numerous ones that are used. Fluorescence detectors (FLD) are most commonly used in analyses of ergot alkaloids (11–14); however, mass spectrometers (MS) are becoming increasingly popular (3, 9, 15–17). A comprehensive review of analytical procedures to determine ergot alkaloids was published by Krska and Crews (18).
Various mobile phases at isocratic or gradient flow are used to separate alkaloids in chromatographic columns. The most common phase is composed of an acetonitrile (ACN)/water mixture, which is sometimes slightly acidified to improve the ionisation conditions in the electrospray ion (ESI) source of the mass spectrometer. In most qualitative and quantitative methods, the alkaloids are extracted using a mixture of polar and nonpolar solvents in an alkaline medium or a polar solvent in an acid medium. The clean-up procedures involve solid phase extraction (SPE) cartridges, which are filled with a cation- -exchange resin in most cases (2). Neutral alumina-based beds were applied to clean up ergot alkaloids in grains as reported by Müller et al. (14).
Most available data in the literature on ergot alkaloid determination were obtained using mass spectrometers with triple quadruple analysers; few authors used the ion trap MS/MS, although it may show high sensitivity. However, this detector is also vulnerable to matrix effects: too many trapped ions degrade the trap performance because of their interactions (the so-called space charge effect). As a result, instrument sensitivity and/or repeatability may significantly decrease. Thus, the to-be-analysed samples must be cleaned up very carefully or surplus ions from the matrix residues will ‘clog’ the instrument.
In this study, the analytical procedure for determination of six major ergot alkaloids and their epimers in rye- -based food products is described. The alkaloid content was assessed in a total of 30 samples (flour, bran, rye and flakes) using a liquid chromatography/ion trap mass spectrometry technique (LC-IT-MS). The applied extraction/purification procedure was based on the report of Müller et al. (14) with some major modifications.
Materials and Methods
Chemicals and reference materials
The solvents in this study were of HPLC grade. Acetonitrile (ACN), n-hexane and dichloromethane were supplied by Rathburn Chemicals (Walkerburn, UK). Ammonium carbonate was obtained from POCh (Gliwice, Poland), and neutral alumina was obtained from Merck (Darmstadt, Germany). The water in the analytical procedures was purified in Hydrolab water treatment unit (Wiślina, Poland). Matrix reference material (BRM 003020), ergot alkaloids in rye and ergot alkaloid analytical standards were supplied by Biopure (Tulln, Austria). Every analytical standard that was delivered by the manufacturer as a pure substance was dissolved in 5 mL of ACN to obtain alkaloid solutions of the following concentrations (in µg/mL): mix of six ergot alkaloids: ergocornine 100.4, ergocristine 100.4, α-ergokriptine 101.8, ergometrine 100.6, ergosine 100.6, ergotamine 101.5 and their epimers: ergocorninine 25.1, ergotaminine 24.9, ergometrinine 25.1, ergosinine 25.2, ergokryptynine 25.0, ergocristynine 25.1.
Research material
The research material was composed of 65 rye and rye-based cereal samples. The types of tested samples were randomly selected. The rye grain samples (N=18) were obtained from grain mills located in different regions of Poland. The rye samples (1 kg) were taken from grain elevators and ground using a mechanical impact mill (model WŻ-1S, ZBPP, Bydgoszcz, Poland). From the ground samples, laboratory subsamples were taken for testing. Other tested products, i.e. rye flour (N=34), rye bran (N=12) and rye flakes (N=1) came from different suppliers and were bought in local supermarkets.
Extraction and purification of ergot alkaloids
A mass of 5 g of a well ground sample was homogenised with 50 mL of 84:16 CAN/ammonium carbonate (200 mg/L) (by volume) solution for 2 min. The entire mixture was transferred into a 50-mL polypropylene tube and centrifuged for 10 min at 10 730×g. Subsequently, 20 mL of the supernatant were transferred into a separatory funnel and liquid-liquid extracted with 30 mL of n-hexane to eliminate fats. Then, 5 mL of the ACN/ammonium carbonate fraction were evaporated to dryness at 40 °C using a rotary evaporator IKA-RV-10 (IKA, Staufen, Germany). The residues were redissolved in 5 mL of dichloromethane/ethyl acetate/methanol/25% aqueous ammonia mixture (50:25:10:1 by volume) and sonicated in an ultrasonic bath.
Neutral alumina preheated overnight at 600 °C in a muffle oven was used to clean up the extracts. Then, 1 mL of the extract prepared as above was directly transferred on the 300 mm×20 mm glass chromatographic column filled with 3 g of alumina. The column was subsequently eluted with 9 mL of dichloromethane/ethyl acetate/methanol/25% aqueous ammonia mixture (50:25:10:1 by volume). The eluate was collected into a round-bottom flask and evaporated at 40 °C using a rotary evaporator. The residues were redissolved in 2 mL of ACN/ammonium carbonate solution mixture (50:50 by volume). The samples were filtered through 0.2-µm nylon syringe filters (Chromacol, Welwyn Garden City, UK) before injection into the HPLC.
Ergot alkaloid standards
First, 0.5 mL of ergot alkaloid standard and 1 mL of the corresponding epimer standard were transferred into a 10-mL measuring flask and dissolved in ACN. The solution was subsequently transferred into an amber glass vial. The following concentrations of individual ergot alkaloid standards were obtained (in µg/mL): ergometrine, ergocornine, ergocristine and ergosine each 5.0; ergokryptine and ergotamine each 5.1; and ergometrinine, ergocorninine, ergocristinine, ergokryptinine, ergosynine and ergotaminine each 2.6. All standards were stored frozen at a temperature below –20 °C to prevent alkaloid epimerisation. The standards could also be stored at room temperature when dissolved in chloroform, although ACN solutions are more convenient for the HPLC analysis (19).
Calibration curves
A separate calibration curve was plotted for each determined compound. Then, 0.5 mL of standard mixture was transferred into a 10-mL measuring flask and filled with ACN. The concentration of individual ergot alkaloid in the calibration mixture was (in µg/mL): ergometrine, ergocornine, ergocristine and ergosine 0.25, ergotamine and ergokryptine 0.26, and other compounds 0.13. Portions of 1, 3, 5, 13, 25, 50, 75 and 125 µL of the mixture were subsequently added into autosampler vials. The solvent was evaporated under a gentle stream of nitrogen, and the residues were redissolved in 1 mL of the 1:1 ACN/ammonium carbonate buffer.
LC-IT-MS/MS analysis
An LCQ Advantage Max (Thermo Fisher Scientific, Austin, TX, USA) mass spectrometer with an ion trap operated in the positive ionisation electrospray mode was used for the determinations. The flow of nebulising gas (nitrogen) was set at 25 arbitrary units (AU), the flow of make-up gas (also N2) was 10 AU, capillary bias was 34 V, nebuliser bias 5 kV, capillary temperature 260 °C and the ion source current 80 µA. The optimised instrument operating parameters, monitored daughter ions and precursor ions for fragmenting the individual studied compounds are shown in Table 1.
Table 1. MS/MS precursor ions/fragmentation ions and optimal ionisation parameters for individual ergot alkaloids.
| Com- pound |
Precursor ion m/z |
Fragmentation ion m/z |
Collision energy % |
Activation Q value |
Activation time ms |
Ion injection time ms |
Number of µ-scans |
Nebuliser voltage kV |
Capillary voltage V |
|---|---|---|---|---|---|---|---|---|---|
| Em | 326.2 [M+H]+ | 223.2, 197.2, 308.1 | 33 | 0.258 | 30 | 220 | 5 | 5 | 20.0 |
| Es | 548.2 [M+H]+ | 530.2, 268.1 | 27 | 0.242 | 30 | 215 | 5 | 5 | 19.0 |
| Et | 582.2 [M+H]+ | 564.1 | 24 | 0.257 | 30 | 225 | 5 | 5 | 23.0 |
| Eco | 562.2 [M+H]+ | 544.2, 268.1 | 26 | 0.255 | 30 | 220 | 5 | 5 | 24.0 |
| Ekr | 576.2 [M+H]+ | 558.2, 268.1 | 27 | 0.243 | 30 | 220 | 5 | 5 | 23.0 |
| Ecr | 610.2 [M+H]+ | 592.1, 268.1 | 27 | 0.248 | 30 | 230 | 5 | 5 | 33.5 |
| Emn | 326.2 [M+H]+ | 265.2, 223.2, 283.1 | 33 | 0.258 | 30 | 220 | 5 | 5 | 21.0 |
| Esn | 548.2 [M+H]+ | 530.2 | 21 | 0.260 | 30 | 225 | 5 | 5 | 33.5 |
| Etn | 582.2 [M+H]+ | 564.1 | 20 | 0.255 | 30 | 220 | 5 | 5 | 24.0 |
| Econ | 562.2 [M+H]+ | 544.2 | 20 | 0.261 | 30 | 225 | 5 | 5 | 23.0 |
| Ekrn | 576.2 [M+H]+ | 558.2 | 21 | 0.247 | 30 | 220 | 5 | 5 | 22.0 |
| Ecrn | 610.2 [M+H]+ | 592.2 | 20 | 0.240 | 30 | 210 | 5 | 5 | 32.0 |
Em=ergometrine, Es=ergosine, Et=ergotamine, Eco=ergocornine, Ekr=ergokryptine, Ecr=ergocristine, Emn=ergometrinine, Esn=ergosinine, Etn=ergotaminine, Econ=ergocorninine, Ekrn=ergokryptinine, Ecrn=ergocristinine
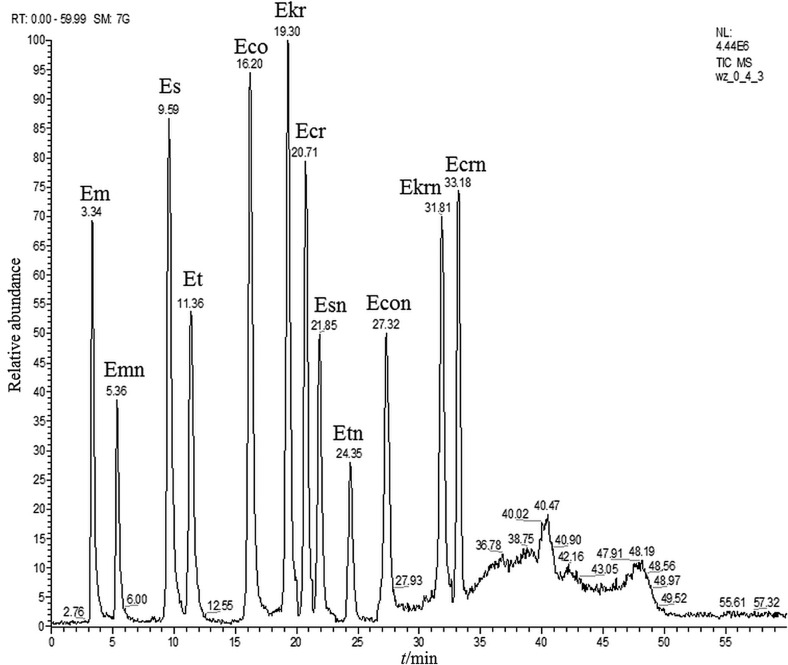
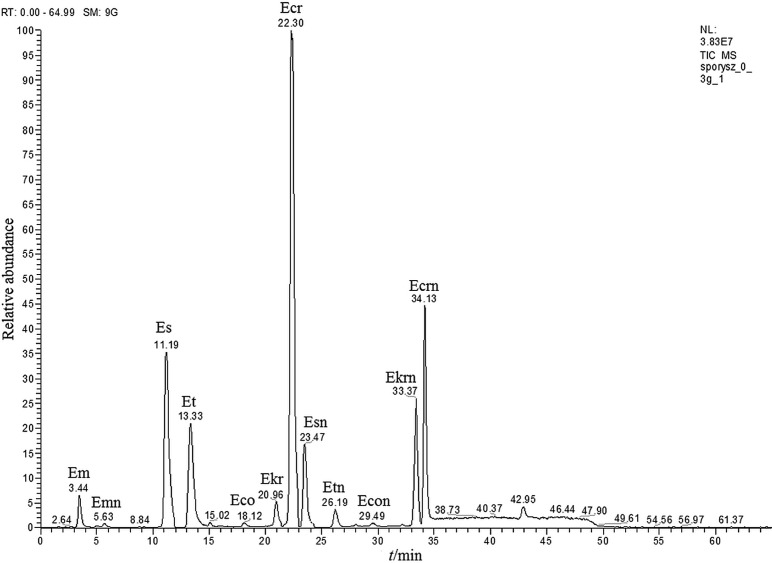
Chromatographic separations of six basic ergot alkaloids and their epimers were performed on a 150/2 Nucleodur® Sphinx RP 1.8 µm (Macherey-Nagel, Düren, Germany) chromatographic column. Bifunctional octadecyl/phenyl groups in the column bed provided high selectivity for both hydrophobic and hydrophilic aromatic compounds in the pH range of 1–10. The mobile phase was selected according to the literature data (2, 3, 5, 7, 14, 20, 21). Efficient chromatographic separation was obtained when the mobile phase was composed of water, 200 mg/L of ammonium carbonate buffer (pH=9.0±0.3) and ACN. Two mobile phases were used in a gradient setup: aqueous ammonium carbonate 200 mg/L (phase A) and ACN (phase B). The used gradient was: 40% phase A from 0 to 4 min, 45% from 5 to 7 min, 50% from 10 to 20 min, 80% from 25 to 37 min and 40% phase A from 40 to 60 min. The cleaned-up samples were dissolved in a 1:1 ACN/aqueous ammonium carbonate buffer mixture and maintained in the autosampler at 10 °C to slow down the epimerisation processes. The chromatographic column was maintained at 50 °C. A typical chromatographic separation of the ergot alkaloid standard mixture is shown in Fig. 2.
Fig. 2.
Chromatogram of the used mixture of ergot alkaloid standards (the MS/MS mode) Em=ergometrine, Es=ergosine, Et=ergotamine, Eco=ergocornine, Ekr=ergokryptine, Ecr=ergocristine, Emn=ergometrinine, Esn=ergosinine, Etn=ergotaminine, Econ=ergocorninine, Ekrn=ergokryptinine, Ecrn=ergocristinine
Results and Discussion
Results of LC-IT-MS/MS analysis
The optimal values of ionisation parameters were established in a series of preliminary experiments. The mass spectrometer operating parameters were automatically optimised after injecting a solution of the individual analytes into the ion source using a syringe pump. The optimised ionisation parameters and the monitored daughter ions for individual analytes are shown in Table 1.
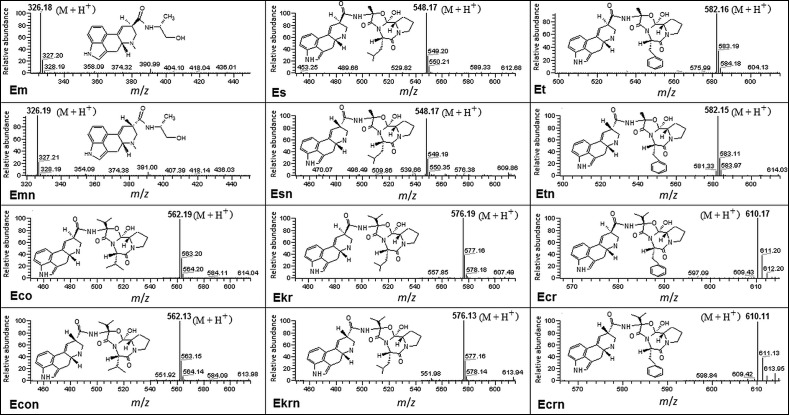
The protonated molecular ions (M+H+) are shown in Fig. 3. The MS signal intensity mainly depends on the source temperature, cone bias voltage, capillary bias voltage, nebulising gas flow rate, and make-up gas flow rate. The optimum source temperature was 260 °C. Losses of ions at a too high nebulising/make-up gas flow rate caused the spectrometer sensitivity to decrease.
Fig. 3.
Molecular ions of individual ergot alkaloids and their epimers produced in the MS mode. Abbreviations as in Fig. 2
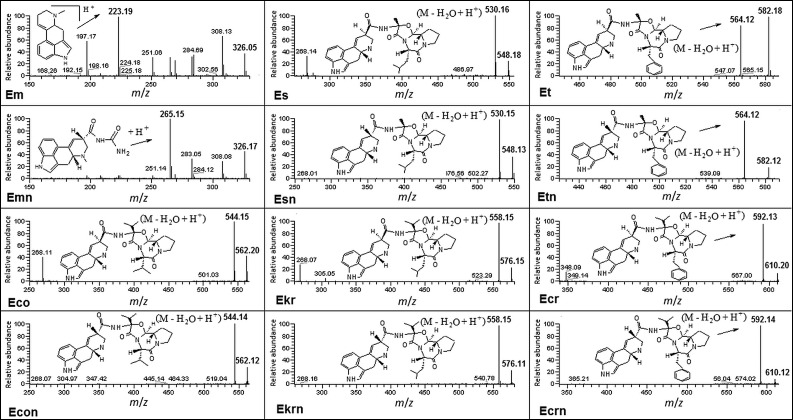
The fragmentation and ionisation pattern of ergot alkaloids in the electrospray source, which was operated in the positive ion (ESI) mode, was studied to establish the MS/MS operating conditions. This technique is most frequently applied to analyse ergot alkaloids because it provides the highest sensitivity at atmospheric pressure ionisation conditions (2). The negative ionisation mode was also applied, but it did not give satisfactory results. Daughter ions of individual ergot alkaloids and their epimers that were produced in the MS/MS mode are shown in Fig. 4. In all cases, except ergometrine (Em) and its derivative ergometrinine (Emn), fragmentation ions were produced by dissociating a water molecule and attaching a proton (M–H2O+H+). The single type fragmentation ions were produced at any given excitement bias voltage. The fragmentation of ergometrine ions consisted in cleaving the CONHCH(CH3)CH2OH chains off the basic molecules, so the most intense peak was observed at m/z=223.2. Fragmentation of ergometrinine ions consisted in cleaving the CH3CH2CH2OH chains off the epimer molecules, so the most intense peak was observed at m/z=265.2.
Fig. 4.
Fragmentation ions of individual ergot alkaloids and their epimers produced in the MS/MS mode. Abbreviations as in Fig. 2
Sample preparation
The dichloromethane/ethyl acetate/methanol/aqueous ammonia (50:25:5:1) extraction mixture was used by several authors (13, 14, 22). The ACN/ammonium carbonate buffer extraction mixture (7) was used in this work. Popular methods to purify the extracted ergot alkaloids include: Strata-X-C polymer SPE columns eluted with 60:40 (by volume) methanol/0.05 M (pH=11.0) disodium phosphate buffer (23), Extrelut NT3 diatomaceous earth conditioned with tartaric acid solution (13, 24, 25), Mycosep® 150 ergot selective SPE columns (7), and molecularly imprinted polymers (MIP) (26).
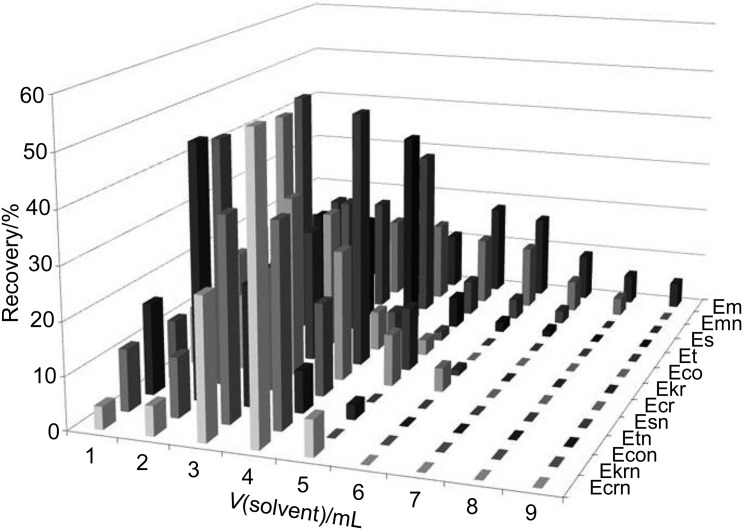
Müller et al. (14) reported a neutral alumina-based technique for this purpose. In their work, ergot alkaloid extracts dissolved in the 50:25:5:1 (by volume) dichloromethane/ethyl acetate/methanol/25% aqueous ammonia mixture were transferred directly into a glass column filled up with heated neutral alumina. In this alkaline medium, the ergot alkaloids did not exhibit practically any retention on alumina compared to the retention of impurities. Thus, the initial fractions of the eluent contained highly purified analytes. However, in this work, somewhat more polar 84:16 ACN/ammonium carbonate buffer extraction mixture was used. The residues that remained after the extraction solvent evaporated were redissolved in the dichloromethane/ethyl acetate/methanol/25% aqueous ammonia mixture. This change to a more selective solvent helped us efficiently separate the analytes from the matrix impurities because the latter were more strongly adsorbed on neutral alumina. Using the modified method, we were able to elute more efficiently the compounds that were treated with the previously described extraction/purification procedure, which exhibits low recovery rates, i.e. ergometrine, ergometrinine, ergosine and ergotamine. The elution pattern of ergot alkaloids from a neutral alumina-based column (extracted with ACN/ammonium carbonate buffer mixture, extraction solvent evaporated, and residues redissolved in dichloromethane/ethyl acetate/methanol/25% aqueous ammonia mixture) is shown in Fig. 5.
Fig. 5.
Elution pattern of ergot alkaloids from neutral alumina-based column. Abbreviations as in Fig. 2
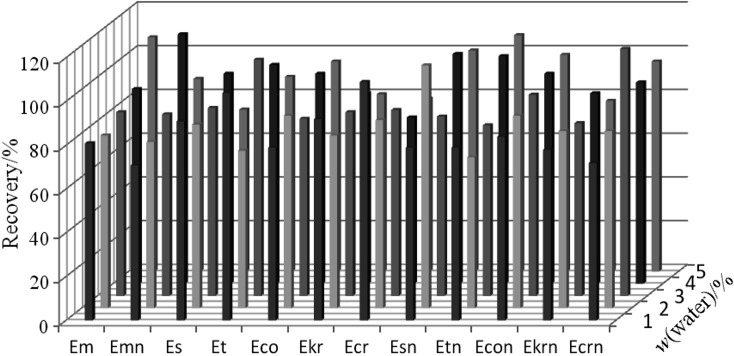
The effect of the alumina deactivation degree on the analyte recovery from fortified rye samples was also assessed. Alumina was deactivated at 600 °C overnight and subsequently mixed with water at 1, 2, 3, 4 and 5%. No significant correlation between the recovery rate of the studied compounds and the deactivation level was noticed. However, at higher water contents (2, 3, 4 and 5%), the background noise related to the sample matrix appeared to increase in the chromatograms, which affected the repeatability of the instrumental readback. The lack of effect of the deactivation level on the recovery rate was most probably related to the composition of the phase that was used for the column elution. The solvent mixture was composed of polar solvents, i.e. ethyl acetate, methanol and water, which effectively bound to the existing active sites on the alumina surface. The effect of the addition of water (deactivation level) to alumina on the analyte recovery rate is shown in Fig. 6.
Fig. 6.
The influence of the alumina deactivation level on the ergot alkaloid recovery from the rye grain sample. Abbreviations as in Fig. 2
Method validation
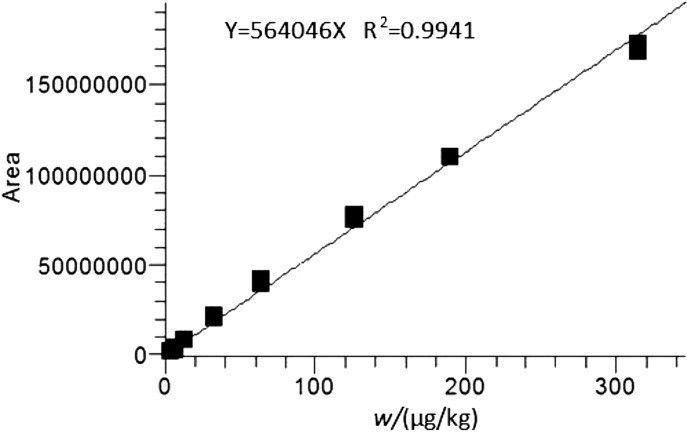
The obtained ergopeptine mass fractions were within the range of 3–325 µg/kg, and the ergopeptinine mass fractions were within the range of 1–163 µg/kg (Table 2). The coefficient determination (R2) was higher than 0.98 for every analysed compound. The limit of quantification (LOQ, the lowest point on the calibration curve) for individual analytes was found between 1 and 3 µg/kg (signal to noise ratio S/N>170). An example of calibration curve for ergometrine is shown in Fig. 7.
Table 2. Parameters of the calibration curves determined for individual ergot alkaloids.
| Alkaloid | Curve equation | R2 | LOQ/(µg/kg) (S/N) |
LOD/(µg/kg) (S/N) |
Linear range µg/kg |
|---|---|---|---|---|---|
| Em | Y=564046X | 0.9941 | 3 (396) | 0.5 (121) | 3–313 |
| Es | Y=848492X | 0.9969 | 3 (412) | 0.5 (165) | 3–313 |
| Et | Y=602663X | 0.9982 | 3 (245) | 0.5 (114) | 3–325 |
| Eco | Y=49437.1X | 0.9826 | 3 (614) | 0.5 (164) | 3–313 |
| Ekr | Y=0.06X+1.21971e | 0.9959 | 3 (385) | 0.5 (181) | 3–325 |
| Ecr | Y=863154X | 0.9950 | 3 (242) | 0.5 (97) | 3–313 |
| Emn | Y=0.006X+1.42721e | 0.9988 | 1 (204) | 0.2 (96) | 1–163 |
| Esn | Y=681488X | 0.9972 | 1 (314) | 0.2 (111) | 1–163 |
| Etn | Y=0.06X+1.02305e | 0.9970 | 1 (215) | 0.2 (98) | 1–163 |
| Econ | Y=0.06X+1.8746e | 0.9906 | 1 (224) | 0.2 (131) | 1–163 |
| Ekrn | Y=0.06X+1.9021e | 0.9939 | 1 (174) | 0.2 (118) | 1–163 |
| Ecrn | Y=0.06X+1.6337e | 0.9992 | 1 (262) | 0.2 (144) | 1–163 |
Y=peak area, X=mass fraction (µg/kg), R2=correlation coefficient, LOQ=limit of quantification, S/N=signal to noise ratio, LOD=limit of detection. Abbreviations as in Table 1
Fig. 7.
Ergometrine calibration curve plotted through eight measurement points
To prepare the spiked samples, 25, 100 or 300 µL of the calibration standard mixture were added to flour samples (5 g) that were earlier tested for the presence of ergot alkaloids. The samples were left intact in a dark place at room temperature to let the solvent evaporate. The obtained mass fractions at the three spiking levels were 25, 100 and 300 µg/kg for ergopeptines, and 12.5, 50 and 150 µg/kg for ergopeptinines. The mean recoveries ranged from 63.0% (ergometrine) to 106.4% (ergosine, ergocorninine), depending on the alkaloid and its spiking level.
The method precision (relative standard deviation, RSD) was below 18% (Table 3). The method accuracy was assessed by analysing a certified material (ergot alkaloids in rye flour BRM 003020) according to the Eurachem/CITAC guidelines: absolute differences between the measured/certified mass fractions were compared against the combined measurement uncertainties and the certified value uncertainties (Table 4).
Table 3. Mean recoveries and relative standard deviations (RSD) for rye flour samples fortified at three spiking levels (25, 100 and 300 µL of calibration standard mixture).
| Alkaloid | Spiking level 1 | Spiking level 2 | Spiking level 3 | ||||||||
|---|---|---|---|---|---|---|---|---|---|---|---|
|
w µg/kg |
Mean recovery % |
RSD % |
w µg/kg |
Mean recovery % |
RSD % |
w µg/kg |
Mean recovery % |
RSD % |
|||
| N=3 | N=3 | N=3 | |||||||||
| Em | 25.2 | 63.0 | 4.2 | 100.6 | 84.6 | 16.1 | 301.8 | 74.3 | 10.8 | ||
| Es | 25.2 | 84.4 | 5.1 | 100.6 | 106.4 | 2.1 | 301.8 | 84.2 | 11.3 | ||
| Et | 25.4 | 78.7 | 13.1 | 101.5 | 96.4 | 6.9 | 304.5 | 80.0 | 0.3 | ||
| Eco | 25.1 | 83.8 | 3.6 | 100.4 | 98.8 | 9.9 | 301.2 | 75.9 | 5.8 | ||
| Ekr | 25.5 | 86.3 | 8.7 | 101.8 | 104.8 | 4.4 | 305.4 | 99.3 | 17.1 | ||
| Ecr | 25.1 | 87.9 | 5.6 | 100.4 | 101.9 | 11.0 | 312.9 | 83.6 | 7.7 | ||
| Emn | 12.6 | 77.8 | 8.7 | 50.0 | 74.3 | 11.6 | 150.0 | 73.6 | 6.6 | ||
| Esn | 12.6 | 83.1 | 8.9 | 50.4 | 102.4 | 10.0 | 151.2 | 88.9 | 11.5 | ||
| Etn | 12.5 | 84.0 | 5.0 | 49.8 | 91.6 | 9,0 | 149.4 | 88.6 | 8.7 | ||
| Econ | 12.6 | 89.4 | 12.0 | 50.2 | 106.4 | 6.0 | 150.6 | 86.8 | 9.8 | ||
| Ekrn | 12.5 | 83.7 | 11.9 | 50.0 | 97.7 | 10.2 | 150.0 | 91.5 | 10.7 | ||
| Ecrn | 12.6 | 80.2 | 14.9 | 50.2 | 97.5 | 6.3 | 150.6 | 87.6 | 10.9 |
Abbreviations as in Table 1
Table 4. Method accuracy assessed in the analyses of ergot alkaloids in rye certified reference material (CRM).
| Alkaloid | Measured | Certified |
|wCRM–w| µg/kg |
Uc = µg/kg |
|wCRM–w|< Uc | |||||
|---|---|---|---|---|---|---|---|---|---|---|
|
w µg/kg |
N | U ±µg/kg |
wCRM µg/kg |
N | UCRM ±µg/kg |
|||||
| Em | 262 | 7 | 29 | 595 | 5 | 745 | 332 | 537 | + | |
| Es | 540 | 6 | 43 | 537 | 5 | 260 | 3 | 193 | + | |
| Et | 1396 | 10 | 112 | 1349 | 5 | 1156 | 47 | 840 | + | |
| Eco | 728 | 10 | 57 | 614 | 5 | 156 | 114 | 446 | + | |
| Ekr | 597 | 8 | 65 | 570 | 5 | 52 | 27 | 76 | + | |
| Ecr | 1091 | 8 | 99 | 923 | 5 | 195 | 168 | 172 | + | |
| Emn | 116 | 7 | 12 | 335 | 5 | 758 | 219 | 546 | + | |
| Esn | 242 | 8 | 27 | 331 | 5 | 476 | 89 | 952 | + | |
| Etn | 333 | 10 | 42 | 464 | 5 | 367 | 161 | 267 | + | |
| Econ | 334 | 10 | 35 | 362 | 5 | 391 | 28 | 284 | + | |
| Ekrn | 380 | 7 | 44 | 477 | 5 | 526 | 131 | 381 | + | |
| Ecrn | 371 | 8 | 39 | 462 | 5 | 469 | 91 | 340 | + |
w=measured mass fraction and wCRM=CRM mass fraction of ergot alkaloids UCRM=uncertainty of CRM value expressed as 95% of confidence interval for UCRM= in Student’s t-distribution, Uc=extended combination of CRM value uncertainty (UCRM) and measured value uncertainty (U) at extension coefficient k=2. Abbreviations as in Table 1
The combined uncertainty of the determined mass fractions was estimated based on the identified uncertainty sources in the proposed analytical method. The uncertainty was expressed as an expanded value at k=2 and α=0.05. The expanded uncertainty value was used to assess the differences in the ergot mass fractions that were determined for the studied certified reference material samples and reference concentration values. The difference did not exceed the combined measurement uncertainty in any case. In other words, no statistically significant difference between the obtained results and values that was declared in the material certificate was noted.
Levels of ergot alkaloids in rye-based food products and ergot sclerotia
The developed analytical procedure was used to estimate the levels of ergot alkaloids in rye-based food products supplied by local manufacturers. In total, 65 samples were tested (rye grain 18, flour 34, bran 12, flakes 1). The results are shown in Table 5.
Table 5. Levels of ergot alkaloids in rye-based food products.
| Sample | w/(µg/kg) | |||||||||||||
|---|---|---|---|---|---|---|---|---|---|---|---|---|---|---|
| Em | Es | Et | Eco | Ekr | Ecr | Emn | Esn | Etn | Econ | Ekrn | Ecrn | Total | ||
| Rye | Mean value±S.D. | 1.2±0.5 | 2.1±0.9 | 2.8±1.7 | 2.8±1.7 | 3.1±1.4 | 3.8±1.6 | – | 0.8±0.1 | 0.8±0.3 | 1.5±1.0 | 2.4±1.3 | 1.5±0.7 | 14.8±9.8 |
| Median | 1.0 | 2.2 | 2.6 | 1.8 | 2.4 | 4.1 | – | 0.8 | 0.6 | 1.25 | 2.35 | 1.1 | 20.7 | |
| Min | 0.7 | 0.8 | 0.8 | 1.4 | 1.9 | 1.8 | – | 0.7 | 0.6 | 0.3 | 0.8 | 1.0 | 0.8 | |
| Max | 1.9 | 3.2 | 4.9 | 5.2 | 5.0 | 5.6 | – | 0.8 | 1.2 | 3.0 | 4.1 | 2.5 | 25.0 | |
| N=18 | 9* (50%) | 12 (67%) | 9 (50%) | 9 (50%) | 9 (50%) | 9 (50%) | 0 | 9 (50%) | 9 (50%) | 12 (67%) | 12 (67%) | 9 (50%) | 15 (83%) | |
| Flour | Mean value±S.D. | 5.4±6.9 | 12.9±29.7 | 23.6±53.9 | 16.3±39.6 | 17.1±40.1 | 19.7±43.6 | 17.0±5.2 | 6.0±12.3 | 6.7±10.2 | 9.1±20.7 | 16.0±13.6 | 10.4±24.0 | 106.1±280.0 |
| Median | 1.8 | 3.75 | 7.5 | 5.3 | 3.9 | 3.8 | 16.95 | 1.95 | 3.9 | 2.8 | 6.7 | 2.0 | 26.3 | |
| Min | 0.6 | 0.6 | 0.9 | 1.0 | 2.1 | 1.4 | 11.8 | 0.5 | 0.8 | 0.7 | 1.6 | 0.7 | 0.9 | |
| Max | 17.2 | 110.8 | 223.2 | 152.8 | 149.5 | 168 | 22.1 | 42.7 | 41.2 | 80.4 | 115.2 | 92.4 | 1215.5 | |
| N=34 | 8 (24%) | 24 (71%) | 30 (88%) | 26 (76%) | 24 (71%) | 26 (76%) | 2 (6%) | 20 (59%) | 26 (76%) | 26 (76%) | 22 (65%) | 26 (76%) | 32 (94%) | |
| Bran | Mean value±S.D. | 1.1±0.5 | 2.1±1.0 | 5.1±4.4 | 2.3±2.1 | 4.3±1.6 | 3.3±2.1 | – | 1.2±0.4 | 2.1±1.1 | 2.6±1.6 | 6.7±2.0 | 1.5±0.6 | 16.9±18.4 |
| Median | 1.5 | 2.15 | 3.65 | 1.2 | 4.9 | 3.3 | – | 1.4 | 1.9 | 2.3 | 7.9 | 1.5 | 6.7 | |
| Min | 0.6 | 0.8 | 0.8 | 0.7 | 2.1 | 1.2 | – | 0.6 | 0.9 | 0.9 | 3.8 | 0.9 | 1.5 | |
| Max | 1.5 | 3.3 | 12.2 | 6.4 | 6.0 | 5.4 | – | 1.6 | 3.6 | 4.7 | 8.3 | 2.1 | 46 | |
| N=12 | 2 (17%) | 8 (67%) | 8 (67%) | 10 (83%) | 6 (50%) | 4 (33%) | 0 | 6 (50%) | 6 (50%) | 6 (50%) | 6 (50%) | 2 (17%) | 12 (100%) | |
| Flakes | Mean value**±S.D. | 4.1±0.5 | 1.9±0.2 | 1.1±0.3 | 24.4±4.1 | 8.9±0.6 | – | 6.2±0.7 | 1.6±0.2 | 0.7±0.1 | 53.9±3.0 | 25±2.6 | – | 127.8±9.9 |
| Median** | 4.0 | 1.9 | 1.2 | 25.3 | 8.9 | – | 6.4 | 1.5 | 0.7 | 52.0 | 26.0 | – | 133.0 | |
| Min** | 3.8 | 1.7 | 0.7 | 19 | 8.1 | – | 5.2 | 1.4 | 0.6 | 51.6 | 21.5 | – | 114.0 | |
| Max** | 4.3 | 2.2 | 1.4 | 29 | 9.6 | – | 6.9 | 1.8 | 0.9 | 58.1 | 27.6 | – | 136.5 | |
| N=1 | 1 | 1 | 1 | 1 | 1 | 0 | 1 | 1 | 1 | 1 | 1 | 0 | 1 | |
S.D.=standard deviation, –<LOQ (limit of quantification), *positive samples, **average of three independent replicates Abbreviations as in Table 1
Ergot alkaloids were detected in 83% of the tested rye grain, 94% of rye flour and 100% of rye bran and flake samples. The mean total mass fractions of the studied alkaloids in the tested rye grain and rye flakes were found to be (14.8±9.8) and (127.8±9.9) µg/kg, respectively. A relatively high mass fraction of 1215.5 µg/kg was found in one rye flour sample. A chromatogram of flour that was naturally contaminated with ergot alkaloids is shown in Fig. 8. Ergotamine (48 samples), ergocornine (46 samples) and ergosine (45 samples) are the most commonly found alkaloids, whereas ergometrinine (3 samples) and ergometrine (20 samples) are the least commonly found ones.
Fig. 8.
Chromatogram of a flour sample naturally contaminated with ergot alkaloids. Abbreviations as in Fig. 2
These results are consistent with the literature data. Reinhard et al. (9) tested 14 rye flour samples and found the total ergot alkaloid content in the range of 18–519 µg/kg. Storm et al. (27) tested 34 samples of rye flour that were produced from grain harvested in both ecological and conventional farms and found total ergot alkaloid mass fractions below 235 µg/kg. Bürk et al. (1) found six basic ergot alkaloids in rye-based food products at mass fractions not exceeding 256 µg/kg (rye bread).
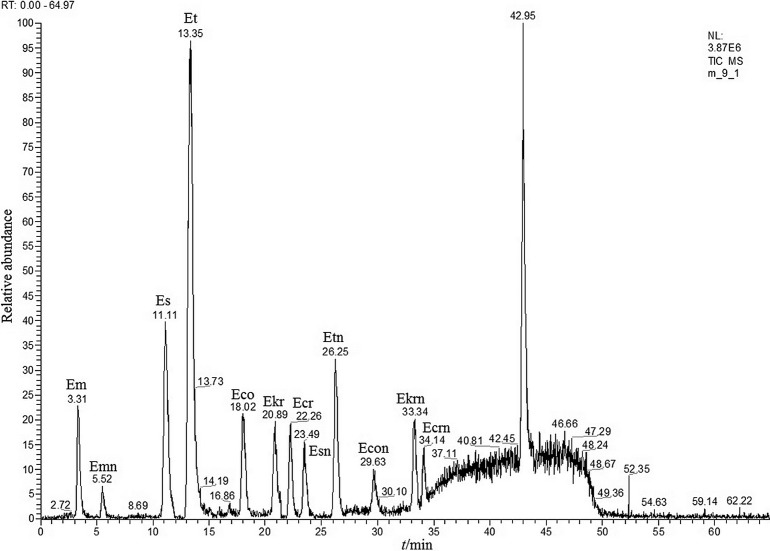
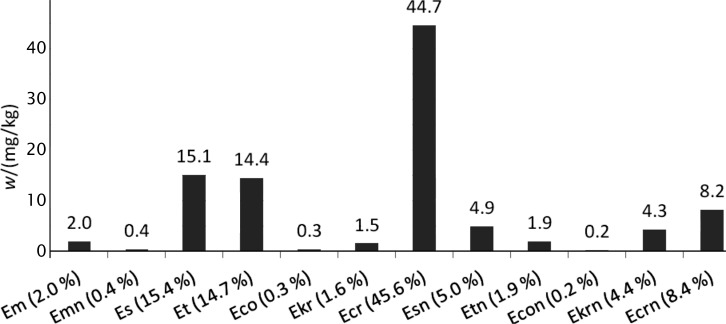
Additionally, alkaloids were determined in ergot sclerotia that were isolated from rye grains. The total content was nearly 0.01% (97.9 mg/kg). However, the alkaloid profile was dominated by ergocristine at 44.7 mg/kg (45.6% share in total), which is not among the most commonly found alkaloids in the tested food products. Ergocorninine at the mass fraction of 0.2 mg/kg (0.2% share in total) was the least abundant alkaloid. The absolute levels and contribution of individual compounds to the total content of alkaloids in ergot sclerotia are shown in Fig. 9. The chromatogram of alkaloids in the ergot sclerotia sample is shown in Fig. 10.
Fig. 9.
Absolute levels and profile of alkaloids in ergot sclerotia. Abbreviations as in Fig. 2
Fig. 10.
Chromatogram of alkaloids in ergot sclerotia sample. Abbreviations as in Fig. 2
The proportions of various alkaloids in ergot sclerotia and contaminated food products depend on the fungal species, geographic location, and plant on which the fungi parasitise. However, the exact mechanisms that produce the differences remain unknown (2, 28).
Conclusions
A liquid chromatography/ion trap mass spectrometry-based method has been developed to determine six ergot alkaloids and their isomers in rye-based food products. The analyte recovery rates ranged from 63.0 to 104.6%, depending on the spiking level and analyte type. Relative standard deviation was below 18%. The method performance was verified by analysing ergot alkaloids in rye certified reference material (BRM 003020).
Ion traps are relatively rarely used to determine ergot alkaloids because they require the analytes to be carefully purified to eliminate matrix ions that may easily degrade the performance of the mass spectrometer (the space charge effects within the trap); only a few similar methods have been reported in the literature. The originally developed cleaning method can efficiently separate alkaloids from polar impurities of the sample matrix on a neutral alumina bed.
The developed analytical procedure was applied to determine the levels of ergot alkaloids in 65 samples of selected rye-based food products. Measurable levels of alkaloids were found in most of the analysed samples (particularly rye flour samples). A single sample of flour contained ergot alkaloids at a combined level of 1215.5 µg/kg. The aforementioned results, which were obtained from a relatively small number of samples, suggest that ergot alkaloids in rye-based food products (and fodder) should be monitored on a wider scale.
References
- 1.Bürk G, Höbel W, Richt A. Ergot alkaloids in cereal products: results from the Bavarian Health and Food Safety Authority. Mol Nutr Food Res. 2006;50:437–42. 10.1002/mnfr.200500192 [DOI] [PubMed] [Google Scholar]
- 2.Krska R, Stubbings G, Macarthur R, Crews C. Simultaneous determination of six major ergot alkaloids and their epimers in cereals and foodstuffs by LC–MS–MS. Anal Bioanal Chem. 2008;391:563–76. 10.1007/s00216-008-2036-6 [DOI] [PubMed] [Google Scholar]
- 3.Lehner AF, Craig M, Fannin M, Bush L, Tobin T. Electrospray (+) tandem quadrupole mass spectrometry in the elucidation of ergot alkaloids chromatographed by HPLC: screening of grass or forage samples for novel toxic compounds. J Mass Spectrom. 2005;40:1484–502. 10.1002/jms.933 [DOI] [PubMed] [Google Scholar]
- 4.Schiff PL, Jr. Ergot and its alkaloids. Am J Pharm Educ. 2006;70:98. 10.5688/aj700598 [DOI] [PMC free article] [PubMed] [Google Scholar]
- 5.Müller C, Kemmlein S, Klaffke H, Krauthause W, Preiß-Weigert A, Wittkowski R. A new method for the analysis of ergot alkaloids in rye and selected rye products. Mol Nutr Food Res. 2009;53:500–7. 10.1002/mnfr.200800091 [DOI] [PubMed] [Google Scholar]
- 6.van Dongen PW, de Groot AN. History of ergot alkaloids from ergotism to ergometrine. Eur J Obstet Gynecol Reprod Biol. 1995;60:109–16. 10.1016/0028-2243(95)02104-Z [DOI] [PubMed] [Google Scholar]
- 7.Kokkonen M, Jestoi M. Determination of ergot alkaloids from grains with UPLC-MS/MS. J Sep Sci. 2010;33:2322–7. 10.1002/jssc.201000114 [DOI] [PubMed] [Google Scholar]
- 8.Franzmann C, Schröder J, Münzing K, Wolf K, Lindhauer MG, Humpf HU. Distribution of ergot alkaloids and ricinoleic acid in different milling fractions. Mycotoxin Res. 2011;27:13–21. 10.1007/s12550-010-0070-7 [DOI] [PubMed] [Google Scholar]
- 9.Reinhard H, Rupp H, Zoller O. Ergot alkaloids: Quantitation and recognition challenges. Mycotoxin Res. 2008;24:7–13. 10.1007/BF02985264 [DOI] [PubMed] [Google Scholar]
- 10.European Commission. 2012/154/EU: Commission Recommendation of 15 March 2012 on the monitoring of the presence of ergot alkaloids on feed and food; 2012.
- 11.Ware GM, Price G, Carter L, Jr, Eitenmiller RR. Liquid chromatographic preparative method for isolating ergot alkaloids, using a particle-loaded membrane extracting disk. J AOAC Int. 2000;83:1395–9. [PubMed] [Google Scholar]
- 12.Lombaert GA, Pellaers P, Roscoe V, Mankotia M, Neil R, Scott PM. Mycotoxins in infant cereal foods from the Canadian market. Food Addit Contam. 2003;20:494–504. 10.1080/0265203031000094645 [DOI] [PubMed] [Google Scholar]
- 13.Lauber U, Schnaufer R, Gredziak M, Kiesswetter Y. Analysis of rye grains and rye meals for ergot alkaloids. Mycotoxin Res. 2005;21:258–62. 10.1007/BF02957588 [DOI] [PubMed] [Google Scholar]
- 14.Müller C, Klaffke HS, Krauthause W, Wittkowski R. Determination of ergot alkaloids in rye and rye flour. Mycotoxin Res. 2006;22:197–200. 10.1007/BF02946741 [DOI] [PubMed] [Google Scholar]
- 15.Mohamed R, Gremaud E, Richoz-Payot J, Tabet JC, Guy PA. Quantitative determination of five ergot alkaloids in rye flour by liquid chromatography-electrospray ionization tandem mass spectrometry. J Chromatogr A. 2006;1114:62–72. 10.1016/j.chroma.2006.02.035 [DOI] [PubMed] [Google Scholar]
- 16.Sulyok M, Berthiller F, Krska R, Schumacher R. Development and validation of a liquid chromatography/tandem mass spectrometric method for the determination of 39 mycotoxins in wheat and maize. Rapid Commun Mass Spectrom. 2006;20:2649–59. 10.1002/rcm.2640 [DOI] [PubMed] [Google Scholar]
- 17.Krska R. Determination of ergot alkaloids: purity and stability assessment of standards and optimization of extraction conditions for cereal samples. J AOAC Int. 2008;91:1363–71. [PubMed] [Google Scholar]
- 18.Krska R, Crews C. Significance, chemistry and determination of ergot alkaloids: A review. Food Addit Contam Part A Chem Anal Control Expo Risk Assess. 2008;25:722–31. 10.1080/02652030701765756 [DOI] [PubMed] [Google Scholar]
- 19.Hafner M, Sulyok M, Schuhmacher R, Crews C, Krska R. Stability and epimerisation behaviour of ergot alkaloids in various solvents. World Mycotox J. 2008;1:67–78. 10.3920/WMJ2008.x008 [DOI] [Google Scholar]
- 20.Uhlig S, Petersen D. Lactam ergot alkaloids (ergopeptams) as predominant alkaloids in sclerotia of Claviceps purpurea from Norwegian wild grasses. Toxicon. 2008;52:175–85. 10.1016/j.toxicon.2008.05.002 [DOI] [PubMed] [Google Scholar]
- 21.Merkel S, Dib B, Maul R, Köppen R, Koch M, Nehls I. Degradation and epimerization of ergot alkaloids after baking and in vitro digestion. Anal Bioanal Chem. 2012;404:2489–97. 10.1007/s00216-012-6386-8 [DOI] [PubMed] [Google Scholar]
- 22.Scott PM, Lombaert GA, Pellaers P, Bacler S, Lappi J. Ergot alkaloids in grain foods sold in Canada. J AOAC Int. 1992;75:773–9. [Google Scholar]
- 23.Ruhland M, Tischler J. Determination of ergot alkaloids in feed by HPLC. Mycotoxin Res. 2008;24:73–9. 10.1007/BF02985284 [DOI] [PubMed] [Google Scholar]
- 24.Wolff J, Neudecker C, Klug C, Weber R. Chemical and toxicological investigations of ergot in flour and bread. Z Ernahrungswiss. 1988;27:1–22. 10.1007/BF02021291 [DOI] [PubMed] [Google Scholar]
- 25.Klug C, Baltes W, Krönert W, Weber R. Methods of determination of ergot alkaloids in food. Z Lebensm Unters Forsch. 1988;186:108–13. 10.1007/BF01042702 [DOI] [PubMed] [Google Scholar]
- 26.Lenain P, Di Mavungu JD, Dubruel P, Robbens J, De Saeger S. Development of suspension polymerized molecularly imprinted beads with metergoline as template and application in a solid-phase extraction procedure toward ergot alkaloids. Anal Chem. 2012;84:10411–8. 10.1021/ac302671h [DOI] [PubMed] [Google Scholar]
- 27.Storm ID, Rasmussen PH, Strobel BW, Hansen HCB. Ergot alkaloids in rye flour determined by solid-phase cation-exchange and high-pressure liquid chromatography with fluorescence detection. Food Addit Contam Part A Chem Anal Control Expo Risk Assess. 2008;25:338–46. 10.1080/02652030701551792 [DOI] [PubMed] [Google Scholar]
- 28.Appelt M, Ellner FM. Investigations into the occurrence of alkaloids in ergot and single sclerotia from the 2007 and 2008 harvests. Mycotoxin Res. 2009;25:95–101. 10.1007/s12550-009-0014-2 [DOI] [PubMed] [Google Scholar]


