ABSTRACT
Alphaherpesviruses such as herpes simplex virus and pseudorabies virus (PRV) are neuroinvasive double-stranded DNA (dsDNA) viruses that establish lifelong latency in peripheral nervous system (PNS) neurons of their native hosts. Following reactivation, infection can spread back to the initial mucosal site of infection or, in rare cases, to the central nervous system, with usually serious outcomes. During entry and egress, viral capsids depend on microtubule-based molecular motors for efficient and fast transport. In axons of PNS neurons, cytoplasmic dynein provides force for retrograde movements toward the soma, and kinesins move cargo in the opposite, anterograde direction. The dynamic properties of virus particles in cells can be imaged by fluorescent protein fusions to the small capsid protein VP26, which are incorporated into capsids. However, single-color fluorescent protein tags fail to distinguish the virus inoculum from progeny. Therefore, we established a dual-color system by growing a recombinant PRV expressing a red fluorescent VP26 fusion (PRV180) on a stable cell line expressing a green VP26 fusion (PK15-mNG-VP26). The resulting dual-color virus preparation (PRV180G) contains capsids tagged with both red and green fluorescent proteins, and 97% of particles contain detectable levels of mNeonGreen (mNG)-tagged VP26. After replication in neuronal cells, all PRV180G progeny exclusively contain monomeric red fluorescent protein (mRFP)-VP26-tagged capsids. We used PRV180G for an analysis of axonal capsid transport dynamics in PNS neurons. Fast dual-color total internal reflection fluorescence (TIRF) microscopy, single-particle tracking, and motility analyses reveal robust, bidirectional capsid motility mediated by cytoplasmic dynein and kinesin during entry, whereas egressing progeny particles are transported exclusively by kinesins.
IMPORTANCE Alphaherpesviruses are neuroinvasive viruses that infect the peripheral nervous system (PNS) of infected hosts as an integral part of their life cycle. Establishment of a quiescent or latent infection in PNS neurons is a hallmark of most alphaherpesviruses. Spread of infection to the central nervous system is surprisingly rare in natural hosts but can be fatal. Pseudorabies virus (PRV) is a broad-host-range swine alphaherpesvirus that enters neuronal cells and utilizes intracellular transport processes to establish infection and to spread between cells. By using a virus preparation with fluorescent viral capsids that change color depending on the stage of the infectious cycle, we find that during entry, axons of PNS neurons support robust, bidirectional capsid motility, similar to cellular cargo, toward the cell body. In contrast, progeny particles appear to be transported unidirectionally by kinesin motors toward distal egress sites.
INTRODUCTION
Alphaherpesviruses (e.g., human herpes simplex virus [HSV] and swine pseudorabies virus [PRV]) are neuroinvasive double-stranded DNA (dsDNA) viruses with virions consisting of a nucleocapsid surrounded by a proteinaceous tegument layer and a membrane envelope (1). Infections of susceptible hosts usually initiate at peripheral mucosal sites. After an amplification step in epithelial cells, virions are taken up at distal axonal regions of peripheral nervous system (PNS) neurons. Capsids are subsequently transported along microtubules (MTs) toward PNS neuronal cell bodies and dock onto nuclear pore complexes (2, 3). In both neuronal and nonneuronal cells, postentry capsid transport to the nucleus is mediated by the cytoplasmic dynein/dynactin molecular motor complex (4–6). Cytoplasmic dynein is a 1.5-kDa multiprotein complex that generates force toward the MT minus end, propelling cellular and viral cargo in the retrograde direction (7). Once the viral DNA is delivered to the nucleus, it establishes, in the natural host, a brief phase of productive infection followed by a quiescent state producing no infectious progeny. Upon reactivation from this quiescent state, viral progeny particles are produced, which transport along MTs and spread back to initial sites of infection or, very rarely, to synaptically connected central nervous system (CNS) neurons. Due to the pseudounipolar architecture of infected PNS sensory neurons, transport to distal egress sites in the CNS or in the periphery is mediated by kinesin motors, e.g., by kinesin-3 (Kif1A) (8). The small capsid protein of PRV, VP26, has been used to introduce fluorescent protein tags into the virion in high copy numbers, thereby facilitating early studies of virion entry and intracellular transport (9, 10). However, it is impossible to distinguish entering particles from progeny particles by using virions expressing single-color fluorescent capsid proteins (11). Therefore, we established a protocol to produce dual-color PRV virions that incorporate mNeonGreen (mNG)-tagged VP26, which originates from a producer cell line and remains present only during entry, and monomeric red fluorescent protein (mRFP)-VP26, which is encoded in the viral genome and present predominantly during egress. We isolated a stable PK15 cell line expressing mNG-VP26 (PK15-mNG-VP26). After infection with PRV180 (expressing mRFP-VP26), a dual-color virus preparation, called PRV180G, can be isolated. Early in infection, mNG-VP26 is incorporated into the vast majority of newly formed PRV180G capsids. These PRV180G virions enter cells almost exclusively as yellow or green particles. However, after infection and replication in cells that do not express the mNG-VP26 transgene, progeny virions contain only the genetically encoded mRFP-VP26. This color distinction enabled us to characterize the dynamics of entering and egressing PRV180G particles in neuronal cultures with high spatial and temporal resolutions using dual-color total internal reflection fluorescence (TIRF) microscopy. We find that axonal transport dynamics of PRV capsids in PNS neurons during entry closely resemble those reported previously for bidirectional cargo transport mediated by kinesin-1 and cytoplasmic dynein. In contrast, transport dynamics during egress appear to be unidirectional and dominated by kinesin-3.
MATERIALS AND METHODS
Cellular methods and viruses.
Cell lines used for this study, including human 293FT (Invitrogen) and porcine kidney epithelial (PK15) cells, were maintained in Dulbecco's modified Eagle's medium (DMEM) (HyClone) supplemented with 10% fetal bovine serum (FBS) (HyClone) at 37°C with 5% CO2. To produce a stable PK15 cell line expressing mNG-VP26, we cloned the PRV UL35 gene, which encodes VP26, into a third-generation lentivirus vector (contains only gag, pol, and rev genes) as follows. We PCR amplified PRV UL35 with mNG inserted between the second and third codons (12) with primers containing flanking attB sites. We then inserted the PCR product into a pLenti destination plasmid (pLenti CMV Hygro DEST, plasmid 17454; Addgene, Cambridge, MA) by Gateway recombination. The lentivirus vector was made by 293FT cell transfection according to the manufacturer's instructions, and the resulting stock was used to transduce PK15 cells. A stable PK15-mNG-VP26 clonal cell line was isolated after hygromycin selection (0.1 mg/ml; InvivoGen), fluorescence-activated cell sorter (FACS) analysis (Princeton University Molecular Biology Flow Cytometry Facility), and single-cell dilution.
Growth curve analysis was performed by plating 104 cells/well in a six-well plate, with incubation under standard cell culture conditions, and the number of cells was counted every 2 days thereafter.
PRV Becker was used as wild-type strain, and PRV180 is a recombinant strain expressing the mRFP-VP26 red capsid tag (13).
All virus titers were determined by serial dilution plaque assays on PK15 cells.
Culture of primary neuronal cells.
Neurons of embryonic rat superior cervical ganglia (SCG) were isolated and cultured as previously described (14). Briefly, SCG were dissected from embryonic day 17 (E17) Sprague-Dawley rat embryos (Hilltop Labs Inc., Pittsburgh, PA) and then plated and maintained in neuronal medium consisting of neurobasal medium (Invitrogen) supplemented with 1% penicillin-streptomycin with 2 mM glutamine (Invitrogen), 2% B27 (Invitrogen), and 100 ng/ml neuronal growth factor (NGF). Plates were either glass-bottom (MatTek, Ashland, MA) or plastic-bottom (Ibidi, Madison, WI) dishes, all precoated before cell plating with 500 μg/ml of poly-dl-ornithine (Sigma-Aldrich) for 24 h at 37°C and 10 μg/ml of natural murine laminin (Invitrogen) for at least 12 h at 37°C.
Plastic dishes were further processed for chambered SCG cultures to separate axon extensions from cell bodies by mounting modified Campenot chambers: a series of parallel grooves were etched across the surface and covered with 1% methylcellulose in DMEM. A CAMP320 three-chambered Teflon ring (Tyler Research, Edmonton, Alberta, Canada) was then coated with vacuum grease on one side and placed on top of the tissue culture surface, oriented such that the grooves extended across all three compartments. Forty-eight hours after SCG cell plating, 1 mM cytosine-d-arabinofuranoside (Sigma-Aldrich) was added for 2 days to kill nonneuronal dividing cells. All SCG cultures were allowed to differentiate for at least 14 days prior to infection.
All animal work was performed in accordance with Princeton Institutional Animal Care and Use Committee protocols (protocol 1851-14).
PRV infections.
PK15 and PK15-mNG-VP26 cells were infected with PRV Becker or PRV180 at a multiplicity of infection (MOI) of 5 for the indicated times postinfection (p.i.). Infected cells or supernatants were harvested and analyzed by microscopic or biochemical methods. For plaque growth analysis, infected cells were overlaid with 1% methylcellulose in DMEM containing 2% FBS. Neuronal cells were infected with 105 PFU (∼MOI of 5) of PRV180G in 200 μl of fresh culture medium. Chambered cultures were infected in the neurite (N) compartment alone or in the neurite and soma (S) compartments simultaneously. Mycalolide B (MB) was purchased from Enzo Life Science (catalog number BML-T123) and added to the middle (M) compartment at a concentration of 4 μM.
Western blotting and antibodies.
For SDS-PAGE, cells were lysed after two washes twice with phosphate-buffered saline (PBS) (HyClone) and one wash with radioimmunoprecipitation assay (RIPA) buffer (10 mM Tris HCl, 150 mM NaCl, 1 mM EDTA, and 1 mM EGTA [pH 7.4]). Samples were then taken up in RIPA buffer, kept on ice for 15 min, centrifuged at 13,200 rpm at 4°C, transferred into new tubes, and mixed with 8× Laemmli buffer. Samples were heated at 100°C for 5 min before proteins were separated on gradient polyacrylamide gels (4 to 12%) (NuPage; Invitrogen), which were run at 175 V for 50 min. Proteins were transferred onto a polyvinylidene difluoride (PVDF) membrane (0.45-μm pore size) (Immobilon-P; Millipore) using semidry transfer (Bio-Rad). After transfer, membranes were incubated in 5% nonfat dry milk in PBST (PBS plus 0.1% Tween 20) for 1 h at room temperature. Immunoblot analyses were performed by using primary and secondary antibodies in a 5% milk–PBST solution. Membranes were incubated with chemiluminescent substrates (SuperSignal West Pico or Dura; Thermo Scientific). Protein bands were visualized by exposure on HyBlot CL blue X-ray films (Denville Scientific).
Antibodies used in this study included a monoclonal antitubulin antibody (clone E7) obtained from the Developmental Studies Hybridoma Bank, created by the NICHD, NIH, and maintained at the University of Iowa (Iowa City, IA); a monoclonal anti-VP5 antibody (clone 3C10) (15); and a polyclonal anti-VP26 antibody.
Microscopy and analysis of capsid color profiles and motility.
Plaque growth of PRV180 in PK15-mNG-VP26 cells was imaged by using a Nikon Ti-Eclipse inverted epifluorescence microscope (Nikon Instruments, Melville, NY) equipped with separate fast-switching excitation and emission filter wheels (Prior Scientific, Rockland, MA) and a heated cell culture chamber (Ibidi) to ensure biologically relevant environmental conditions during image acquisition. Images were acquired with a CoolSnap ES2 charge-coupled-device (CCD) camera (Photometrics, Tucson, AZ) and a Nikon Plan Fluor extra-long working distance (ELWD) 20× (numerical aperture [NA], 0.45) objective (Nikon Instruments) in two fluorescence channels at a frequency of 1 frame every 5 min.
For microscopy of PRV180G in neuronal cells, we used high-resolution dual-color imaging on an inverted Nikon Ti-Eclipse TIRF microscope equipped with an Agilent laser source producing ∼65 mW of 488-nm and 561-nm light at the fiber exit, a Nikon Apo TIRF 100× (NA, 1.49) objective, and an iXon Ultra electron-multiplying charge-coupled-device (EM-CCD) camera (Andor Technology, South Windsor, CT) run through Nikon NIS AR software (Princeton University Molecular Biology Confocal Microscopy Facility). Lasers at 488 and 561 nm were used at no more than 30% of their maximal output and allowed trigger acquisition at a frame rate of 18.7 frames per second (fps) with a 25-nm spatial resolution.
We determined the color profile of individual PRV180G particles by comparing the relative red and green absorbance maxima of line scans through at least 500 immobilized particles under each condition. The channel-specific fluorescence cutoff was set to one-fifth of the maximal fluorescence within the particle population.
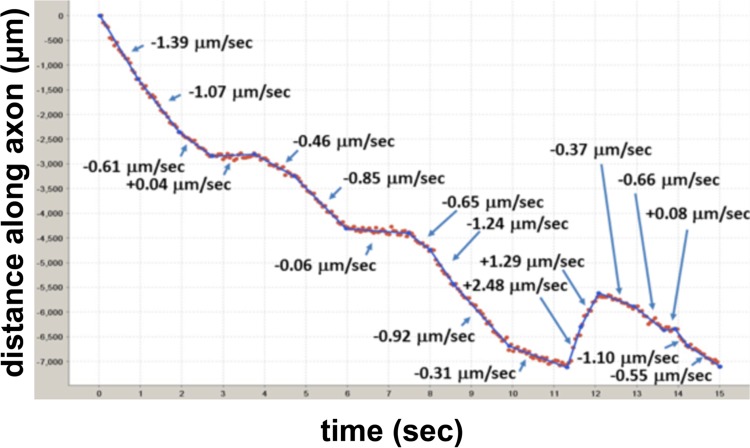
Particle tracking and motility analysis were performed as described previously for adenovirus (16) but with modifications for PRV180G. Briefly, a custom tracking algorithm was used to extract the position of virus particles as a function of time. All fluorescent particles were fit to two-dimensional (2-D) Gaussian profiles and treated as coming from a diffraction-limited point source. Positions of each particle were obtained from the Gaussian fits (17, 18). Trajectories were reconstructed by matching particle locations based on their displacements between frames. To limit contributions of rare but long nonmotile particle tracks as well as to reduce the relative contribution of very long pauses, parts of tracks with an asymmetry parameter below 1.0 (±25-point window) were eliminated from the analysis (19). Trajectories were then automatically parsed into segments of a constant velocity (v) (see also Fig. 4) (20). Previously reported analyses focused on motile events longer than 400 to 500 nm (6, 11). To mimic this, velocities were analyzed for long segments above the standard motility cutoff only (2σ value of the zero-centered peak in the segment length [SL] distribution). The cutoff was usually in the range of 2 to 4 capsid diameters (300 to 600 nm). All segments above the cutoff were used to assemble segment length histograms with decay curve fits.
FIG 4.
Particle tracking and segment analysis of axonal PRV particles. The locations of the capsid were determined in each frame by Gaussian fitting (red dots). These data were then used to extract individual tracks for each particle, which were then parsed into segments of a constant velocity (blue lines). Representative capsid movement during entry in a Campenot chamber is shown. Negative values indicate motility in the retrograde direction.
RESULTS
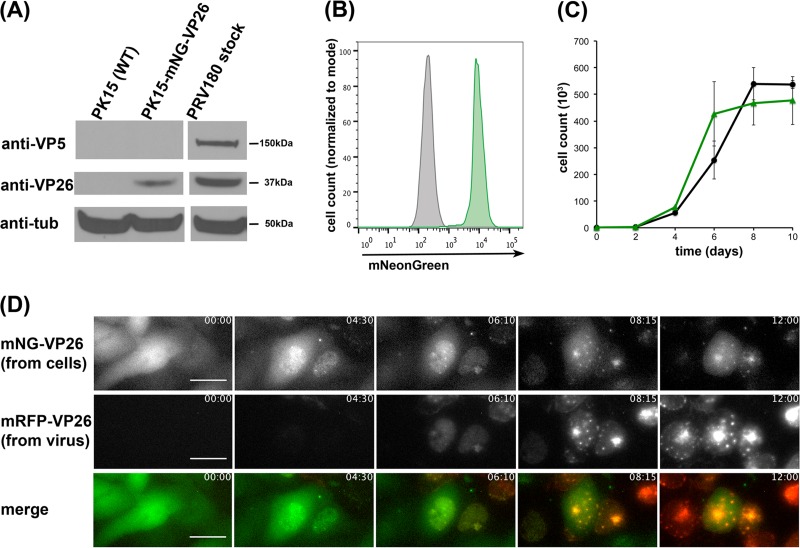
We used lentivirus transduction to establish a stable PK15 cell line expressing mNG-VP26 driven by a constitutively active cytomegalovirus (CMV) immediate early promoter. After clonal selection, PK15-mNG-VP26 cells exhibited robust expression of mNG-VP26 (Fig. 1A). PK15-mNG-VP26 cells represented a homogeneous cell population (Fig. 1B) and showed growth rates that were similar to those of parental PK15 cells (Fig. 1C), in contrast to data from a previous report (21). We next performed time-lapse fluorescence microscopy on PK15-mNG-VP26 cells infected with PRV180, which expresses mRFP-VP26, and saw a change of the mNG-VP26 localization during infection (Fig. 1D; see also Movie S1 in the supplemental material). Before infection, mNG-VP26 fluorescence was distributed throughout the cell. During infection, the signal changed its localization predominantly to the nucleus, where it formed characteristic intranuclear aggregate structures (“assemblons”) (22). This pattern was consistent with that of wild-type and tagged VP26 proteins in infected cells (23). These results indicate that PK15-mNG-VP26 represents a stable cell line expressing a functional mNG-VP26 protein.
FIG 1.
The clonal PK15-mNG-VP26 cell line stably expresses mNG-VP26. (A) Protein levels in lysates of wild-type (WT) PK15 cells and PK15-mNG-VP26 cells or the PRV180 virus stock were evaluated by immunoblotting using anti-VP26 (small capsid protein), anti-VP5 (large capsid protein), and anti-tubulin (anti-tub) antibodies. (B) Flow cytometry profiles of wild-type PK15 (gray) and PK15-mNG-VP26 (green) cells indicate two separate, homogenous cell populations based on mNeonGreen expression. At least 5,000 cells were analyzed under each condition. (C) Cell growth curve analysis of wild-type PK15 (black) and PK15-mNG-VP26 (green) cells shows similar growth rates through confluence. (D) Single frames of continuous image acquisition following PRV180 infection of PK15-mNG-VP26 cells over 12 h. Note the onset of mNG-VP26 nuclear localization prior to mRFP-VP26 detection and the colocalization of both signals in intranuclear assemblon structures. Importantly, most cells lose their green fluorescence signal within 6 to 8 h p.i. Bar, 25 μm. The time stamp shows hours:minutes. (Also see Movie S1 in the supplemental material.)
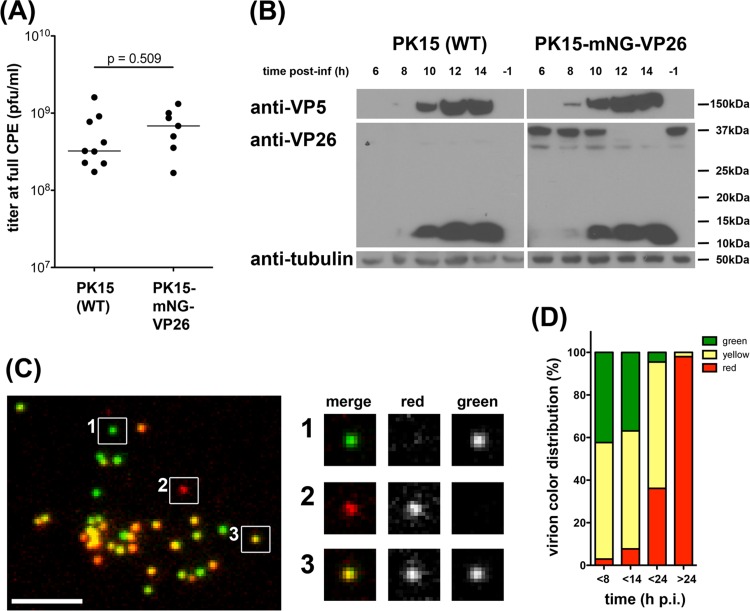
PK15-mNG-VP26 cells also supported the efficient growth of PRV to high titers at full cytopathic effect (CPE), comparably to PK15 cells (Fig. 2A). We expected the ratio of cellular mNG-VP26 to viral VP26 to decrease during the course of infection before full CPE was reached and to strongly influence the color composition of released virions. To determine the expression profile of mNG-VP26 during PRV infection, we lysed PK15-mNG-VP26 cells at different times postinfection (p.i.) with the PRV Becker wild-type strain (Fig. 2B). Western blotting of lysates with anti-VP26 antibodies indicated a reduction in cellular mNG-VP26 expression between 10 and 12 h p.i., whereas VP26 expression by PRV Becker was detectable only after 8 h p.i. We determined the optimal harvest time for PRV180G by analyzing supernatants of PRV180-infected PK15-mNG-VP26 cells and determining fluorescence profiles of concentrated virions immobilized on glass coverslips (Fig. 2C and D). In line with the abundance of VP26 in cell lysates, at 8 h p.i., >97% of all particles contained mNG-VP26 (green and yellow particles), and ∼56% of those particles also contained mRFP-VP26 (yellow particles). We used this virion population (called PRV180G), since virions harvested at later times showed a reduced incorporation of mNG-VP26 (Fig. 2D). We did not observe any recombination events where mNG-VP26 replaced mRFP-VP26 in the viral genome (data not shown).
FIG 2.
PK15-mNG-VP26 cells produce dual-color PRV180G. (A) Titer of PRV stocks grown on wild-type (WT) PK15 (n = 9) and PK15-mNG-VP26 (n = 7) cells until full CPE indicates no difference (P = 0.509) in maximal titers of either cell line. (B) Protein levels in lysates of PK15 (wild-type) and PK15-mNG-VP26 cells infected with PRV Becker (untagged VP26) for the indicated times were evaluated by immunoblotting using anti-VP26 (small capsid protein), anti-VP5 (large capsid protein), and anti-tubulin antibodies. Synthesis of untagged VP26 was detectable at 8 to 10 h p.i., together with VP5 expression. At 10 to 12 h p.i., mNG-VP26 expression declined rapidly. (C) Micrograph of purified PRV180G capsids harvested at 8 h p.i., spotted onto a coverslip, and imaged at a ×100 magnification in red and green channels. Three individual capsids were chosen to illustrate green, red, and yellow color profiles. Bar, 5 μm. (D) Bar graph indicating the color profile of PRV180G depending on the harvest time. PK15-mNG-VP26 cells were infected with PRV180 at an MOI of 1 before supernatants were collected at the indicated times p.i., and the color of >750 particles per stock was analyzed.
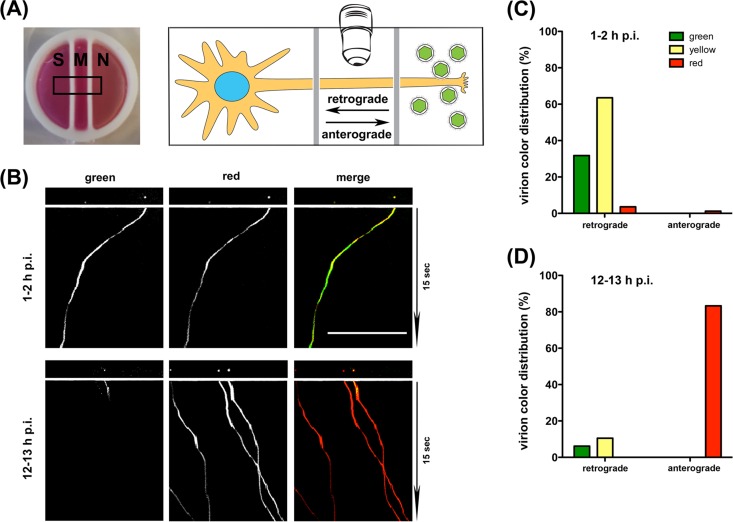
To test if the color profile of PRV180G is representative of entering or progeny particles during axonal transport, we infected the axons of rat superior cervical ganglion (SCG) neurons in the neurite (N) compartment of modified Campenot trichambers, which physically separate the cell soma (S) from axons (Fig. 3A) (14). We used high-resolution dual-color imaging of moving capsids in the middle (M) compartment on an inverted TIRF microscope with trigger acquisition at 18.7 fps. Within 120 min of axonal infection with 105 PFU of PRV180G, the vast majority of yellow or green input particles exhibited retrograde motility toward the cell soma (Fig. 3B and C; see also Movie S2 in the supplemental material). At 12 to 13 h p.i., after progeny particles are formed in the cell bodies, most particles were exclusively red and moved in the anterograde direction, away from the soma (Fig. 3B and D; see also Movie S3 in the supplemental material). However, about 15% of particles were part of the initial inoculum and were transported in the retrograde direction. At later time points (18 to 20 h p.i.), we also observed red particles moving in the retrograde direction, which is indicative of PRV180G progeny that, after anterograde transport, reentered axons (data not shown). Of note, we detected yellow or green input particles moving in the retrograde direction as late as 18 h p.i. This suggests that virion entry and the initiation of retrograde transport of some particles were delayed and that these late-entering particles may affect the analysis of anterograde capsid transport when inoculum and progeny virions cannot be separated by color (11). These results demonstrate that PRV180G can be used to distinguish particles at different entry or egress stages based on their color profile.
FIG 3.
PRV180G represents a robust marker of entering and egressing particles. (A) Photograph (left) and illustration (right) of the experimental setup utilizing modified Campenot chambers to separate the soma (S), axon (M), and axon termini (N) of superior cervical ganglion neurons. Neurons were infected with PRV180G in the N compartment, and particles were imaged in the M compartment. Labeled arrows indicate retrograde and anterograde directions of motility. Chambers have an outer diameter of 20 mm. (B) First frame and kymographs of movies showing motile PRV180G at early (top) and late (bottom) times p.i. Cells were imaged in dual-color TIRF mode for 15 s at 18.7 fps, with minimal delay between color changes. Bar, 25 μm. (Also see Movies S2 and S3 in the supplemental material.) (C) Bar graphs of PRV180G color distribution in SCG neurons at early (top) and late (bottom) times p.i. The majority of particles imaged at 1 to 2 h p.i. move retrogradely and contain green capsid tags. At 12 to 13 h p.i., after replication, most particles are red and move anterogradely.
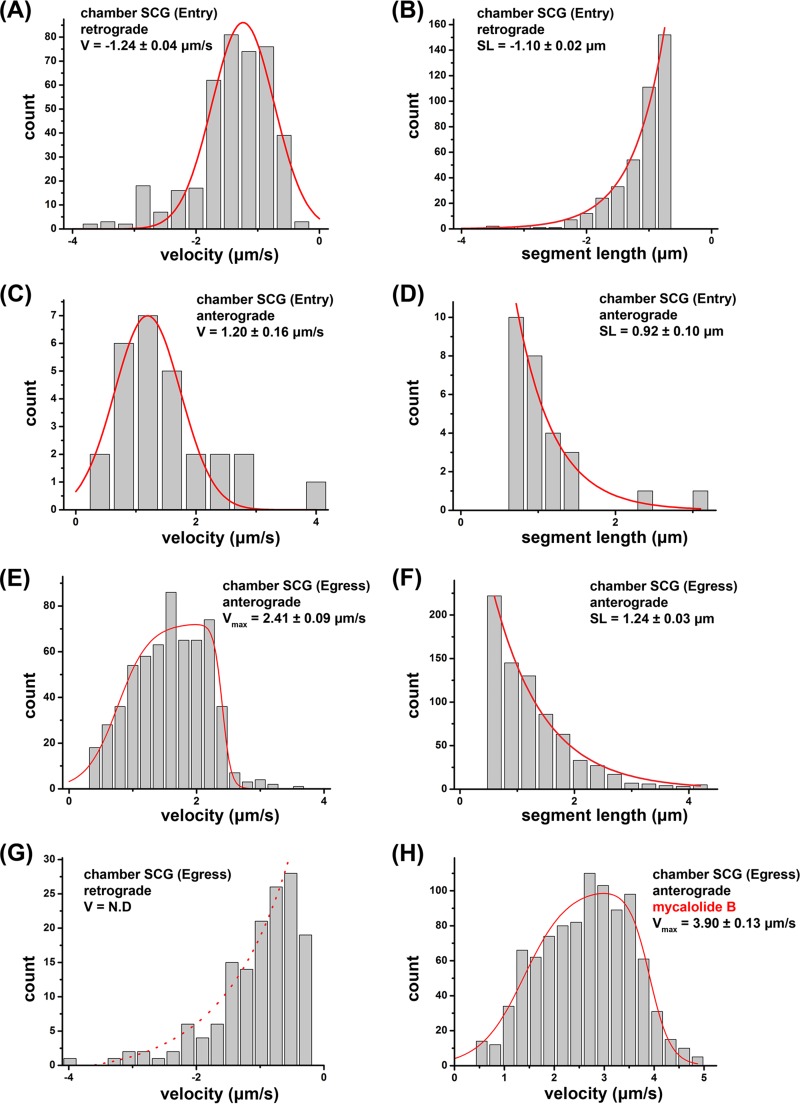
Using SCG neurons in compartmented chambers, we determined if PRV180G could be utilized to assess motility dynamics of entering and egressing capsids, which might help identify active motor proteins. We relied on automated particle detection (25-nm resolution), tracking, and motility analysis software to determine segments of constant capsid velocities (16, 24) (Fig. 4; see also Materials and Methods). Segment lengths (SL) and velocities (v) of retrograde and anterograde capsid motility events during entry and egress indicated the involvement of MT-dependent motor proteins. Retrograde motion dominated the dynamics of entering capsids, with an average v of −1.24 ± 0.04 μm/s (fit value ± standard error of the mean [SEM]) (negative values indicate retrograde motility) (Fig. 5A) and an average segment length (SL) of −1.10 ± 0.02 μm (mean value ± SEM) (Fig. 4B), but anterograde motion was also, albeit rarely, observed (v = 1.20 ± 0.16 μm/s; SL = 0.92 ± 0.10 μm) (Fig. 5C and D). Motility events during axonal entry stages were consistent with organelle movements driven by cytoplasmic dynein/dynactin and kinesin-1 in rodent cells (25) and previous reports of PRV capsid motility (11). Newly formed progeny capsids showed anterograde motion exclusively, with a broad velocity profile ranging up to a maximum velocity (vmax) of 2.41 ± 0.09 μm/s and a characteristic SL of 1.24 ± 0.03 μm (Fig. 5E and F). This wide distribution of observed velocities suggested that particles encounter heterogeneity in microtubule motors, motor regulatory factors, or the local axonal environment during anterograde axonal transport. The higher velocities observed were clearly distinct from those expected for kinesin-1 motors but consistent with motility driven by kinesin-3 (Kif1A), either alone or in combination with other kinesin motors (26, 27). The retrograde velocity distribution during egress lacked a distinct peak but could be fitted to an overall decay trend (Fig. 5G), indicating the absence of active retrograde motors. Hence, the contribution of cytoplasmic dynein to capsid egress is small or absent. We further validated the influence of the load inflicted by cytoplasmic dynein/dynactin or actin filaments on egressing particles. We treated axons with the macrolide toxin mycalolide B (MB), which acutely disrupts the dynactin complex (28) and inhibits actin polymerization (29). MB treatment at 12 h p.i. increased anterograde motility, with a vmax of 3.90 ± 0.13 μm/s (Fig. 5H), at an MB concentration sufficient to block retrograde transport during egress (data not shown), indicating that actin and cytoplasmic dynein/dynactin contribute to opposing loads for kinesin motors but fail to produce measurable retrograde transport steps.
FIG 5.
High-resolution motility analysis of PRV180G in SCG cultures in Campenot chambers. After infection of SCG cultures, PRV180G capsids were tracked at high temporal and spatial resolutions (18.7 fps and 25 nm, respectively), and capsid velocity (V) and segment length (SL) were analyzed in an automated fashion (Fig. 4). (A to D) During entry, retrograde movements show robust motility (A and B) but are opposed by anterograde movements (C and D). (E to G) During egress, only active anterograde motility is detectable (E and F), whereas retrograde movements represent passive diffusion (G). (H) Anterograde velocity of egressing particles is enhanced after treatment with 4 μM mycalolide B, which inhibits actin polymerization and dynein/dynactin function. In panels A and C, the Gaussian fit is in red, and fit modes ± SEM are reported. In panels B, D, F, and G, the exponential decay fit is in red, and decay lengths from the fit ± SEM are reported. In panels E and H, the asymmetric double sigmoidal fit is in red, which represents a phenomenological fit to capture the key features of the observed velocity distribution (gradual rise, plateau, and falloff). Values indicate the midpoints of the falloff (vmax) and 95% confidence intervals (estimated by bootstrap resampling). N.D indicates that no significant velocity peak was detectable.
Taken together, the motility data indicate that capsid entry is mediated mostly by cytoplasmic dynein, with a minor contribution by kinesin-1, whereas capsid egress is driven by kinesin motors alone.
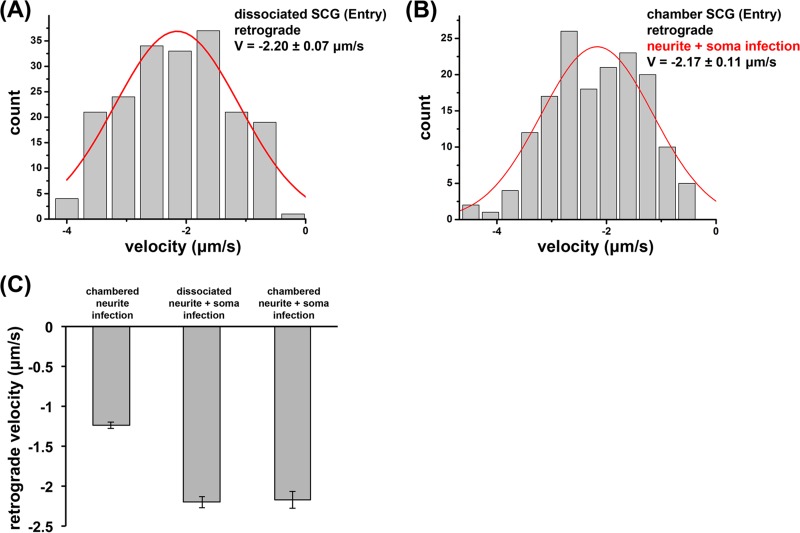
In addition, we expanded our motility analysis to PRV180G entry in dissociated SCG neurons. Within the first 120 min after infection, dissociated SCG neurons supported capsid motility similarly to axons of SCG neurons grown in chambers albeit at higher retrograde velocities of −2.20 ± 0.07 μm/s (Fig. 6A), which were similar to previously reported results for dissociated cultures (30). This difference in observed velocities suggested that there may be unknown biological differences between neurons grown in chambers and those grown in dissociated cultures. Therefore, we again measured retrograde velocities of PRV180G after axonal infections in Campenot chambers. However, we now simultaneously exposed the cell bodies to PRV Becker and found an increase in the retrograde capsid velocity, −2.17 ± 0.11 μm/s (Fig. 6B), compared to that for axonal infections only. These data indicate clearly that cell body exposure to PRV affects retrograde axonal motility by increasing the average capsid velocity ∼1.7-fold (Fig. 6C).
FIG 6.
Infection regimen affects retrograde axonal transport velocities of entering PRV180G capsids. (A and B) PRV180G capsids were tracked between 1 and 2 h p.i. at high temporal and spatial resolutions (18.7 fps and 25 nm, respectively), and the capsid velocity (V) was automatically analyzed in dissociated SCG cultures (A) or chambered SCG cultures where S and N compartments were infected simultaneously (B). Retrograde axonal transport velocities reached similar high levels. Gaussian fits are shown in red. Fit modes ± SEM are reported. (C) Bar graph summarizing average retrograde axonal transport velocities during entry in chambered and dissociated neurons. Exposure of the cell soma increases velocities ∼1.7-fold.
DISCUSSION
We isolated a stable pig kidney cell line expressing the PRV small capsid protein fusion mNG-VP26 (PK15-mNG-VP26). Previous attempts to clone a similar rabbit cell line expressing VP26 indicated that the constitutive expression of VP26 had a detrimental effect leading to slow growth and instability (21). We isolated cells with intermediate levels of mNG-VP26 expression in an attempt to mitigate detrimental effects. PK15-mNG-VP26 cells show robust, homogenous expression of the fusion protein for many passages. In infected cells, mNG-VP26 expression declines by 10 to 12 h p.i., presumably due to virion host shutoff (VHS) (31). Therefore, we use early harvest times to produce stocks of dual-color virions after infection with PRV180. These virions (PRV180G) have transiently acquired a green capsid tag but express a genetically encoded red capsid tag. Therefore, the color change is “encoded” in the PRV180G genome, independent of the cell type and culturing technique, and requires no external perturbations, in contrast to previously reported protocols (32). We show that in SCG cultures grown in Campenot chambers, PRV180G reliably discriminates entering inoculum particles from egressing progeny particles based on their color profiles. The majority of particles during axonal entry are yellow or green and move toward the cell body (retrograde transport), whereas progeny particles are exclusively red and move away from the cell body (anterograde transport). Late in infection (12 to 13 h p.i.), however, we also detected ∼15% of moving capsids to be retrogradely moving yellow or green input capsids. These capsids were delayed either in entry or in transport kinetics and could have confounded interpretations of results from previous experiments (11). Furthermore, PRV180G represents a powerful tool to dissect retrograde and anterograde capsid motility in dissociated neuronal cultures as well as in in vivo experiments.
Capsid motility during entry.
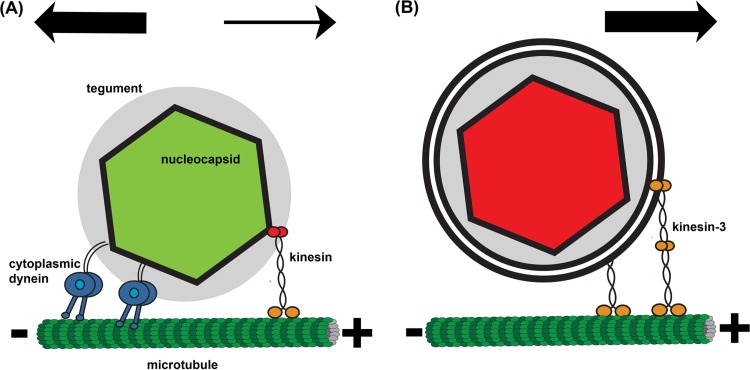
To our knowledge, this is the first report of axonal herpesvirus motility recorded by two-color TIRF microscopy at high spatial and temporal resolutions (25 nm and 18.7 fps, respectively). Our imaging parameters allow detailed automated particle analysis, which reveals the involvement of opposing motors during capsid entry (Fig. 7A). The overall direction of motility is toward the soma and dominated by long segments of retrograde motion. Motility segments in the anterograde direction were also observed but at a ∼13-fold-lower frequency. Our data thus confirm that cytoplasmic dynein is the retrograde MT motor required for herpesvirus entry (4) and that cytoplasmic dynein motility during entry is opposed by a kinesin(s), likely kinesin-1. Bidirectional transport is commonly observed in cells, but its role remains poorly understood. One possibility is that it provides a back-stepping option to circumnavigate obstacles along the MT track (33). The difference in axonal retrograde velocity between SCG cultures grown in chambers and those grown in dissociated cultures was unexpected. However, it reflects a magnitude previously reported by two separate studies with dorsal root ganglion neurons (11, 30). Interestingly, after simultaneous inoculation in the soma and neurite compartments, retrograde velocities closely resembled those for dissociated cultures, which might indicate cellular responses to cell body infections, leading to accelerated cytoplasmic dynein velocities. Several cofactors of cytoplasmic dynein have been shown to directly affect motor output measured by velocity, force production, and processivity (e.g., dynactin, NudE/EL, Lis1, BicD2, RILP, FIP3, Spindly, and Hook3) (34, 35). The net effect of these regulating complexes would be to enable robust retrograde motility by modulating individual motors or teams of multiple motors working together. Our analysis reveals that the dynamics of PRV capsid entry are heterogeneous and depend on the infection regimen. This heterogeneity may be linked to the many ways in which cytoplasmic dynein can function to move viral cargos (7, 34, 35).
FIG 7.
Cartoon illustration of axonal PRV capsid transport. (A) During entry, green PRV180G capsids are transported by cytoplasmic dynein, which binds to the tegument layer (gray), and kinesin. The overall net transport is toward the microtubule minus end. (B) During egress, red PRV180G capsids are contained in a vesicle, which is transported only by kinesin motors (kinesin-3 and potentially others) toward the microtubule plus end.
Motility of progeny particles during egress.
The high anterograde velocities (vmax = 2.4 μm/s) measured for egressing particles provide biophysical support for data from previous proteomics studies (8), indicating that the fast kinesin-3 motor Kif1A (26, 27) is responsible for PRV egress. Nevertheless, the velocity profile shows a plateau rather than a single peak. Several interpretations are possible, three of which stand out as the simplest and are not mutually exclusive. The first possibility is that Kif1A is exclusively driving the anterograde motility of progeny capsids but is faced with a substantial passive viscous load and that this load is not uniform along the axon (36, 37). The second possibility involves the differential regulation of Kif1A in different areas along the axon. Recently, a Kif1A inhibitor that is able to modulate the velocity of axonal Kif1A-driven Rab3-positive vesicles was identified (26). The third possibility is that the cargo is not driven exclusively by a single fast kinesin but also has some contribution from one or more types of slower kinesins. The resulting velocity can be intermediate anywhere between the fast and slow limits, depending on the ratio and relative activity of fast and slow motor species on each cargo (27, 38). We tested for the first possibility and released load with mycalolide B, which disrupts the dynactin complex and inhibits actin polymerization (28, 29). We measured increased anterograde particle velocities during egress. This indicates that the passive load, by either actin filaments or cytoplasmic dynein/dynactin, opposes Kif1A motility. However, the plateau in the velocity profile persisted. Therefore, it remains unclear at this point if PRV engages additional kinesin motors during egress for redundant transport mechanisms.
The velocity distribution of long retrograde segments during egress shows a broad decay without distinct peaks, which is uncharacteristic of regular cytoplasmic dynein activity. Also, there was no indication of cytoplasmic dynein activity after analysis of short segments during egress (data not shown). It is therefore conceivable that cytoplasmic dynein is not actively engaged in the viral egress process (Fig. 7B). The engagement of cytoplasmic dynein only during retrograde, but not anterograde, transport is presumably due to differences in the cargo structures (Fig. 7). Whereas cytoplasmic dynein interacts with the tegument protein VP1/2 during entry (6), access to this protein is obstructed during egress, as the capsid and tegument are surrounded by membrane layers (39). This structural regulation of retrograde motility strongly indicates an efficient viral transport system for axonal sorting, transport, and spread (40).
Supplementary Material
ACKNOWLEDGMENTS
We are grateful to G. Laevsky at the confocal imaging facility for his help with the TIRF microscope, C. DeCoste and J. Grady at the flow cytometry resource facility for sorting PK15-mNG-VP26 cells (all at the Department of Molecular Biology, Princeton University), J. Bosse for providing the lentivirus expression system, O. Koyuncu and I. Hogue for careful edits of the manuscript, as well as all other former and current members of the Enquist laboratory for helpful discussions.
Funding Statement
The funders had no role in study design, data collection and interpretation, or the decision to submit the work for publication.
Footnotes
Supplemental material for this article may be found at http://dx.doi.org/10.1128/JVI.01122-16.
REFERENCES
- 1.Pomeranz LE, Reynolds AE, Hengartner CJ. 2005. Molecular biology of pseudorabies virus: impact on neurovirology and veterinary medicine. Microbiol Mol Biol Rev 69:462–500. doi: 10.1128/MMBR.69.3.462-500.2005. [DOI] [PMC free article] [PubMed] [Google Scholar]
- 2.Sodeik B. 2000. Mechanisms of viral transport in the cytoplasm. Trends Microbiol 8:465–472. doi: 10.1016/S0966-842X(00)01824-2. [DOI] [PubMed] [Google Scholar]
- 3.Smith G. 2012. Herpesvirus transport to the nervous system and back again. Annu Rev Microbiol 66:153–176. doi: 10.1146/annurev-micro-092611-150051. [DOI] [PMC free article] [PubMed] [Google Scholar]
- 4.Döhner K, Wolfstein A, Prank U, Echeverri C, Dujardin D, Vallee R, Sodeik B. 2002. Function of dynein and dynactin in herpes simplex virus capsid transport. Mol Biol Cell 13:2795–2809. doi: 10.1091/mbc.01-07-0348. [DOI] [PMC free article] [PubMed] [Google Scholar]
- 5.Radtke K, Kieneke D, Wolfstein A, Michael K, Steffen W, Scholz T, Karger A, Sodeik B. 2010. Plus- and minus-end directed microtubule motors bind simultaneously to herpes simplex virus capsids using different inner tegument structures. PLoS Pathog 6:e1000991. doi: 10.1371/journal.ppat.1000991. [DOI] [PMC free article] [PubMed] [Google Scholar]
- 6.Zaichick SV, Bohannon KP, Hughes A, Sollars PJ, Pickard GE, Smith GA. 2013. The herpesvirus VP1/2 protein is an effector of dynein-mediated capsid transport and neuroinvasion. Cell Host Microbe 13:193–203. doi: 10.1016/j.chom.2013.01.009. [DOI] [PMC free article] [PubMed] [Google Scholar]
- 7.Scherer J, Vallee RB. 2011. Adenovirus recruits dynein by an evolutionary novel mechanism involving direct binding to pH-primed hexon. Viruses 3:1417–1431. doi: 10.3390/v3081417. [DOI] [PMC free article] [PubMed] [Google Scholar]
- 8.Kramer T, Greco TM, Taylor MP, Ambrosini AE, Cristea IM, Enquist LW. 2012. Kinesin-3 mediates axonal sorting and directional transport of alphaherpesvirus particles in neurons. Cell Host Microbe 12:806–814. doi: 10.1016/j.chom.2012.10.013. [DOI] [PMC free article] [PubMed] [Google Scholar]
- 9.Smith GA, Gross SP, Enquist LW. 2001. Herpesviruses use bidirectional fast-axonal transport to spread in sensory neurons. Proc Natl Acad Sci U S A 98:3466–3470. doi: 10.1073/pnas.061029798. [DOI] [PMC free article] [PubMed] [Google Scholar]
- 10.Luxton GW, Haverlock S, Coller KE, Antinone SE, Pincetic A, Smith GA. 2005. Targeting of herpesvirus capsid transport in axons is coupled to association with specific sets of tegument proteins. Proc Natl Acad Sci U S A 102:5832–5837. doi: 10.1073/pnas.0500803102. [DOI] [PMC free article] [PubMed] [Google Scholar]
- 11.Smith GA, Pomeranz L, Gross SP, Enquist LW. 2004. Local modulation of plus-end transport targets herpesvirus entry and egress in sensory axons. Proc Natl Acad Sci U S A 101:16034–16039. doi: 10.1073/pnas.0404686101. [DOI] [PMC free article] [PubMed] [Google Scholar]
- 12.Koyuncu OO, Song R, Greco TM, Cristea IM, Enquist LW. 2015. The number of alphaherpesvirus particles infecting axons and the axonal protein repertoire determines the outcome of neuronal infection. mBio 6:e00276-15. doi: 10.1128/mBio.00276-15. [DOI] [PMC free article] [PubMed] [Google Scholar]
- 13.del Rio T, Ch'ng TH, Flood EA, Gross SP, Enquist LW. 2005. Heterogeneity of a fluorescent tegument component in single pseudorabies virus virions and enveloped axonal assemblies. J Virol 79:3903–3919. doi: 10.1128/JVI.79.7.3903-3919.2005. [DOI] [PMC free article] [PubMed] [Google Scholar]
- 14.Curanovic D, Ch'ng TH, Szpara M, Enquist L. 2009. Compartmented neuron cultures for directional infection by alpha herpesviruses. Curr Protoc Cell Biol Chapter 26:Unit 26.4. doi: 10.1002/0471143030.cb2604s43. [DOI] [PMC free article] [PubMed] [Google Scholar]
- 15.Lyman MG, Feierbach B, Curanovic D, Bisher M, Enquist LW. 2007. Pseudorabies virus Us9 directs axonal sorting of viral capsids. J Virol 81:11363–11371. doi: 10.1128/JVI.01281-07. [DOI] [PMC free article] [PubMed] [Google Scholar]
- 16.Bremner KH, Scherer J, Yi J, Vershinin M, Gross SP, Vallee RB. 2009. Adenovirus transport via direct interaction of cytoplasmic dynein with the viral capsid hexon subunit. Cell Host Microbe 6:523–535. doi: 10.1016/j.chom.2009.11.006. [DOI] [PMC free article] [PubMed] [Google Scholar]
- 17.Carter BC, Vershinin M, Gross SP. 2008. A comparison of step-detection methods: how well can you do? Biophys J 94:306–319. doi: 10.1529/biophysj.107.110601. [DOI] [PMC free article] [PubMed] [Google Scholar]
- 18.Cheezum MK, Walker WF, Guilford WH. 2001. Quantitative comparison of algorithms for tracking single fluorescent particles. Biophys J 81:2378–2388. doi: 10.1016/S0006-3495(01)75884-5. [DOI] [PMC free article] [PubMed] [Google Scholar]
- 19.Huet S, Karatekin E, Tran VS, Fanget I, Cribier S, Henry JP. 2006. Analysis of transient behavior in complex trajectories: application to secretory vesicle dynamics. Biophys J 91:3542–3559. doi: 10.1529/biophysj.105.080622. [DOI] [PMC free article] [PubMed] [Google Scholar]
- 20.Petrov DY, Mallik R, Shubeita GT, Vershinin M, Gross SP, Yu CC. 2007. Studying molecular motor-based cargo transport: what is real and what is noise? Biophys J 92:2953–2963. doi: 10.1529/biophysj.106.097253. [DOI] [PMC free article] [PubMed] [Google Scholar]
- 21.Krautwald M, Maresch C, Klupp BG, Fuchs W, Mettenleiter TC. 2008. Deletion or green fluorescent protein tagging of the pUL35 capsid component of pseudorabies virus impairs virus replication in cell culture and neuroinvasion in mice. J Gen Virol 89:1346–1351. doi: 10.1099/vir.0.83652-0. [DOI] [PubMed] [Google Scholar]
- 22.Hogue IB, Bosse JB, Engel EA, Scherer J, Hu JR, Del Rio T, Enquist LW. 2015. Fluorescent protein approaches in alpha herpesvirus research. Viruses 7:5933–5961. doi: 10.3390/v7112915. [DOI] [PMC free article] [PubMed] [Google Scholar]
- 23.Nagel CH, Dohner K, Binz A, Bauerfeind R, Sodeik B. 2012. Improper tagging of the non-essential small capsid protein VP26 impairs nuclear capsid egress of herpes simplex virus. PLoS One 7:e44177. doi: 10.1371/journal.pone.0044177. [DOI] [PMC free article] [PubMed] [Google Scholar]
- 24.Scherer J, Yi J, Vallee RB. 2014. PKA-dependent dynein switching from lysosomes to adenovirus: a novel form of host-virus competition. J Cell Biol 205:163–177. doi: 10.1083/jcb.201307116. [DOI] [PMC free article] [PubMed] [Google Scholar]
- 25.Rai AK, Rai A, Ramaiya AJ, Jha R, Mallik R. 2013. Molecular adaptations allow dynein to generate large collective forces inside cells. Cell 152:172–182. doi: 10.1016/j.cell.2012.11.044. [DOI] [PubMed] [Google Scholar]
- 26.Kevenaar JT, Bianchi S, van Spronsen M, Olieric N, Lipka J, Frias CP, Mikhaylova M, Harterink M, Keijzer N, Wulf PS, Hilbert M, Kapitein LC, de Graaff E, Ahkmanova A, Steinmetz MO, Hoogenraad CC. 2016. Kinesin-binding protein controls microtubule dynamics and cargo trafficking by regulating kinesin motor activity. Curr Biol 26:849–861. doi: 10.1016/j.cub.2016.01.048. [DOI] [PubMed] [Google Scholar]
- 27.Arpag G, Shastry S, Hancock WO, Tuzel E. 2014. Transport by populations of fast and slow kinesins uncovers novel family-dependent motor characteristics important for in vivo function. Biophys J 107:1896–1904. doi: 10.1016/j.bpj.2014.09.009. [DOI] [PMC free article] [PubMed] [Google Scholar]
- 28.Cavolo SL, Zhou C, Ketcham SA, Suzuki MM, Ukalovic K, Silverman MA, Schroer TA, Levitan ES. 2015. Mycalolide B dissociates dynactin and abolishes retrograde axonal transport of dense-core vesicles. Mol Biol Cell 26:2664–2672. doi: 10.1091/mbc.E14-11-1564. [DOI] [PMC free article] [PubMed] [Google Scholar]
- 29.Saito S, Watabe S, Ozaki H, Fusetani N, Karaki H. 1994. Mycalolide B, a novel actin depolymerizing agent. J Biol Chem 269:29710–29714. [PubMed] [Google Scholar]
- 30.Antinone SE, Smith GA. 2010. Retrograde axon transport of herpes simplex virus and pseudorabies virus: a live-cell comparative analysis. J Virol 84:1504–1512. doi: 10.1128/JVI.02029-09. [DOI] [PMC free article] [PubMed] [Google Scholar]
- 31.Smiley JR. 2004. Herpes simplex virus virion host shutoff protein: immune evasion mediated by a viral RNase? J Virol 78:1063–1068. doi: 10.1128/JVI.78.3.1063-1068.2004. [DOI] [PMC free article] [PubMed] [Google Scholar]
- 32.Liu AA, Zhang Z, Sun EZ, Zheng Z, Zhang ZL, Hu Q, Wang H, Pang DW. 2016. Simultaneous visualization of parental and progeny viruses by a capsid-specific HaloTag labeling strategy. ACS Nano 10:1147–1155. doi: 10.1021/acsnano.5b06438. [DOI] [PubMed] [Google Scholar]
- 33.Welte MA. 2004. Bidirectional transport along microtubules. Curr Biol 14:R525–R537. doi: 10.1016/j.cub.2004.06.045. [DOI] [PubMed] [Google Scholar]
- 34.Vallee RB, McKenney RJ, Ori-McKenney KM. 2012. Multiple modes of cytoplasmic dynein regulation. Nat Cell Biol 14:224–230. doi: 10.1038/ncb2420. [DOI] [PubMed] [Google Scholar]
- 35.Allan V. 2014. One, two, three, cytoplasmic dynein is go! Science 345:271–272. doi: 10.1126/science.1257245. [DOI] [PubMed] [Google Scholar]
- 36.Korn CB, Klumpp S, Lipowsky R, Schwarz US. 2009. Stochastic simulations of cargo transport by processive molecular motors. J Chem Phys 131:245107. doi: 10.1063/1.3279305. [DOI] [PubMed] [Google Scholar]
- 37.Gagliano J, Walb M, Blaker B, Macosko JC, Holzwarth G. 2010. Kinesin velocity increases with the number of motors pulling against viscoelastic drag. Eur Biophys J 39:801–813. doi: 10.1007/s00249-009-0560-8. [DOI] [PubMed] [Google Scholar]
- 38.Li X, Lipowsky R, Kierfeld J. 2013. Bifurcation of velocity distributions in cooperative transport of filaments by fast and slow motors. Biophys J 104:666–676. doi: 10.1016/j.bpj.2012.11.3834. [DOI] [PMC free article] [PubMed] [Google Scholar]
- 39.Kratchmarov R, Taylor MP, Enquist LW. 2012. Making the case: married versus separate models of alphaherpes virus anterograde transport in axons. Rev Med Virol 22:378–391. doi: 10.1002/rmv.1724. [DOI] [PMC free article] [PubMed] [Google Scholar]
- 40.Taylor MP, Enquist LW. 2015. Axonal spread of neuroinvasive viral infections. Trends Microbiol 23:283–288. doi: 10.1016/j.tim.2015.01.002. [DOI] [PMC free article] [PubMed] [Google Scholar]
Associated Data
This section collects any data citations, data availability statements, or supplementary materials included in this article.


