Abstract
The changes that occur in cell dynamics following oncogenic mutation that lead to the development of tumours are currently unknown. Here, using skin epidermis as a model, we assessed the impact of oncogenic hedgehog signalling in distinct cell populations and their capacity to induce basal cell carcinoma, the most frequent cancer in humans. We found that only stem cells, and not progenitors, were competent to initiate tumour formation upon oncogenic hedgehog signalling. Interestingly, this difference was due to the hierarchical organization of tumour growth in oncogene-targeted stem cells, characterized by an increase of symmetric self-renewing divisions and a higher p53-dependent resistance to apoptosis, leading to rapid clonal expansion and progression into invasive tumours. Our work reveals that the capacity of oncogene-targeted cells to induce tumour formation is not only dependent on their long-term survival and expansion, but also on the specific clonal dynamics of the cancer cell of origin.
Introduction
Cancer arises through the acquisition of oncogenic mutations1. How such oncogenic mutations impact on the rate of stem and progenitor cell proliferation and the proportion of divisions that result in symmetric and asymmetric fate is currently poorly understood. Recent studies following oncogenic activation in mouse gut prior to tumour formation showed that intestinal stem cells (SCs) acquire a proliferative advantage over their wildtype neighbours, leading to precocious clonal fixation of mutant crypts2,3. However, the question of whether and how mutant crypts expand and progress into invasive tumours remains unknown.
Basal cell carcinoma (BCC) is the most frequent tumour in humans with more than 5 million new cases diagnosed each year worldwide. BCCs arise from the constitutive activation of the hedgehog (HH) pathway through either Patched (Ptch) loss of function or Smoothened (Smo) gain of function4. Different mouse models of BCC using Ptch1 deletion or oncogenic SmoM2 mutant expression induce the formation of tumours that resemble superficial human BCC5. The skin epidermis contains distinct types of SCs that contribute to the homeostasis of discrete regions of epidermis6. Interfollicular epidermis (IFE) is maintained by SCs targeted by K14-CreER and committed progenitors (CPs) targeted by Inv-CreER in tail, ear, back and ventral skin epidermis7,8. Activation of oncogenic HH signalling through SmoM2 expression or Patched1 deletion in these different tissues using K14-CreER, which targets both SCs and CPs, induce BCC formation7,9–12. However, the question of whether and how SmoM2 expression in SCs and/or CPs drives BCC formation remains unresolved.
Results
SCs but not CPs initiate BCC formation
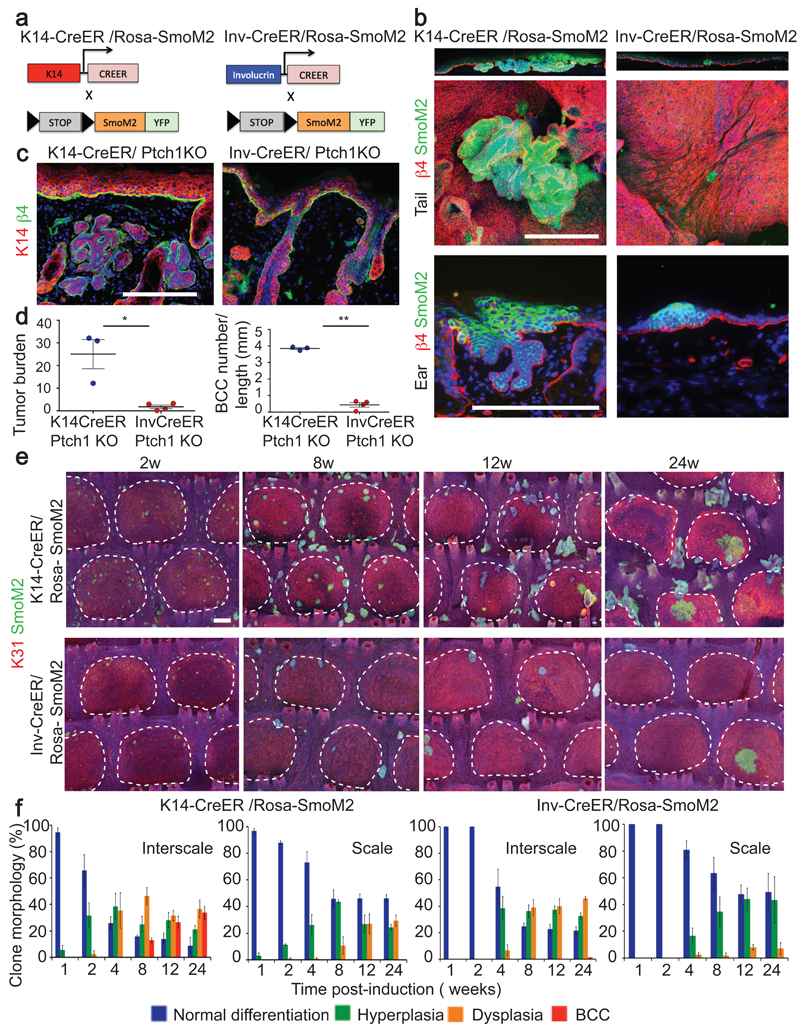
To determine whether SCs and CPs are both competent to induce BCC, we induced oncogenic SmoM2 expression exclusively in CPs using Inv-CreER, and in both CPs and SCs using K14-CreER7 at the same clonal density (Fig.1a and Extended Data Fig.1a). As previously reported, activation of SmoM2 expression using K14-CreER induced BCC, characterized by invasion into the dermis and branched morphology, in both tail and ear epidermis (Fig. 1b)9–11. In sharp contrast, activation of SmoM2 expression in CPs using Inv-CreER lead to preneoplastic lesions (including hyperplasia and dysplasia) that did not progress into BCCs (Fig. 1b). These results suggest that only IFE-SCs are competent to induce BCC following SmoM2-activation while IFE-CPs are highly resistant.
Figure 1. SCs but not CPs are competent to initiate BCC formation upon HH activation.
(a) Genetic strategy to activate SmoM2 expression in SCs and CPs. (b) Immunostaining of β4-integrin/SmoM2 in ear and tail skin 24w after SmoM2 activation. (c) Immunostaining of β4-integrin/K14 in ventral skin 24w after Ptch1 deletion. (d) Quantification of tumour burden (total tumour area divided by length of epidermis) following Ptch1 deletion. Quantification of BCC number per length (mm) following Ptch1 deletion. (n=4 Inv-CreER/Ptch1KO animals and n=3 K14CreER/Ptch1KO animals (e) Immunostaining of K31/ SmoM2 in whole mount tail skin. (f) Quantification of the morphology of SmoM2-expressing clones. Description of number of counted clones is found in the method section. Hoechst nuclear staining in blue; scale bars, 100μm. *P≤0,05, **P≤0,01, ***P≤0,001. Histograms and error bars represent the mean and the standard error of the mean (s.e.m).
We then assessed whether the competence of SCs and CPs to initiate BCC was dependent on the oncogene or tumor suppressor gene used to activate HH signalling. To this end, we induced Ptch1 deletion using K14- or Inv-CreER (Fig. 1c). Ptch1 deletion using K14-CreER lead to BCCs arising from the IFE and the infundibulum (Fig. 1c). In contrast, Ptch1 deletion using Inv-CreER, which targets some basal cells in the back and ventral skin epidermis8, did not lead to the rapid development of BCC, and only rare and small BCCs were observed 24w post-induction (Fig. 1c-d). These results reveal that only IFE/infundibulum SCs are competent to induce BCC formation whereas CPs are highly resistant, irrespective of the oncogene or tumour suppressor gene used to activate HH signalling and body location (tail, ear, back and ventral skin).
Two distinct self-maintained compartments, scale and interscale, have been described in tail epidermis13. To assess whether cells located in these two compartments respond equally to oncogenic activation, we performed immunofluorescence using a scale-specific marker (K31) and SmoM2-YFP on whole mount tail epidermis. Interestingly, we found that BCCs arose from K14-CreER SmoM2 targeted cells located only in the interscale (Fig. 1e). K14 clones in the interscale progressively lost their normal differentiation program, as evidenced by the loss of spinous-like cells, became hyperplastic, then dysplastic (Fig. 1f and Extended Data Fig. 1b-c). From 4 to 8 weeks (w) post-induction, around 15% of clones had progressed into BCC in interscale, increasing to 40% after 24w (Fig. 1e-f). In contrast, K14 clones in scale never progressed to BCC, and maintained a normal differentiation program for an extended period, despite clonal expansion mediated by SmoM2 expression (Fig. 1e-f and Extended Data Fig. 1b-c).
Together, these data indicate that the fate of oncogene targeted cells and the ability of these cells to progress into BCC depends both on their location (scale versus interscale) and cellular origin (SC versus CP). This prompted us to ask whether there are regional differences in SC potential in tail epidermis even under homeostatic conditions.
Homeostasis of the interscale epidermis
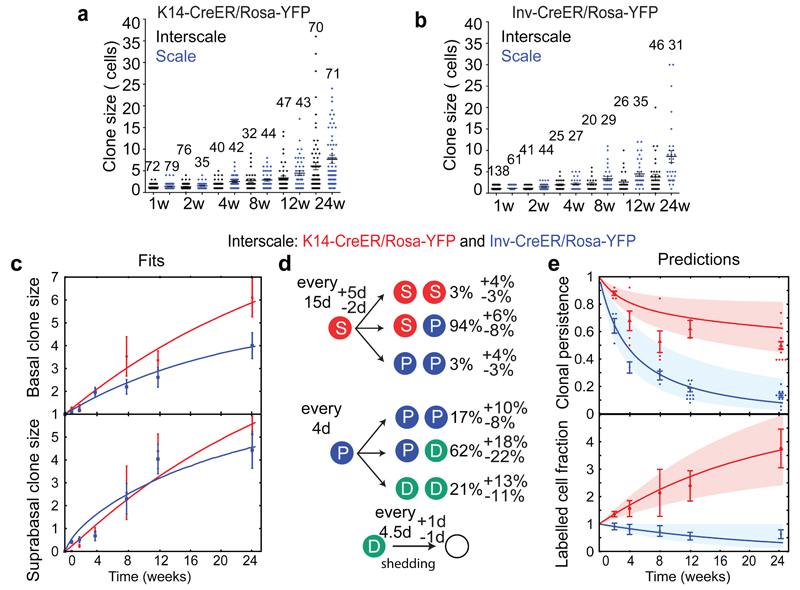
To gain quantitative insight into regional variation in SC potential, we performed lineage tracing at homeostasis to determine whether scale and interscale are differentially maintained. To this end, we compared the evolution of K14-CreER/Rosa-YFP and Inv-CreER/Rosa-YFP targeted cells at single cell resolution over a 24w time-course. Interestingly, although both broad, the distribution of clone sizes in the two regions became increasing divergent (Fig. 2a-b and Extended Data Fig. 2), confirming the importance of regionalization in cellular dynamics (Supplementary Theory).
Figure 2. Homeostatic renewal of mouse tail epidermis.
(a, b) Distribution of basal clone sizes, in K14-CreER/Rosa-YFP (a) and Inv-CreER/Rosa-YFP (b) epidermis. The number of clones analysed is indicated for each time point and in the method section. (c) Mean basal (top) and suprabasal (bottom) clone size in the interscale. The lines represent the model fit. (d) Cell fate probabilities of SCs and CPs in the interscale, as extracted from the fits. (e) Clonal persistence (top) and labelled cell fraction (bottom) in the interscale. Description of number of counted clones is found in the method section. The lines are the predictions from the model using only the parameters extracted in d. K14-CreER/Rosa-YFP clones display a net expansion, whereas Inv-CreER/Rosa-YFP clones display a net contraction. Histograms and error bars represent the mean and the s.e.m. Shaded areas represent 95% confidence intervals for the model prediction (Supplementary Theory).
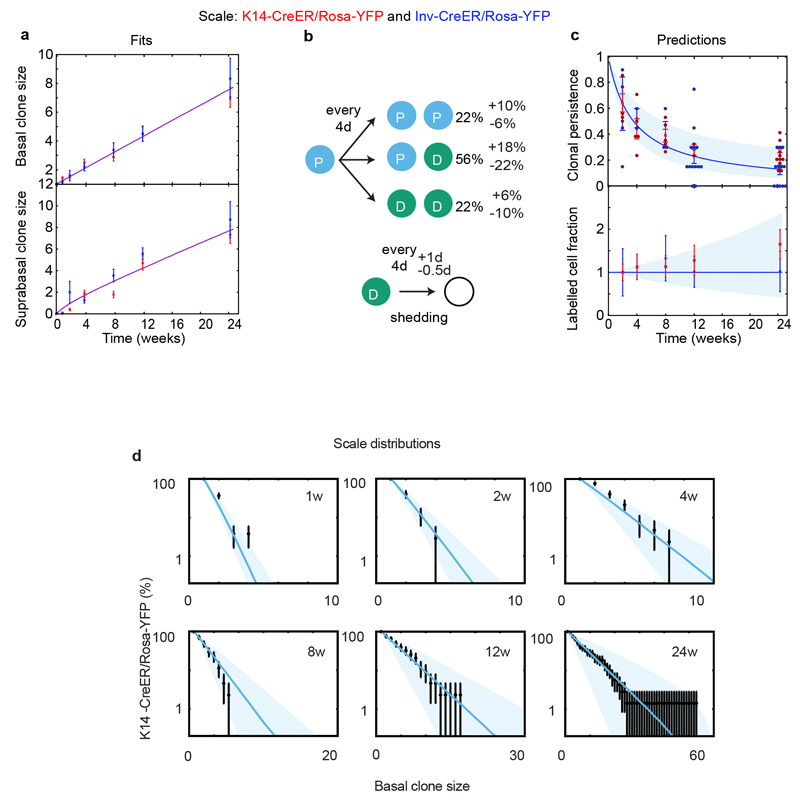
Consistent with our previous study7, the evolution of mean clone size of progenitors targeted by Inv-CreER in the interscale fits well with the targeting of an equipotent CP population presenting a small but statistically significant imbalance in fate towards terminal differentiation (Fig. 2c-d). Similarly, the evolution of mean clone size for K14-CreER cells is consistent with the targeting of a long-term self-renewing SC population that divides more slowly than CPs (Fig. 2c-d). To define quantitatively the dynamics of these two populations (cell cycle times, relative proportion of SCs and CPs labelled by the K14-CreER and their fate probabilities), we made a joint fit to the basal and suprabasal mean clone sizes, and extracted optimal parameters and confidence intervals (Supplementary Theory).
To independently verify the predictions of the model, the persistence of Inv- and K14-CreER targeted clones was used to infer the respective labelled cell fraction. As expected from the labelling of a CP population, for Inv-CreER targeted clones, we found that the labelled cell fraction decreased over time (Fig. 2e). In contrast, for K14-CreER targeted clones, the labelled cell fraction increased over time, consistent with the preferential targeting of the SC population (Fig. 2e). Strikingly, we obtained excellent predictions for the labelled cell fraction for both K14- and Inv-CreER using parameters extracted independently from a fit to the mean clone sizes (Fig. 2e). These results provide compelling evidence in favour of a SC and CP hierarchy, and rule out the possibility that the differences between K14- and Inv-CreER targeted clones are the consequence of differential short-term “priming” of induced cells (Extended Data Fig. 3a). Importantly, the hierarchical model also predicted accurately the complete distribution of clone sizes at all time points (Extended Data Fig. 3b-c) for both K14- and Inv-CreER.
In sharp contrast, in the scale region of tail epidermis, both basal and suprabasal clone size and persistence of K14- and Inv-CreER targeted cells were statistically indistinguishable (Extended Data Fig. 4a and c). Crucially, the labelled cell fraction did not change significantly between 2w and 24w post-labelling (Extended Data Fig.4c), an indication that K14- and Inv-CreER mark the same balanced CP population13. We again validated the model (Extended Data Fig.4b) by showing that it could predict quantitatively both the evolution of clonal persistence, as well the clone size distribution at all time points (Extended Data Fig. 4b-d).
These results show that, during homeostasis, interscale is maintained by two discrete populations; a comparatively slow-cycling SC and a more rapidly dividing CP population, whereas scale is maintained by a single CP population. As well as unifying diverging reports of maintenance hierarchy in tail epidermis7,13,14, these findings raised the question of whether the restriction of BCCs to the interscale correlated with the regional localization of IFE SCs. To test this hypothesis, we assessed whether the same regionalized lineage hierarchy persisted upon SmoM2 activation.
Oncogene-targeted CPs are frozen into dysplasia
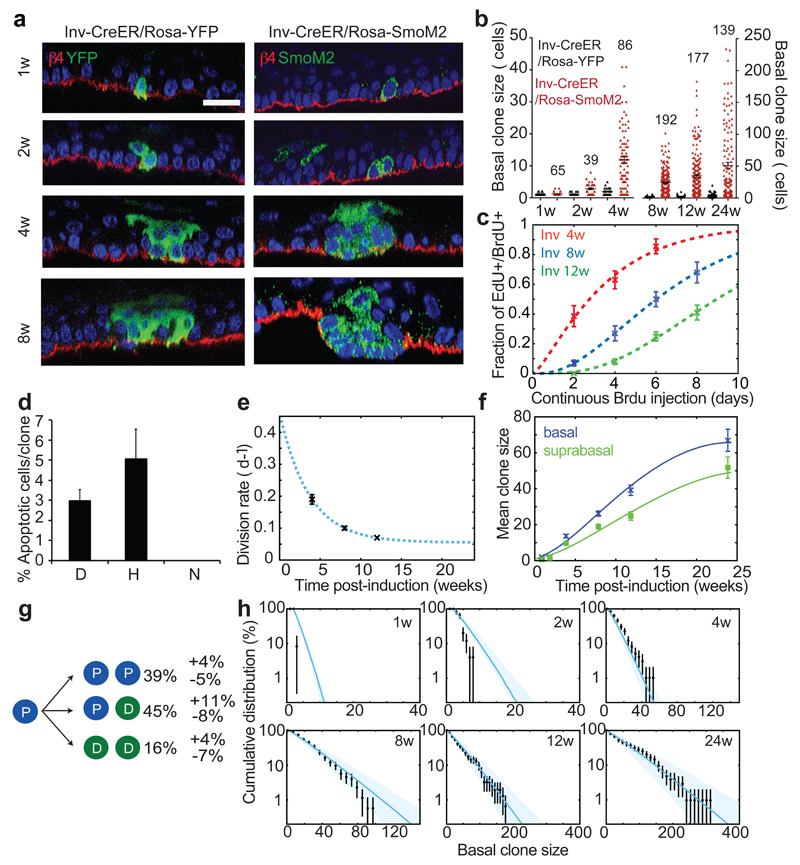
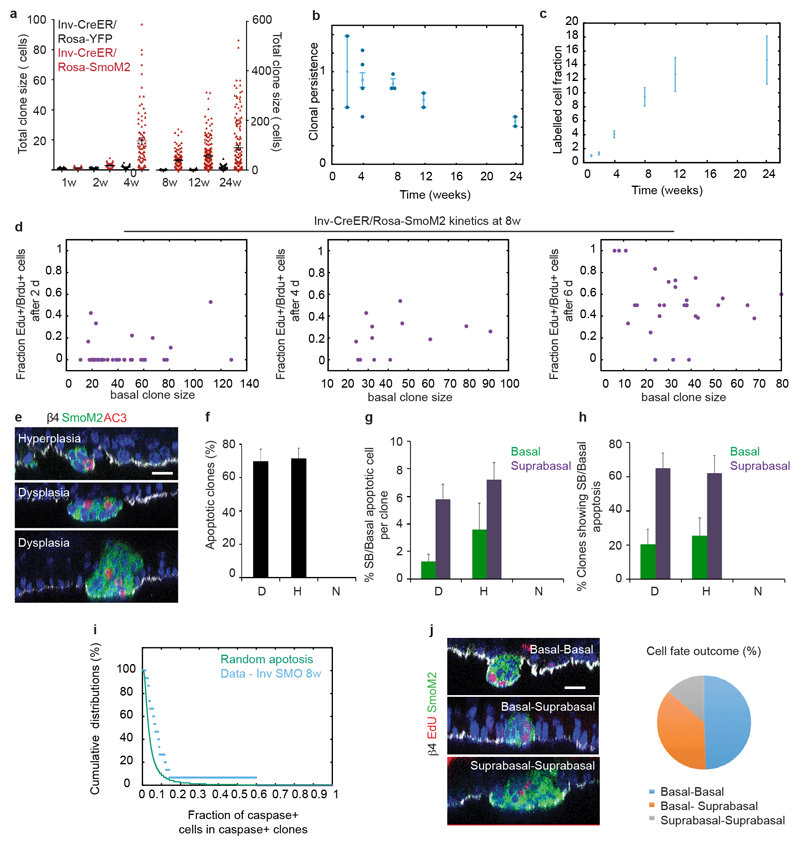
To resolve the cellular dynamics underpinning to the differential sensitivity of SCs and CPs to BCC initiation in interscale, we first studied the dynamics and proliferation kinetics of Inv-CreER/Rosa-SmoM2 clones. Oncogenic activation in Inv-CreER CPs lead to an increase of the average basal clone size, total clone size and clonal persistence compared to homeostatic conditions (Fig. 3a-b and Extended Data Fig.5a-c), as well as abnormal or decreased differentiation (Fig. 3a and Extended Data Fig. 1 b-c). We assessed the average cell cycle time of SmoM2 Inv-CreER-targeted cells by first marking proliferating cells using 24h of EdU administration, followed by variable periods of continuous BrdU administration. From the co-labelling of EdU/BrdU, we found that CPs divided on average every 3.6±0.5 days at 4w following SmoM2 expression, 7.2±0.6 days at 8w and 9.8±0.3 days at 12w (Fig. 3c), indicating that the average division rate of SmoM2 CPs decreases with time. Surprisingly, division rates were uncorrelated with clone size at all time points, indicating that the decrease occurs independently of clone size or stage of tumour progression (Extended Data Fig. 5d), and consistent with the Inv-CreER oncogene targeted cells functioning as a single equipotent population.
Figure 3. SmoM2 expression in CPs induces clonal expansion that does not progress into BCC.
(a) Immunostaining for β4-integrin, YFP and SmoM2 in Inv-CreER/Rosa-YFP and Inv-CreER/Rosa-SmoM2 epidermis at different time points.(b) Distribution of Inv-CreER/Rosa-YFP and Inv-CreER/Rosa-SmoM2 basal clone sizes. The number of clones analysed in Inv-CreER/Rosa-SmoM2 is indicated for each time point and for Inv-CreER/Rosa-YFP indicated in Fig. 2b. (c) Quantification of EdU/BrdU double-labelled cells during continuous BrdU administration, at different time points post clonal induction. The lines represent the model fit (Supplementary Theory). (d) Quantification of the proportion of apoptotic cells in dysplastic, hyperplastic and normally differentiating Inv-CreER/Rosa-SmoM2 clones 8w post-induction (n= 73 clones analysed from 4 independent experiments). (e) Division rate determined from EdU/BrdU double-labelling experiments (data in black, fit in blue dashed line). (f) Mean basal and suprabasal clone size in the interscale. The lines represent the model fit from which we inferred the cell fate probabilities displayed in g. (g) Cell fate probabilities of the tumour progenitor expressing SmoM2. (h) Basal clone size distribution of Inv-CreER/Rosa-SmoM2 clones (black). Consistent with the hypothesis of a single equipotent progenitor pool, all distributions are well-fit by single exponential. Blue lines represent the model prediction using only the parameters extracted from g. Shaded areas represent 95% confidence intervals for the model prediction. D: dysplasia; H: hyperplasia; N: normal differentiation. Hoechst nuclear staining in blue; scale bars, 10μm. Histograms and error bars represent the mean and the s.e.m. (b–f) and the s.d. (h).
Since deregulation of apoptosis is also important for cancer formation1, we assessed whether apoptosis influences the clonal dynamics of oncogene targeted CPs. In common with their normal counterpart, Inv-CreER targeted cells did not show evidence of apoptosis over the first 6w following SmoM2 expression (data not shown). However, from 8w on, about 60% of Inv-CreER targeted clones that presented hyperplasia or dysplasia contained about 2-4% of apoptotic cells as measured by active caspase-3 immunostaining (Fig. 3d, Extended Data Fig. 5e-i).
Taking these rates (Fig. 3e) as an input, we could obtain an excellent fit to the average clone size (Fig. 3f) with cell fate probabilities that remain constant over time (symmetric renewal (PP): asymmetric division (PD): symmetric differentiation (DD)=39%:45%:16%) (Fig. 3g). This result demonstrates that oncogenic expression in CPs leads to enhanced clonal expansion and survival by promoting symmetric proliferation over terminal differentiation. Such an imbalance would lead to exponential clone growth if it were not counteracted by an ever-diminishing effective proliferation rate, leading to a plateau in the mean basal clone size (Fig. 3f). Notably, the model prediction provided a good fit to the clone size distribution at all time points (Fig. 3h).
Finally, to further verify the model, a low short-term dose of EdU was used to mark a minority of dividing cells and their fate outcome was recorded 3 days later by quantifying the basal and suprabasal localization of EdU doublets (Extended Data Fig. 5j). From these results, we could confirm a large imbalance between symmetric division and terminal differentiation (35%).
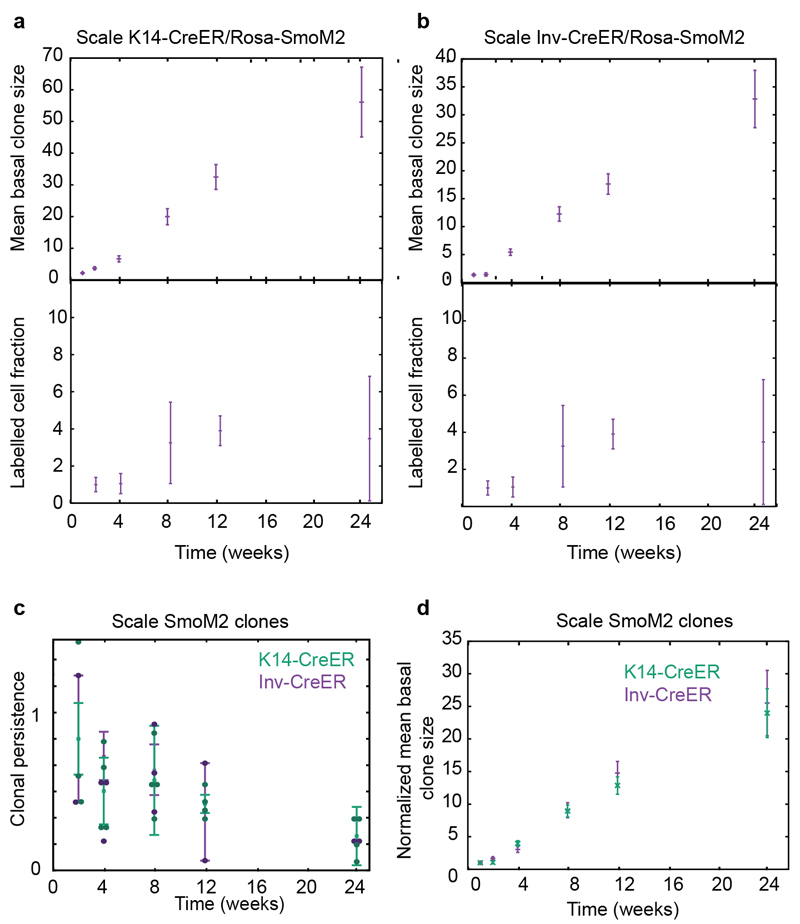
Since the scale is maintained by a single progenitor pool, we wished to probe whether its response to oncogenic activation was similar to interscale CPs. Crucially, after an initial increase, the overall labelled cell fraction remained roughly constant over time in scale between 8 and 24w, at a similar level for both K14- and Inv-CreER (Extended Data Fig. 6a-c), suggesting that, in sharp contrast with interscale, both populations behave identically upon oncogenic activation (Extended Data Fig. 6d). Together, these results show that both interscale and scale CPs are resistant to BCC formation upon oncogenic HH signalling, although interscale clones can persist longer due to a larger fate imbalance and enhanced differentiation defects, while scale clones rapidly converge towards balance. However, as human epidermis does not show scale organization, the absence of BCC formation in the scale region might not have human relevance.
Oncogene-targeted SCs progress into BCC
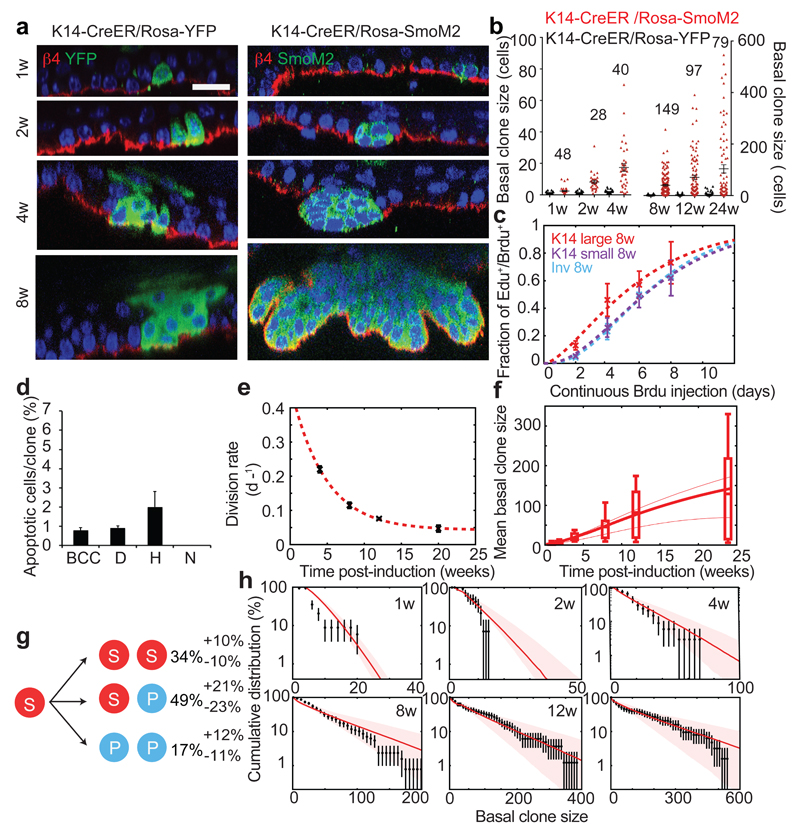
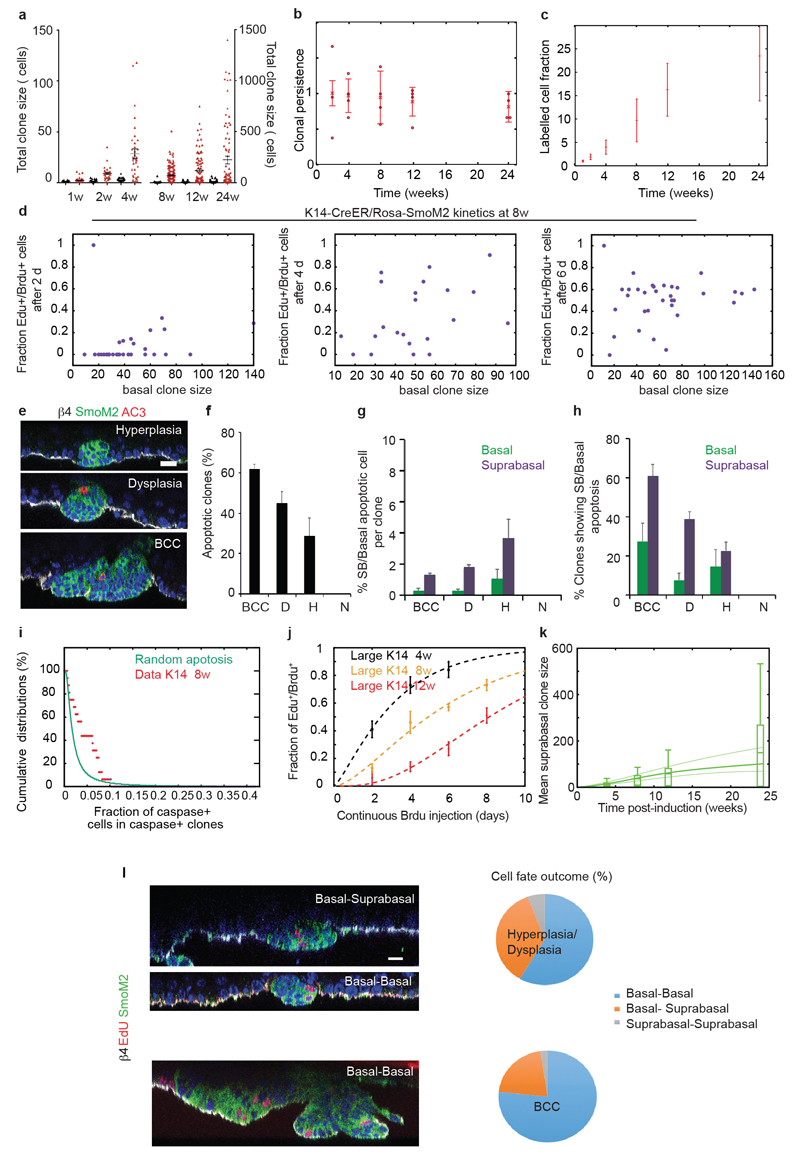
To gain insight into how SmoM2 expression in SCs promotes BCC formation, we then performed a quantitative analysis of K14-CreER/Rosa-SmoM2 clones. Compared to Inv-targeted clones, SmoM2 expression in K14-targeted cells lead to a more rapid and persistent expansion of a fraction of clones (Fig. 4a-b and Extended Data Fig.7a-c) that progressed into BCC, as well as the formation of smaller clones that did not show tumour progression (Fig. 1e and 4b). This suggests that, in line with homeostatic conditions, K14-CreER marks a fraction of tumour-like SCs, together with tumour-like CPs, a heterogeneity that we verified using proliferation assays (Fig. 4c). Indeed, we found that one population of K14-CreER targeted cells consisted of small clones that displayed similar proliferation kinetics as Inv-CreER SmoM2 clones, while a second population consisted of larger clones, which re-entered cell cycle significantly faster (Fig. 4c, Extended Data Fig. 5d and 7d). The population of small K14-CreER targeted clones (dysplasia and hyperplasia) also presented higher levels of apoptosis compared to the larger clones (Fig. 4d and Extended Data Fig. 7e-i). As a result, even though the proliferation of the larger clones also decreased with time (Fig. 4e and Extended Data Fig.7j), their division rate was consistently higher than the Inv-CreER targeted population (Fig. 4e).
Figure 4. SmoM2 expression in SCs induces tumour SCs that lead to BCC formation.
(a) Immunostaining for β4-integrin, YFP and SmoM2 in K14-CreER/Rosa-YFP and K14-CreER/Rosa-SmoM2 epidermis at different time points. (b) Distribution of K14-CreER/Rosa-YFP and K14-CreER/Rosa-SmoM2 basal clone sizes. The number of clones analysed for K14-CreER/Rosa-SmoM2 is indicated and for K14-CreER/Rosa-YFP indicated in Fig. 2a. (c) Quantification of EdU/BrdU double-labelled cells following continuous BrdU administration, at 8w post clonal induction for small K14-CreER clones, Inv-CreER clones, and large K14-CreER clones. (d) Quantification of the number of apoptotic cells in BCC, dysplastic, hyperplastic and normally differentiating K14-CreER/Rosa-SmoM2 clones 8w post-induction (n= 117 clones analysed from 4 independent experiments). (e) Division rate in large K14 clones determined from double-labelling experiments (data in black, fit in red dashed line). (f) Whisker plot of the mean basal clone size in the interscale. The boxes delineate the first and third quartiles of the data, while the whiskers delineate the first and last decile of the data. The thick continuous line is the best fit from the model from which we extract the probability of fate choices in tumour SCs and progenitors displayed in g. The thin dashed lines represent the predicted mean clone sizes of SCs- (top thin curve) and progenitors- (bottom thin curve) derived clones alone. (g) Cell fate probabilities of the tumour SC upon SmoM2 activation. (h) Basal clone size distribution of K14CreER/SmoM2 clones (black). Red lines are the model prediction using only the parameters extracted from g. Shaded areas represent 95% confidence intervals for the model prediction. BCC: basal cell carcinoma; D: dysplasia; H: hyperplasia; N: normal differentiation. Hoechst nuclear staining in blue; scale bars, 10μm. Histograms and error bars represent the mean and the s.e.m. (b–f) and the s.d. (h).
To model BCC initiation, we adapted the hierarchical model obtained during homeostasis and fitted jointly the mean basal and suprabasal clone sizes of all K14-CreER-SmoM2 clones, taking as input the division rate as well as the fraction of SCs initially labelled by the K14-CreER determined from measurements at homeostasis, and used the fate choices of SCs as fitting parameters (Fig. 4f and Extended Data Fig. 7k). In particular, we posited that SCs are imbalanced towards symmetric renewal, whereas CPs derived from these cells remain slightly imbalanced toward symmetric differentiation with the same fate probability as in homeostasis, which gave a good fit to the average basal clone size (Fig. 4g). Notably, the measured clone size distributions from 12w onwards could not be fit with a one-progenitor population model, in stark contrast to the distributions of Inv-CreER-SmoM2 clones. Instead, the K14-CreER-SmoM2 clone size distributions displayed a “double-exponential” decay, consistent with the labelling of two distinct populations, as predicted quantitatively by the model (Fig. 4h and Supplementary Theory). This shows that K14-CreER targets tumour-like SCs making imbalanced stochastic fate choices, in addition to targeting the same tumour-like CP population as Inv-CreER.
As a finally consistency check, we addressed a key hallmark of the hierarchical model, that SCs give rise to basal CPs in K14-CreER targeted clones. This predicts that the fraction of cell divisions resulting in two basal cells should be greater in SC versus CP-targeted clones. Indeed, short-term EdU pulse-chase experiments revealed that, in BCC, most divisions (77%) lead to two basal cells (Extended Data Fig. 7l). In dysplasia, the fraction of two EdU+ basal cell doublets was intermediate between the BCC and Inv-CreER/Rosa-SmoM2 values (Extended Data Fig. 5j and 7l), consistent with a mixture of SC and CP-targeted clones.
P53 restricts CPs to progress into BCC
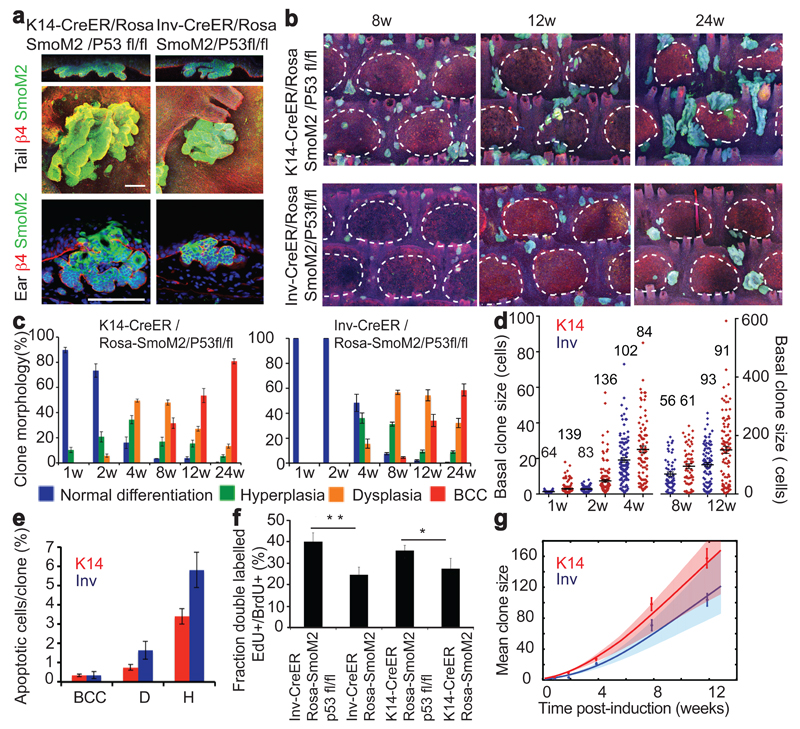
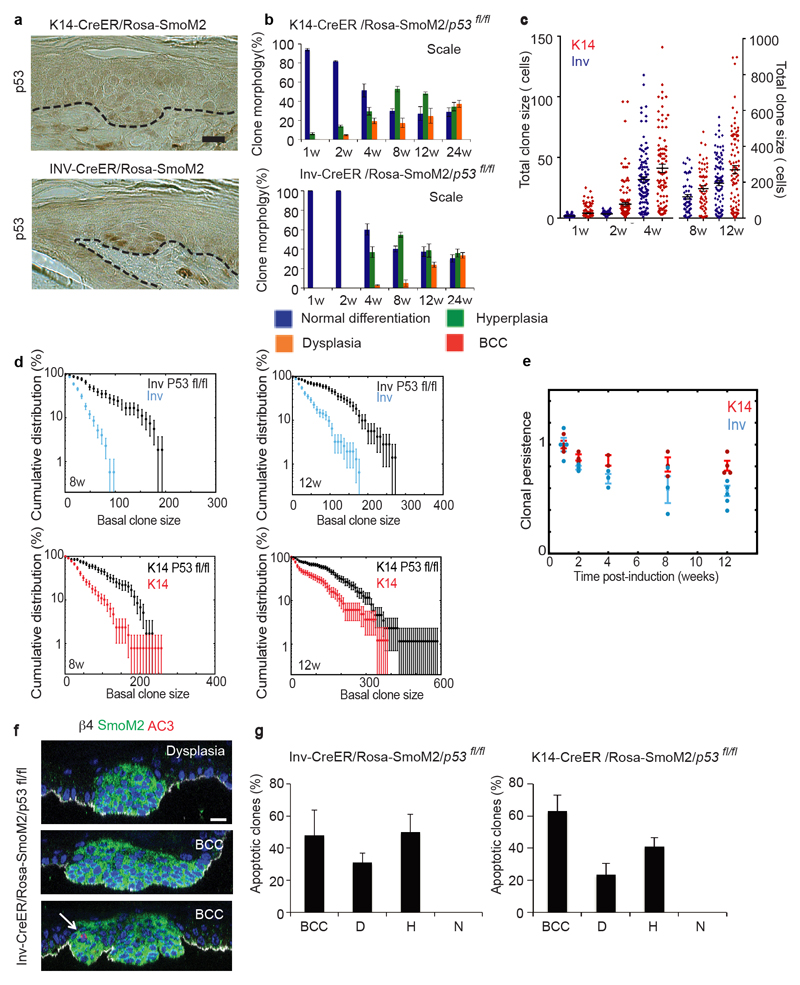
Given the observed differences in apoptosis and division rates between oncogene targeted SC and CP, we assessed whether p53, a tumour suppressor gene frequently mutated in human BCC15 that controls cell cycle arrest and apoptosis16, was differentially activated in SCs and CPs upon SmoM2 activation. Immunohistochemistry revealed that p53 was more frequently found in SmoM2 clones arising from Inv-CreER as compared to K14-CreER mice (Extended data Fig.8a). To determine whether p53 stabilization in oncogene targeted CPs restricts the potential of these progenitors to generate BCC, we deleted p53 together with SmoM2 activation and assessed tumour formation. Interestingly, p53 deletion in Inv-CreER targeted CPs leads to BCC in both ear and tail epidermis (Fig. 5a). In the tail, BCCs were restricted to the interscale whereas, in the scale, clones only progressed into dysplasia (Fig. 5b-c and Extended Data Fig.8b). These results indicate that p53 restricts the competence of SmoM2 targeted CPs of the interscale to progress into BCC.
Figure 5. p53 deletion in CPs leads to BCC formation.
(a) Immunostaining of β4-integrin/SmoM2 in ear and tail skin of K14 and Inv-CreER/Rosa-SmoM2/p53fl/fl mice 24w after Tamoxifen administration (b) Whole mount immunostaining of K31/SmoM2 in tail epidermis overtime. (c) Quantification of normal, hyperplastic, dysplastic and BCC clones in the interscale region. Description of number of counted clones is found in the method section. (d) Distribution of basal clone sizes in K14 and Inv-CreER/Rosa-SmoM2/p53fl/fl mice. The number of clones analysed is indicated. Clone merger events were observed after 12w following oncogenic activation in K14Cre-ER/Rosa-SmoM2/p53fl/fl preventing the accurate quantification of clonal persistence and clone size at longer times. (e) Quantification of the proportion of apoptotic cells in different clones (K14 n= 82 clones and Inv n=90 clones from 3 independent experiments). (f) Percentage of double-labelled EdU/BrdU SmoM2-expressing cells after 6 days of continuous BrdU administration following a 24h pulse of EdU at 12w post-induction. *P≤0,05, **P≤0,01. (i) Mean basal clone size in Inv-CreER/Rosa-SmoM2/p53fl/fl and K14-CreER/Rosa-SmoM2/p53fl/fl clones. The prediction of the model is indicated by the blue and red lines. Histograms and error bars represent the mean and s.e.m. Shaded areas represent 95% confidence intervals for the model prediction in i. Scale bars, 100μm.
Although the proportion of clones that progress into BCC continued to be more frequent and more rapid in K14-CreER targeted SCs, at 24w post-induction more than half of interscale Inv-CreER targeted clones had progressed into BCC after p53 deletion (Fig. 5c). The clonal persistence and clone size were increased upon p53 deletion in both Inv-CreER/Rosa-SmoM2 and K14-CreER/Rosa-SmoM2 interscale clones, although the clones were still bigger and more persistent in K14 targeted cells (Fig. 5b and d and Extended Data Fig. 8c-e). These results indicate that, upon p53 deletion, both oncogene targeted CPs and SCs present an increase in self-renewing divisions allowing CPs to acquire the competence to form BCC upon SmoM2 expression.
We next determined whether the observed increase in clone size in the absence of p53 in CPs and SCs was due to a decrease in apoptosis, an increase in proliferation or both. Immunostaining for active caspase-3 8w after oncogenic activation showed that large Inv-CreER/Rosa-SmoM2/p53fl/fl dysplastic and BCC clones displayed reduced apoptosis, mirroring our observation in K14-CreER/Rosa-SmoM2 (Extended Data Fig. 8f). However, apoptosis was unchanged in Inv-CreER p53 deficient hyperplastic clones, suggesting that p53 dependent and independent mechanisms control apoptosis in oncogene-targeted cells (Fig. 5e and Extended Data Fig. 8g). EdU/BrdU double-pulse experiments at 12w post-induction showed that deletion of p53 increased the rate of proliferation in both Inv-CreER and K14-CreER oncogene targeted cells (Fig. 5f). According to our model, this increase in the rate of division was sufficient, keeping all other parameters constant, to explain the enhanced tumour growth (Fig. 5g). This provides additional evidence that growth arrest in oncogene targeted CPs is a key determinant in their inability to mediate BCC progression in the presence of p53.
In summary, our results demonstrate that p53 restricts the competence of CPs to initiate BCC by promoting apoptosis and inducing cell cycle arrest in oncogene targeted CPs.
Discussion
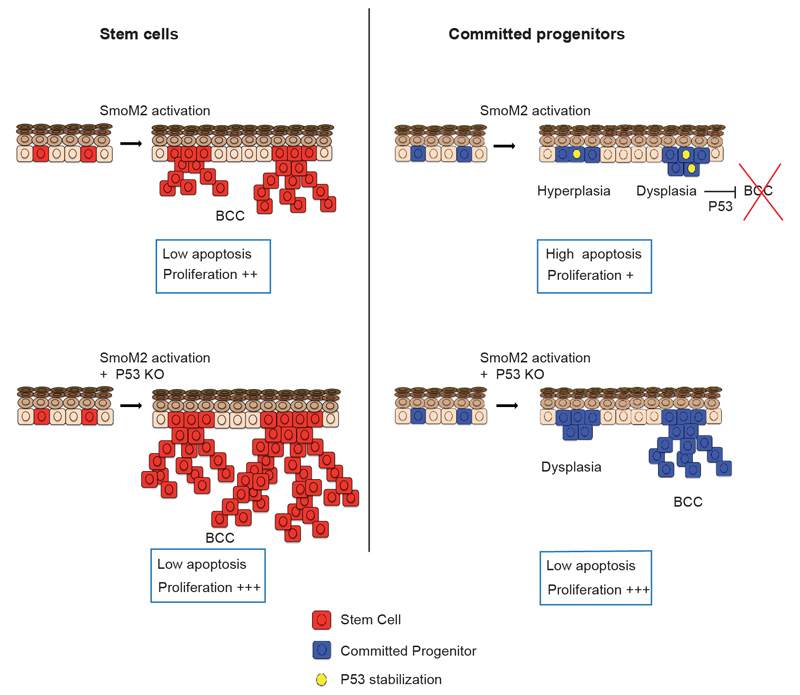
In this study, we have defined the quantitative dynamics of BCC initiation at single cell resolution, from the first oncogenic hit to the development of invasive tumours. These results show that the proliferative hierarchical organization of skin epidermis is a key determinant of tumour development, with only IFE SCs and not CPs competent to initiate BCC following oncogenic HH signalling (Extended data Fig. 9). Even though CP-derived clones survive and proliferate for months, they are surprisingly robust to BCC transformation and invasion, becoming “frozen” in a pre-tumorigenic state. The developmental cerebellar progenitors initiate medulloblastoma upon oncogenic HH signaling17,18, suggesting the developmental stage of progenitors may also dictate competence for tumour initiation. The apparent long-term maintenance of some oncogene targeted CPs stands in contrast to classical transient-amplifying cells in other compartments, such as hair matrix in the skin or the non-Lgr5 crypt progenitors in gut, which are resistant to tumour initiation because of their short lifespan19–22.
Our results show that IFE SCs reside solely in the interscale region, and have the unique and regionalized competence to initiate large and invasive BCCs. Strikingly, this regionalized hierarchical organization at homeostasis was maintained upon SmoM2 activation. Oncogene expression in SCs lead to a more rapid clonal expansion as compared to CPs for two main reasons: the maintenance of hierarchical organization in early pre-neoplastic lesions, leading to increased symmetric self-renewing divisions; and the combined resistance to apoptosis and enhanced proliferation of SC-derived pre-neoplastic lesions, leading to a larger effective growth rate. These two properties allow SC-targeted tumours to escape the frozen-state that characterized CP-targeted pre-neoplastic lesions, and thereby progress to an invasive phenotype.
Finally, our results show that p53 restricts the competence of CPs to undergo BCC initiation by promoting apoptosis and inducing cell cycle arrest in oncogene targeted CPs. Interestingly, although the division rates of CPs and SCs deficient for p53 are similar, SC-targeted tumours still grow to larger sizes than CP-targeted tumours, suggesting that the hierarchical organization is at least partially maintained even after two oncogenic hits. By establishing that sustained imbalance towards self-renewing divisions and resistance to p53 mediated apoptosis and cell cycle arrest are the main drivers of tumorigenesis, this study suggests that therapy promoting differentiation, p53 reactivation and apoptosis could present a promising avenue to promote BCC regression and prevent tumour relapse.
Methods
Mice
K14CREER transgenic mice23 were kindly provided by Elaine Fuchs, The Rockefeller University; INVCREER were generated in our laboratory8. Ptch1 flox/flox mice 24 and Rosa–SmoM2–YFP mice25 were obtained from the JAX repository. p53fl/fl26 mice were obtained from the National Cancer Institute at Frederick.
Mouse colonies were maintained in a certified animal facility in accordance with European guidelines. Experiments involving mice presented in this work were approved by Comité d’Ethique du Bien Être Animal (Université Libre de Bruxelles) under protocol number 483N, that states that animals should be euthanized if they present tumours that exceed 1cm in diameter. The BCCs observed in this study were microscopic and ranged from 1.5 mm to 100μm in diameter and in none of the experiments performed, the tumours exceeded the limit (1 cm in diameter) described in protocol 483N. Female and male animals have been used for all experiments and equal animal gender ratios have been respected in the majority of the analysis, analysis of the different mutant mice was not blind and sample size was calculated to reach statistical significance.
Skin tumour induction and clonal YFP expression
For clonal induction 3-months-old mice were used. K14CreER/Rosa-YFP, K14CreER/Rosa-SmoM2, K14CreER/SmoM2/p53fl/fl and K14CreER-Ptch1fl/fl mice received an intraperitoneal injection of 0,1mg of Tamoxifen and Inv-CreER/Rosa-YFP, Inv-CreER/Rosa-SmoM2, Inv-CreER/Rosa-SmoM2/p53fl/fl and INVCreER-Ptch1fl/fl received a intraperitoneal injection of 2.5mg of Tamoxifen to achieve similar level of recombination in the different models (Extended Data Figure 1a). Mice were sacrificed and analysed at different time points following Tamoxifen administration.
Immunostaining in sections
The tail, ventral skin and ear skin were embedded in optimal cutting temperature compound (OCT, Sakura) and cut into 5–8μm frozen sections using a CM3050S Leica cryostat (Leica Microsystems).
Immunostainings were performed on frozen sections. Owing to the fusion of SmoM2 with YFP, SmoM2-expressing cells were detected using anti-GFP antibody. Frozen sections were dried and then fixed with 4% paraformaldehyde/PBS (PFA) for 10min at room temperature and blocked with blocking buffer for 1h (PBS, horse serum 5%, BSA 1%, Triton 0.1%). Skin sections were incubated with primary antibodies diluted in blocking buffer overnight at 4 ° C, washed with PBS for 3 × 5 min, and then incubated with Hoechst solution and secondary antibodies diluted in blocking buffer for 1h at room temperature. Finally, sections were washed with PBS for 3 × 5 min at room temperature and mounted in DAKO mounting medium supplemented with 2,5% Dabco (Sigma). Primary antibodies used were the following: anti- GFP (Rabbit, 1/1000, BD, ref. A11122), anti-K14 (Chicken, 1/4000, Covance, ref. PCK-153P-0100) and anti-B4-integrin(Rat, 1:200, BD, ref.553745). The following secondary antibodies were used: anti-rabbit, anti-rat, anti-chicken, conjugated to AlexaFluor488 (Molecular Probes) and to rhodamine Red-X (JacksonImmunoResearch). Images of the immunostainings in sections were acquired using an Axio Imager M1 microscope, an AxioCamMR3 camera and the Axiovision software (Carl Zeiss).
Immunostaining in whole mounts
Whole mounts of tail epidermis were performed as previously described27 and used to quantify the proportion of surviving clones ( Extended Data Fig.2b) as well as the basal suprabasal and total clone size. Specifically, pieces of tail were incubated for 1h 37°C in EDTA 20mM in PBS in rocking plate, then using forceps the dermis and epidermis were separated and the epidermis was fixed for 30 minutes in PFA 4% in agitation at room temperature and washed 3 times with PBS.
For the immunostaining: tail skin pieces were blocked with blocking buffer for 3h (PBS, horse serum 5%, Triton 0.8%) in a rocking plate at room temperature. After, the skin pieces were incubated with primary antibodies diluted in blocking buffer overnight at 4 ° C, the next day they were washed with PBS-Tween 0.2% for 3 × 10 min at room temperature, and then incubated with the secondary antibodies diluted in blocking buffer for 3h at room temperature, washed 2x10 min with PBS-Tween 0.2% and washed for 10min in PBS. Finally, they were incubated in Hoechst diluted in PBS for 30 minutes at room temperature in the rocking plate, washed 3x10 min in PBS and mounted in DAKO mounting medium supplemented with 2,5% Dabco (Sigma). Primary antibodies used were the following: anti-GFP (Rabbit, 1/100, BD, ref. A11122), anti-GFP (Goat, 1:800,Abcam, ref. Ab6673), anti-active-caspase3 (Rabbit, 1/600,R&D, ref. AF835), anti-β4-integrin(Rat, 1:200, BD, ref. 553745) and anti-K31 (Guinea Pig, 1:200, Progen, ref. GP-hHa1). The following secondary antibodies were used: anti-rabbit, anti-rat, anti-chicken, anti-goat and anti-guinea pig, conjugated to AlexaFluor488 (Molecular Probes), to rhodamine Red-X (JacksonImmunoResearch) and to Cy5 (1:400, Jackson ImmunoResearch).
Analysis of clone survival, size and apoptosis
Quantification of the proportion of surviving clones, as well as, total and basal clone size was determined by counting the number of SmoM2-YFP and YFP-positive cells in each clone using whole-mount tail epidermis. The different clones were imaged using Z-stacks using a confocal microscope LSM 780 (Carl Zeiss) and orthogonal views were used to count the number of basal and total number of SmoM2-YFP or YFP-positive cells in each clone, as well as, the number of active-caspase3 positive cells in each clone. K31 staining was used to classify the clones according to their location in the scale or interscale regions.
Proliferation assays
To measure the kinetics of cell proliferation, a 24h continuous pulse of EdU followed with a continuous pulse of BrdU were performed. Specifically, mice received at t=0 an intraperitoneal injection of EdU (1mg/ml) and 0.1mg/ml EdU was added to their drinking water for 24h. The next days the mice received a daily intraperitoneal injection of BrdU (10mg/ml) and 1mg/ml of BrdU was added to their drinking water during the 8 days of the continuous BrdU pulse. Mice were sacrificed at different time points and whole mount stainings for the tail were performed. The pieces of tail were first stained for anti-GFP (following the protocol described in the previous section). Secondly, EdU staining was performed following the manufacturer’s instructions (Invitrogen). The pieces of tail were then washed in PBS and fixed again in PAF 4% for 10 minutes. After they were washed in PBS, incubated for 20 min in HCl 1 N at 37 °C, washed three times with PBS-Tween 0.2% and incubated overnight with Alexa 647-coupled anti-BrdU antibody (mouse, 1:200, BD). The next day the tail pieces were washed in PBS, incubated in Hoechst for 30 minutes at room temperature in the rocking plate, washed 3x10 min in PBS and mounted in DAKO mounting medium supplemented with 2,5% Dabco (Sigma). To quantify the number of cells that incorporated EdU and/or BrdU, Z-stacks were acquired for each individual clone and orthogonal views used to count.
Immunohistochemistry
For p53 immunohistochemistry, 4-μm paraffin sections were deparaffinized, rehydrated, followed by antigen unmasking performed for 20 min at 98°C in citrate buffer (pH 6) using the PT module. Endogenous peroxydase was blocked using 3% H2O2 (Merck) in methanol for 10 min at room temperature. Endogenous avidin and biotin were blocked using the Endogenous Blocking kit (Invitrogen) for 20 min at room temperature. In p53 staining, nonspecific antigen blocking was performed using M.O.M. Basic kit reagent. Mouse anti-p53 antibody (clone 1C12; Cell Signaling) was incubated overnight at 4°C. Anti-mouse biotinylated in M.O.M. Blocking kit, Stan- dard ABC kit, and ImmPACT DAB (Vector Laboratories) was used for the detection of HRP activity. Slides were then dehydrated and mounted using SafeMount (Labonord).
Supplemental statistics
For the quantification of the clone morphology of SmoM2-expressing clones in the scale and interscale regions (Fig.1f), we counted in K14-CreER/Rosa-SmoM2 mice, 128,109,76,195,168 and 142 clones in the interscale region ; 141,116,74,94,78 and 69 clones in the scale region from 3,4,4,6,4 and 5 independent experiments at 1,2,4,8,12 and 24 w respectively. In Inv-CreER/Rosa-SmoM2 mice, 104,78,42,127,160 and 344 clones were counted in the interscale region; 94,54,99,90,99 and 39 clones in the scale region from 4,4,4,5,4, and 8 independent experiments at 1,2,4,8,12,24 w respectively.
For the analysis of the clone size of the K14-CreER/Rosa-YFP mice (Fig. 2a,c and Extended Data Fig. 2), we counted clones (both in scale and interscale) from two independent experiments at 1w and 2w, five independent experiments at 4w, three independent experiments at 8w, two independent experiments at 12w and four independent experiments at 24 w. For the analysis of the clone size of the Inv-CreER/Rosa-YFP mice (Fig. 2b-c, Extended Data Fig. 2), we counted clones (both in scale and interscale) from two independent experiments at 1w and 2w, five independent experiments at 4w, three independent experiments at 8w, four independent experiments at 12w and three independent experiments at 24 w ( see Data Source) .
For the clonal persistence of the K14-CreER/Rosa-YFP mice (Fig. 2e and Extended Data Fig.2), we counted 167,176,129,100,47,246 clones in interscale and 184,109,75,66,19,103 clones in scale from 4,5,5,5,2,4, independent experiments at 1,2,4,8,12,and 24 w respectively. For 24w, we counted several areas per mice as the number of clones was reduced (see Data Source).
For the clonal persistence of the Inv-CreER/Rosa-YFP mice (Fig. 2e and Extended Data Fig.2), we counted 138,95,25,31,76,54 clones in interscale and 12,17,7,8,20,10 clones in scale from 2,4,2,3,4,and 3 independent experiments at 1,2,4,8,12 and 24 w respectively. For 12 and 24w, we counted several areas per mice as the number of clones was low ( see Data Source)
For the analysis of the clone size of the Inv-CreER/Rosa-SmoM2 mice (Fig. 3b,f, h, Extended Data Fig. 5-6), we counted clones (both in scale and interscale) from two independent experiments at 1w and 2w, from 4 independent experiments at 4w, from 6 independent experiments at 8w, from 6 independent experiments at 12w and from 4 independent experiments at 24 w.
For the clonal persistence of the Inv-CreER/Rosa-SmoM2 mice (Extended Data Fig 5-6), we counted 65,39,71,51,27,18 clones in interscale and 67,27,47,31,12 and 6 clones in scale from 2,2,4,3,2 and 2 independent experiments at 1,2,4,8,12 and 24w respectively.
For the analysis of the clone size of the K14-CreER/Rosa-SmoM2 mice (Fig. 4b,f, h, Extended Data Fig 6- 7), we counted clones (both in scale and interscale) from 3 independent experiments at 1w, from 2 independent experiments at 2w, 4w, from 6 independent experiments at 8w, from 4 independent experiments at 12w and from 2 independent experiments at 24w.
For the clonal persistence of the K14-CreER/Rosa-SmoM2 mice (Extended Data Fig.6-7), we counted 122,63,81,79,74 and 68 clones in interscale and 89,46,37,42,31 and 16 clones in scale from 4,3,4,4,4 and 4 independent experiments at 1,2,4,8,12 and 24w respectively.
For the cell proliferation kinetics experiments in the Inv-CreER/Rosa-SmoM2 mice (Fig. 3c, e): At 4w post-induction, we counted 33 clones from 3 independent experiments for 2 days of continuous BrdU, 30 clones from 2 independent experiments for 4 days of continuous BrdU, 33 clones from 2 independent experiments for 6 days of continuous BrdU. At 8w post-induction, we counted 41 clones from n=3 mice for 2 day of continuous BrdU, 16 clones from 2 independent experiments for 4 day of continuous BrdU, 30 clones from 2 independent experiments for 6 day of continuous BrdU and 24 clones from 2 independent experiments for 8 day of continuous BrdU. At 12w post-induction, we counted 19 clones from 2 independent experiments for 2 day of continuous BrdU, 26 clones from 2 independent experiments for 4 day of continuous BrdU, 27 clones from 2 independent experiments for 6 day of continuous BrdU and 31 clones from 2 independent experiments mice for 8 day of continuous BrdU. For the 2w post-induction data point, we use solely continuous BrdU incorporation, and counted 54 clones from 2 independent experiments.
For the cell proliferation kinetics experiments in the K14-CreER/Rosa-SmoM2 mice (Fig. 4c,e): At 4w post-induction, we counted 56 clones from 3 independent experiments for 2 days of continuous BrdU, 39 clones from 3 independent experiments for 4 days of continuous BrdU, 29 clones from 3 independent experiments for 6 days of continuous BrdU. At 8w post-induction, we counted 30 clones from 2 independent experiments for 2 days of continuous BrdU, 25 clones from 2 independent experiments for 4 days of continuous BrdU, 63 clones from 3 independent experiments for 6 days of continuous BrdU and 41 clones from 3 independent experiments for 8 days of continuous BrdU. At 12w post-induction, we counted 20 clones from 2 independent experiments for 2 days of continuous BrdU, 21 clones from 2 independent experiments for 4 days of continuous BrdU, 28 clones from 2 independent experiments for 6 days of continuous BrdU and 26 clones from 2 independent experiments for 8 days of continuous BrdU.
For the quantification of the clone morphology in absence of p53 interscale (Fig.5c). For K14-CreER/Rosa-SmoM2/p53fl/fl mice 186,217,90,343,452 and 543 clones from 3,3,2,3,5 and 5 independent experiments and for Inv-CreER/Rosa-SmoM2/p53fl/fl 95,98,199,271,263 and 210 clones from 3,3,3,4,4 and 4 independent experiments were analysed at 1,2,4,8,12 and 24 w respectively. In the quantification in the scale region (Extended Data Fig.8b) for K14-CreER/Rosa-SmoM2/p53fl/fl 178,204,100,132,232 and 120 clones were counted from 3,3,2,3,5,and 5 independent experiments 1,2,4,8,12 and 24 w respectively. For Inv-CreER/Rosa-SmoM2 82,127,167,136,62 and 153 clones were counted from 2,3,3,4,4 and 5 independent experiments 1,2,4,8,12 and 24 w respectively.
For the cell proliferation kinetics experiments in the Inv-CreER/Rosa-SmoM2/p53fl/fl mice (Fig. 5f) at 12w post-induction 34 clones from 3 independent experiments were counted. For the cell proliferation kinetics experiments in the K14-CreER/Rosa-SmoM2/p53fl/fl mice (Fig. 5f) at 12w post-induction 44 clones from two independent experiments were counted.
For the clonal persistence experiments in Inv-CreER/Rosa-SmoM2/p53fl/fl, 132,78,68,58 and 89 clones from 4,3,3,3 and 5 independent experiments were counted at 1,2,4,8,12 and 24 w and in K14-CreER/Rosa-SmoM2/p53fl/fl mice 124,82,53,76 and 100 clones were counted from 4,3,2,3 and 4 independent experiments at 1,2,4,8 and 12w respectively (Extended Data Fig.8e). ( See Data Source)
Extended Data
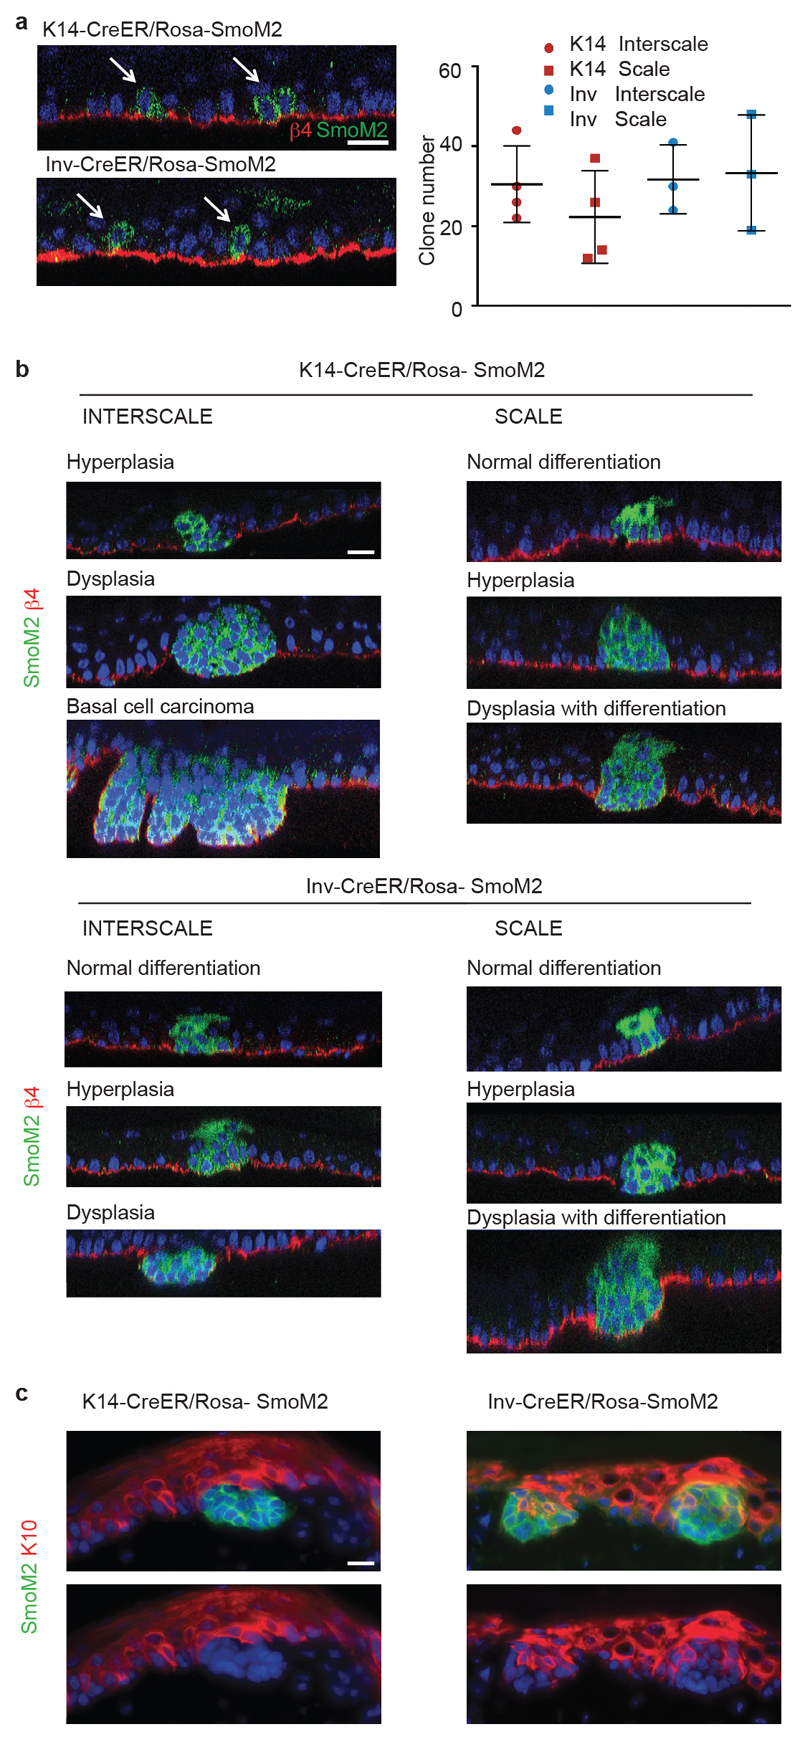
Extended data Figure 1. The fate of oncogene targeted clones is determined by the initial targeted cell (SC or CP) and their location in scale or interscale regions.
(a) Orthogonal view used to quantify the number of clones, cells stained with β4-integrin/SmoM2. (left). Quantification of the number of clones induced 1 week after Tamoxifen administration in scale and interscale regions in K14-CreER/Rosa-SmoM2 (n=4 animals, 0.1mg Tamoxifen) and Inv-CreER/ Rosa-SmoM2 (n=3 animals, 2.5 mg Tamoxifen) (right). (b) Immunostaining for β4-integrin and SmoM2 in K14-CreER/Rosa-SmoM2 and Inv-CreER/Rosa-SmoM2 clones located in the scale and interscale regions, 8w after oncogene activation. (c) Immunostaining for the differentiation marker keratin-10, K10, and SmoM2 in K14-CreER/Rosa-SmoM2 and Inv-CreER/Rosa-SmoM2 clones 8w after oncogene activation, showing absence of differentiated cells in K14-CreER/Rosa-SmoM2 clones and alteration of the differentiation in Inv-CreER/Rosa-SmoM2 clones. Hoechst nuclear staining is represented in blue; Scale bars, 10μm.
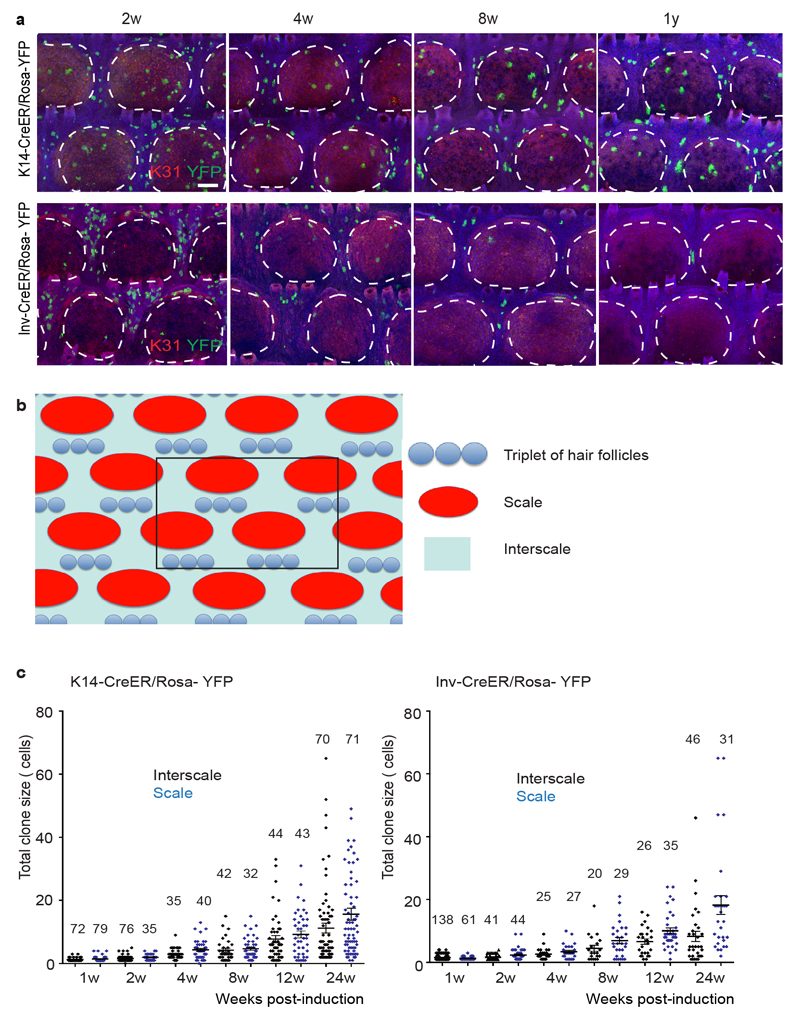
Extended data Figure 2. Evolution of K14-CreER/Rosa-YFP and Inv-CreER/Rosa-YFP clones in scale and interscale regions.
(a) Whole mount immunostaining for YFP/K31 in K14-CreER/Rosa-YFP mice and Inv-CreER/Rosa-YFP mice upon Tamoxifen administration. (b) Scheme representing the area of tail epidermis (area comprised by 6 groups of triplets of hair follicles, highlighted in black) that is used to quantify the clone number and persistence. (c) Distribution of K14-CreER/Rosa-YFP and Inv-CreER/Rosa-YFP total clone sizes as measured by total cell content of surviving clones, imaged by confocal microscopy on whole-mount tail epidermis from 1 to 24 weeks following Tamoxifen administration. The number of analyzed clones is indicated for each time point. Hoechst nuclear staining is represented in blue; scale bars, 100μm. Histograms and error bars represent the mean and the standard error of the mean (s.e.m)
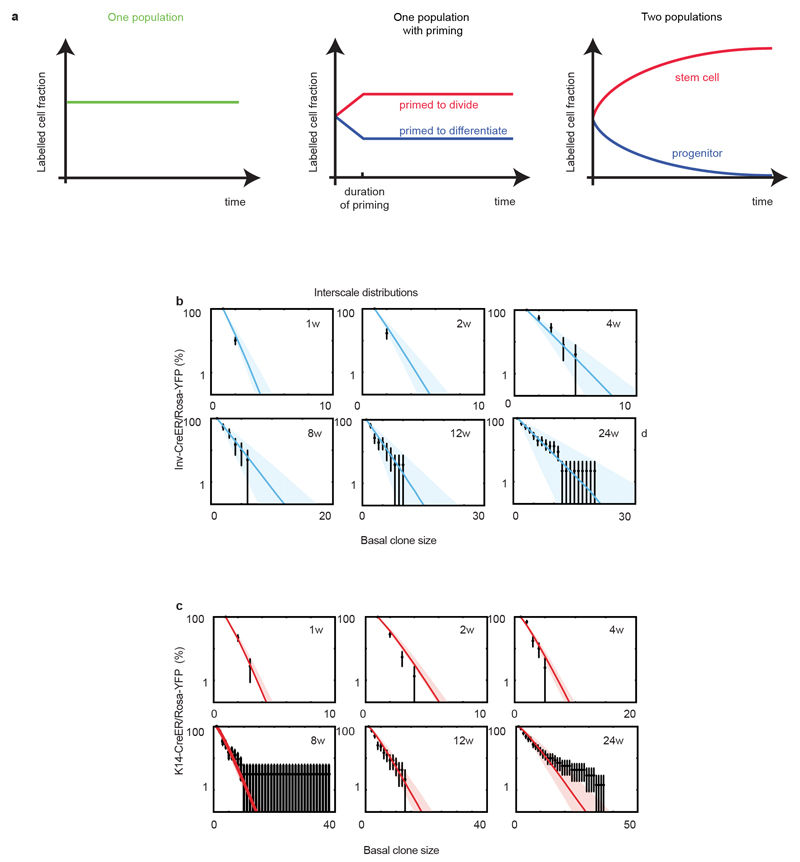
Extended data Figure 3. The interscale is maintained by two cell populations during homeostasis.
(a) Evolution in time of the total labelled cell fraction under three hypotheses. For a perfect single population of equipotent balanced progenitors, the labelled cell fraction remains constant. For a single population of equipotent balanced progenitors displaying short-term priming, the labelled cell fraction increases transiently for the cells primed to divide, and decreases transiently for the cells primed to differentiate, but after the priming period, both fractions remain constant at different values. For two populations organised in a hierarchy, the labelled fraction of the progenitors decreases continuously to zero, while the labelled fraction of the stem cells continuous increases to reach a steady state value, corresponding to its average progeny size. (b) Cumulative basal clone size distribution of Inv-CreER/Rosa-YFP clones at homeostasis in the interscale upon Tamoxifen administration. (c) Cumulative basal clone size distribution of K14-CreER/Rosa-YFP clones at homeostasis in the interscale upon Tamoxifen administration. Clonal distributions are plotted in log-plot, error bars indicate S.D., thick lines are the model prediction and shaded area indicate 95% confidence intervals in the model prediction.
Extended data Figure 4. The scale is maintained by a single population during homeostasis.
(a) Evolution of mean surviving basal (top) and suprabasal (bottom) clone size in the scale for K14-CreER/Rosa-YFP (red) and Inv-CreER/Rosa-YFP (blue). In contrast to the interscale, in the scale K14- and Inv-CreER clones behave identically, indicative of a single progenitor pool. The lines are the fit from the model from which we extract the fate choices of progenitors displayed in b. (b) Fate choices of the equipotent progenitor pool in the scale, as extracted from the fits. (c) Clonal persistence (top) and labelled cell fraction (bottom) in the scale for K14-CreER/Rosa-YFP (red) and Inv-CreER/Rosa-YFP (blue). The blue and red lines are the predictions of the model (see Supplementary Notes for details) using only the parameters extracted in b. K14- and Inv-CreER clones behave similarly and display near-perfect long-term balance. For the clonal persistence data, we examined in each mouse a randomly chosen area shown in Extended data Fig. 2b. Error bars represent the s.e.m. (d) Cumulative basal clone size distribution of K14-CreER/Rosa-YFP clones at homeostasis in the scale upon Tamoxifen administration. One should note that there were too few Involucrin clones in the scale to plot meaningful distributions. Clonal distributions are plotted in log-plot, error bars indicate S.D, thick lines are the model prediction and shaded area indicate 95% confidence intervals in the model prediction.
Extended data Figure 5. Clonal dynamics of interscale InvSmoM2 clones is consistent with a single imbalanced population of progenitors slowing down in time.
(a) Distribution of Inv-CreER/Rosa-YFP (black) and Inv-CreER/Rosa-SmoM2 (red) clone sizes as measured by total cell content, imaged by confocal microscopy on whole mount tail epidermis from 1w to 24w following Tamoxifen administration. The number of clones analysed in Inv-CreER/Rosa-SmoM2 is indicated in Fig 3b. The number of clones counted in Inv-CreER/Rosa-YFP is as indicated in Fig. 2b. (b) Evolution of the clonal persistence for interscale Inv-CreER/Rosa-SmoM2 clones. (c) Labelled cell fraction for interscale Inv-CreER/Rosa-SmoM2 clones. (d) Fraction of EdU/BrdU double-labelled cells as a function of basal clone size at 8w for Inv-CreER/Rosa-SmoM2 clones, for 2 (left), 4 (centre) and 6 (right) days of continuous BrdU incorporation. (e) Immunostaining for β4-integrin, SmoM2 and active-caspase-3 in Inv-CreER/Rosa-SmoM2 clones at 8w post-induction. (f) Percentage of dysplastic, hyperplastic and normally differentiating Inv-CreER/Rosa-SmoM2 clones presenting at least one active-caspase positive cell within the clone at 8w post-induction (n= 73 clones analysed from 4 independent experiments). (g) Quantification of the number (%) of basal and suprabasal apoptotic cells in dysplastic, hyperplastic and normally differentiating Inv-CreER/Rosa-SmoM2 clones 8w after SmoM2-activation. (h) Percentage of dysplastic, hyperplastic and normally differentiating Inv-CreER/Rosa-SmoM2 clones presenting apoptosis in basal and suprabasal compartments 8w after oncogenic activation. (i) Cumulative distribution of the fraction of basal apoptosis as a function of basal cell number in an Inv-CreER/Rosa-SmoM2 clone at 8w (data in blue). The green line is the expected theoretical distribution of apoptotic fraction if apoptosis occurred randomly (following a Poisson process), in any clone with the same probability. The data is statistically different from the random theory, showing that apoptosis clusters in certain clones at a given time point. (j) Short-term fate outcome of progenitors in Inv-CreER/Rosa-SmoM2 clones at 8w, as assessed by using EdU as a clonal marker. We count only cell doublets and classify them as either basal-basal, basal-suprabasal, or suprabasal-suprabasal. (n=47 clones from 3 independent experiments). Immunostaining for β4-integrin, EdU and SmoM2 showing the different type of cell fate outcomes found in Inv-CreER/Rosa-SmoM2 clones. D: dysplasia; H: hyperplasia; N: normal differentiation. Hoechst nuclear staining is represented in blue; Scale bars, 10μm. Histograms and error bars represent the mean and the s.e.m.
Extended data Figure 6. Clonal dynamics of Inv-CreER/Rosa-SmoM2 and K14-CreER/Rosa-SmoM2 clones in the scale are similar.
(a) Evolution of mean surviving basal clone sizes (top) and labelled cell fraction (bottom), for K14-CreER/Rosa-SmoM2, in the scale. (b) Evolution of mean surviving basal clone sizes (top) and labelled cell fraction (bottom), for Inv-CreER/Rosa-SmoM2, in the scale. Whereas the interscale clones show net expansion, scale clones, both Inv-CreER and K14-CreER, show near balance at the population level. (c) Evolution of the persistence of K14-CreER/Rosa-SmoM2 (green) and Inv-CreER/Rosa-SmoM2 (purple) clones in the scale. Strikingly, and in contrast to the interscale, both K14 and Involucrin clones have the same persistence. (d) Mean basal clone size, normalised by the mean clone size at 1w for both Inv-CreER and K14-CreER clones. Even though one can see on panel (a) and (b) that the final clone size is higher in K14, this is fully explained by short-term differences in fate during the first week indicative of short-term priming for K14. Correspondingly, the evolution of the labelling fraction is very similar for K14 and Involucrin in scale. Therefore, K14-CreER/Rosa-SmoM2 and Inv-CreER/Rosa-SmoM2 in scale display the same long-term kinetics upon oncogenic activation, consistent with the one-population model uncovered at homeostasis. Error bars represent the s.e.m.
Extended data Figure 7. Clonal dynamics of interscale K14-CreER/Rosa-SmoM2 clones is consistent with two populations.
(a) Distribution of K14-CreER/Rosa-YFP (black) and K14-CreER/Rosa-SmoM2 (red) clone sizes as measured by total cell content, imaged by confocal microscopy on whole mount tail epidermis from 1w to 24w post-induction. The number of clones analyzed for K14-CreER/Rosa-SmoM2 is indicated in Fig 4b; the number of clones counted in K14-CreER/Rosa-YFP is as indicated in Fig. 2a. (b) Evolution of the clonal persistence and (c) labelled cell fraction for K14-CreER/Rosa-SmoM2 clones in the interscale. (d) Fraction of EdU/BrdU double-labelled cells as a function of basal clone size at 8w for K14-CreER/Rosa-SmoM2 clones, for 2 (left), 4 (centre) and 6 (right) days of continuous BrdU incorporation. (e) Immunostaining for β4-integrin, SmoM2 and active-caspase-3 in K14-CreER/Rosa-SmoM2 clones 8w after SmoM2 activation. (f) Percentage of BCC, dysplastic, hyperplastic and normally differentiating clones presenting at least one active-caspase-3 positive cell at 8w post-induction (n=117 clones analysed from 4 independent experiments). (g) Quantification of the number (%) of basal and suprabasal apoptotic cells in dysplastic, hyperplastic and normally differentiating Inv-CreER/Rosa-SmoM2 clones 8w after SmoM2-activation. (h) Percentage of dysplastic, hyperplastic and normally differentiating Inv-CreER/Rosa-SmoM2 clones presenting basal and suprabasal apoptosis 8w after oncogenic activation. (i) Cumulative distribution of the fraction of basal apoptosis as a function of basal cell number in a K14-CreER/Rosa-SmoM2 clone at 8w (data in red). The green line is the expected theoretical distribution of apoptotic fraction if apoptosis occurred randomly (following a Poisson process), in any clone with the same probability. The data is statistically different from the random theory, showing that apoptosis clusters in certain clones at a given time point. (j) Quantification of EdU/BrdU double-labelled cells as a function of the period of continuous BrdU incorporation for large K14 clones at 4w (black), 8w (orange) and 12w (red) post clonal induction. The dashed lines represent the model fit (Supplementary Theory). (k) Whisker plot of the suprabasal clone size in the interscale. The boxes delineate the first and third quartiles of the data, while the whiskers delineate the first and last decile of the data at a given time point. The thick continuous line is the best fit from the model from which we extract the probability of fate choices in tumor SC and progenitors, displayed in Fig.4g. The thin lines represent the mean clone sizes of stem cells (top curve) and progenitors (bottom curve) if they were alone. (l) Short-term fate outcome of progenitors in K14-CreER/Rosa-SmoM2 clones at 8w, as assessed by using EdU as a clonal marker. We count only cell doublets and classify them as either basal-basal, basal-suprabasal, or suprabasal-suprabasal. (n=49 clones from 3 independent experiments) Immunostaining for β4-integrin, EdU and SmoM2 in K14-CreER/Rosa-SmoM2 hyperplastic/dysplastic clones (top) and in BCC (bottom panel). BCC: basal cell carcinoma; D: dysplasia; H: hyperplasia; N: normal differentiation; SB: suprabasal. Hoechst nuclear staining is represented in blue; Scale bars, 10μm. Error bars represent the s.e.m.
Extended data Figure 8. Effect of p53 deletion in the cellular dynamics of CPs and SCs.
(a) IHC staining for p53 in Inv-CreER/Rosa-SmoM2 and K14-CreER/Rosa-SmoM2 clones 12 w post-induction (b) Quantification of normal, hyperplastic, dysplastic and BCC clones in scale region of K14CreER/Rosa-SmoM2/p53fl/fl and Inv-CreER/Rosa-SmoM2/p53fl/fl mice. Description of number of counted clones is found in the method section.(c) Distribution of clone sizes as measured by total cell content, imaged by confocal microscopy on whole mount tail epidermis. The number of clones analysed is indicated in Fig 5d. Clone merger events were observed after 12w following oncogenic activation in K14Cre-ER/Rosa-SmoM2/p53fl/fl preventing the accurate quantification of clonal persistence and clone size at long times. (d) Comparison of basal clone size distribution of Inv-CreER/Rosa-SmoM2/p53fl/fl vs. Inv-CreER/Rosa-SmoM2 and K14-CreER/Rosa-SmoM2/p53fl/fl vs. K14-CreER/Rosa-SmoM2 at 8w and 12w upon Tamoxifen administration. (e) Evolution of the clonal persistence of Inv-CreER/Rosa-SmoM2/p53fl/fl and K14-CreER/Rosa-SmoM2/p53fl/fl clones. (f) Immunostaining of active-caspase-3 and SmoM2 8w post-induction in Inv-CreER/Rosa-SmoM2/p53fl/fl (g) Quantification of the proportion of apoptotic clones in Inv-CreER/Rosa-SmoM2/p53fl/fl (n=90 clones from 3 independent experiments), and K14-CreER/Rosa-SmoM2/p53fl/fl (n=82 animals from 3 independent experiments) 8w post-induction. Hoechst nuclear staining is represented in blue; Scale bars, 10μm. Error bars represent the s.e.m.
Extended data Figure 9. Model of BCC initiation.
Activation of SmoM2 in SCs leads to the generation of BCC due to an increase in cell proliferation and resistance to apoptosis. However, activation of p53 in SmoM2-expressing CPs restricts the progression of dysplastic clones to BCC by promoting apoptosis and cell cycle arrest. Deletion of p53 in CPs allows them to progress into BCC.
Supplementary Material
Acknowledgments
We would like to thank J-M. Vanderwinden and the LiMiF for the help with confocal microscopy. C.B. is an investigator of WELBIO. A.S-D. and JC.L. are supported by a fellowship of the FNRS and FRIA respectively. B.D.S. and E.H. are supported by the Wellcome Trust (grant number 098357/Z/12/Z and 110326/Z/15/Z). EH is supported by a fellowship from Trinity College, Cambridge. This work was supported by the FNRS, the IUAP program, the Fondation contre le Cancer, the ULB fondation, the foundation Bettencourt Schueller, the foundation Baillet Latour, a consolidator grant of the European Research Council.
Footnotes
Author Contribution
A.S-D., C.B., E.H., B.D.S. designed the experiments, performed data analysis and wrote the manuscript; A.S-D performed all of the biological experiments; E.H. performed all the mathematical modelling. J.C.L and M.L. provided technical support. K.K.Y. made initial observations pertinent to the study.
Author Information
Reprints and permissions information is available at www.nature.com/reprints. Readers are welcome to comment on the online version of this article at www.nature.com/nature.
The authors declare no competing financial interests.
References
- 1.Hanahan D, Weinberg RA. Hallmarks of cancer: the next generation. Cell. 2011;144:646–674. doi: 10.1016/j.cell.2011.02.013. [DOI] [PubMed] [Google Scholar]
- 2.Vermeulen L, et al. Defining stem cell dynamics in models of intestinal tumor initiation. Science. 2013;342:995–998. doi: 10.1126/science.1243148. [DOI] [PubMed] [Google Scholar]
- 3.Snippert HJ, Schepers AG, van Es JH, Simons BD, Clevers H. Biased competition between Lgr5 intestinal stem cells driven by oncogenic mutation induces clonal expansion. EMBO Rep. 2014;15:62–69. doi: 10.1002/embr.201337799. [DOI] [PMC free article] [PubMed] [Google Scholar]
- 4.Epstein EH. Basal cell carcinomas: attack of the hedgehog. Nat Rev Cancer. 2008;8:743–754. doi: 10.1038/nrc2503. [DOI] [PMC free article] [PubMed] [Google Scholar]
- 5.Blanpain C, Simons BD. Unravelling stem cell dynamics by lineage tracing. Nat Rev Mol Cell Biol. 2013;14:489–502. doi: 10.1038/nrm3625. [DOI] [PubMed] [Google Scholar]
- 6.Blanpain C, Fuchs E. Stem cell plasticity. Plasticity of epithelial stem cells in tissue regeneration. Science. 2014;344:1242281. doi: 10.1126/science.1242281. [DOI] [PMC free article] [PubMed] [Google Scholar]
- 7.Mascre G, et al. Distinct contribution of stem and progenitor cells to epidermal maintenance. Nature. 2012;489:257–262. doi: 10.1038/nature11393. [DOI] [PubMed] [Google Scholar]
- 8.Lapouge G, et al. Identifying the cellular origin of squamous skin tumors. Proceedings of the National Academy of Sciences of the United States of America. 2011;108:7431–7436. doi: 10.1073/pnas.1012720108. [DOI] [PMC free article] [PubMed] [Google Scholar]
- 9.Youssef KK, et al. Identification of the cell lineage at the origin of basal cell carcinoma. Nat Cell Biol. 2010;12:299–305. doi: 10.1038/ncb2031. [DOI] [PubMed] [Google Scholar]
- 10.Youssef KK, et al. Adult interfollicular tumour-initiating cells are reprogrammed into an embryonic hair follicle progenitor-like fate during basal cell carcinoma initiation. Nat Cell Biol. 2012;14:1282–1294. doi: 10.1038/ncb2628. [DOI] [PubMed] [Google Scholar]
- 11.Wong SY, Reiter JF. Wounding mobilizes hair follicle stem cells to form tumors. Proc Natl Acad Sci U S A. 2011;108:4093–4098. doi: 10.1073/pnas.1013098108. [DOI] [PMC free article] [PubMed] [Google Scholar]
- 12.Kasper M, et al. Wounding enhances epidermal tumorigenesis by recruiting hair follicle keratinocytes. Proc Natl Acad Sci U S A. 2011;108:4099–4104. doi: 10.1073/pnas.1014489108. [DOI] [PMC free article] [PubMed] [Google Scholar]
- 13.Gomez C, et al. The Interfollicular Epidermis of Adult Mouse Tail Comprises Two Distinct Cell Lineages that Are Differentially Regulated by Wnt, Edaradd, and Lrig1. Stem cell reports. 2013;1:19–27. doi: 10.1016/j.stemcr.2013.04.001. [DOI] [PMC free article] [PubMed] [Google Scholar]
- 14.Clayton E, et al. A single type of progenitor cell maintains normal epidermis. Nature. 2007;446:185–189. doi: 10.1038/nature05574. [DOI] [PubMed] [Google Scholar]
- 15.Bonilla X, et al. Genomic analysis identifies new drivers and progression pathways in skin basal cell carcinoma. Nat Genet. 2016;48:398–406. doi: 10.1038/ng.3525. [DOI] [PubMed] [Google Scholar]
- 16.Chen J. The Cell-Cycle Arrest and Apoptotic Functions of p53 in Tumor Initiation and Progression. Cold Spring Harbor perspectives in medicine. 2016;6 doi: 10.1101/cshperspect.a026104. [DOI] [PMC free article] [PubMed] [Google Scholar]
- 17.Schuller U, et al. Acquisition of granule neuron precursor identity is a critical determinant of progenitor cell competence to form Shh-induced medulloblastoma. Cancer Cell. 2008;14:123–134. doi: 10.1016/j.ccr.2008.07.005. [DOI] [PMC free article] [PubMed] [Google Scholar]
- 18.Yang ZJ, et al. Medulloblastoma can be initiated by deletion of Patched in lineage-restricted progenitors or stem cells. Cancer Cell. 2008;14:135–145. doi: 10.1016/j.ccr.2008.07.003. [DOI] [PMC free article] [PubMed] [Google Scholar]
- 19.Barker N, et al. Crypt stem cells as the cells-of-origin of intestinal cancer. Nature. 2009;457:608–611. doi: 10.1038/nature07602. [DOI] [PubMed] [Google Scholar]
- 20.White AC, et al. Defining the origins of Ras/p53-mediated squamous cell carcinoma. Proc Natl Acad Sci U S A. 2011;108:7425–7430. doi: 10.1073/pnas.1012670108. [DOI] [PMC free article] [PubMed] [Google Scholar]
- 21.Lapouge G, et al. Skin squamous cell carcinoma propagating cells increase with tumour progression and invasiveness. Embo J. 2012;31:4563–4575. doi: 10.1038/emboj.2012.312. [DOI] [PMC free article] [PubMed] [Google Scholar]
- 22.Zhu L, et al. Prominin 1 marks intestinal stem cells that are susceptible to neoplastic transformation. Nature. 2009;457:603–607. doi: 10.1038/nature07589. [DOI] [PMC free article] [PubMed] [Google Scholar]
- 23.Vasioukhin V, Degenstein L, Wise B, Fuchs E. The magical touch: genome targeting in epidermal stem cells induced by tamoxifen application to mouse skin. Proc Natl Acad Sci U S A. 1999;96:8551–8556. doi: 10.1073/pnas.96.15.8551. [DOI] [PMC free article] [PubMed] [Google Scholar]
- 24.Uhmann A, et al. The Hedgehog receptor Patched controls lymphoid lineage commitment. Blood. 2007;110:1814–1823. doi: 10.1182/blood-2007-02-075648. [DOI] [PubMed] [Google Scholar]
- 25.Mao J, et al. A novel somatic mouse model to survey tumorigenic potential applied to the Hedgehog pathway. Cancer Res. 2006;66:10171–10178. doi: 10.1158/0008-5472.CAN-06-0657. [DOI] [PMC free article] [PubMed] [Google Scholar]
- 26.Jonkers J, et al. Synergistic tumor suppressor activity of BRCA2 and p53 in a conditional mouse model for breast cancer. Nat Genet. 2001;29:418–425. doi: 10.1038/ng747. [DOI] [PubMed] [Google Scholar]
- 27.Braun KM, et al. Manipulation of stem cell proliferation and lineage commitment: visualisation of label-retaining cells in wholemounts of mouse epidermis. Development. 2003;130:5241–5255. doi: 10.1242/dev.00703. [DOI] [PubMed] [Google Scholar]
Associated Data
This section collects any data citations, data availability statements, or supplementary materials included in this article.


