

Abstract
A MS-based methodology has been developed for analysis of core-fucosylated versus antennary-fucosylated glycosites in glycoproteins. This procedure is applied to the glycoprotein alpha-1-antitrypsin (A1AT), which contains both core- and antennary-fucosylated glycosites. The workflow involves digestion of intact glycoproteins into glycopeptides, followed by double digestion with sialidase and galactosidase. The resulting glycopeptides with truncated glycans were separated using an off-line HILIC (hydrophilic interaction liquid chromatography) separation where multiple fractions were collected at various time intervals. The glycopeptides in each fraction were treated with PNGase F and then divided into halves. One half of the sample was applied for peptide identification while the other half was processed for glycan analysis by derivatizing with a meladrazine reagent followed by MS analysis. This procedure provided site-specific identification of glycosylation sites and the ability to distinguish core fucosylation and antennary fucosylation via a double digestion and a mass profile scan. Both core and antennary fucosylation are shown to be present on various glycosites in A1AT.
Keywords: Alpha-1-antitrypsin, Antennary fucosylation, Core fucosylation, Glycan structure, Liquid chromatography-mass spectrometry
1 Introduction
Recent studies have shown that protein glycosylation can be related to disease states [1, 2]. In particular, fucosylation has been studied as a potential marker for several different cancers and diseases, such as hepatocellular carcinoma [3], pancreatic cancer [4] and lung cancer [5]. In some studies total fucosylation has often been shown to be related to disease state by using lectin blots [6–8]. However, more recently it has been found that specific fucosylation structures and the specific fucosylation sites of a glycoprotein may be more directly related to changes in disease [9, 10].
The fucosylation structures include core fucosylation and antennary fucosylation where both may be present on any glycosylation site. One fucosylated glycoprotein usually has several fucosylation sites. Lectin blots can neither provide the fucosylation level of each site of the proteins nor distinguish the two fucosylation structures specifically. Some studies have used lectins to enrich the core-fucosylated or antennary-fucosylated glycoproteins before removing the glycan and analyze proteins and/or glycans separately [11, 12], where for example Aleuria Aurantia lectin (AAL) has high affinity to both core- and antennary-fucosylated glycoproteins whereas Lens culinaris lectin (LCA) has high affinity to core-fucosylated glycoproteins. However, such analyses missed the site-specific information and cannot provide direct evidence for core fucosylation or antennary fucosylation of these glycoproteins.
MS can be used to identify most structures of glycans [13–15], but it is often difficult to do so for fucosylated glycans because the fucose glycosidic bond is labile in dissociation where even MS/MS may not distinguish whether it is core or antennary fucosylated. A widely accepted glycan structure analysis approach to distinguish the fucosylation structures uses various fucosidases to digest the glycan and analyze the glycan several times with high-pressure liquid chromatography (HPLC), but this approach is very time consuming, which usually involves various fucosidases and several runs of HPLC analysis [5]. Recent studies have analyzed the glycopeptide with truncation of the glycan at the core glycan structure between GlcNAc-GlcNAc (N-acetylglucosamine) [16, 17]. A core-fucosylated glycopeptide with core-fucose modification on the inner GlcNAc could be easily distinguished with MS, where site-specific information was also maintained. However, this procedure cannot be applied to antennary fucosylation structures.
In current work, we have developed a methodology to distinguish core fucosylation and antennary fucosylation of glycans at each site of a glycoprotein as applied to the protein A1AT. The procedure involves a double digestion of glycopeptides with sialidase and galactosidase, followed by an off-line HILIC (hydrophilic interaction liquid chromatography) column separation of glycopeptides with a truncated glycan. Using this method only a single run of LC–MS analysis is needed for the sialidase/galactosidase digestion procedure to differentiate core/antennary fucosylation, whereas at least two runs are needed for the fucosidase digestion procedure, one run without fucosidase digestion and another run with corresponding fucosidase digestion. The glycopeptides in each fraction were further digested with PNGase F where the peptides are analyzed by LC–MS/MS directly and the glycans are derivatized by Meladrazine reagent before LC–MS analysis. This procedure has been used to identify site-specific glycosylation and to distinguish core fucosylation and antennary fucosylation via use of the mass profile scan in the protein A1AT.
2 Materials and methods
2.1 Trypsin digestion, followed by sialidase/galactosidase double digestion
For trypsin digestion, we added 10 μL of 100 mM triethylammonium bicarbonate to 30 μg alpha-1-antitrypsin (A1AT) and pipetted to dissolve the sample well. Then dissolved A1AT was reduced with 10 mM tris (2-carboxyethyl) phosphine at 37°C for 30 min and alkylated with 20 mM iodoacetamide at room temperature in the dark for 15 min. The sample solution is diluted for three times with 100 mM triethylammonium bicarbonate and incubated with 2 μL (0.5 μg/μL) trypsin (Promega, Madison, WI) at 37°C for 16 h. The trypsin is eventually deactivated at 95°C for 5 min and dried in a SpeedVac.
For the sialidase and galactosidase digestion, the glycopeptide mixture was dissolved in 30 μL of 25 mM sodium acetate solution (pH 5.5) and incubated with 15 mU (3 μL) of nonspecific sialidase and 75 mU (3 μL) of β(1–4,6) galactosidase (Prozyme, Hayward, CA) at 37°C for 18 h to remove all sialic acid residues and remove galactose on condition that no fucose is bound to the subterminal N-acetylglucosamine in an N-glycan. The glycosidases were deactivated at 95°C for 5 min. In order to confirm core and antennary fucosylation of the sialidase/galactosidase double digested glycans, various fucosidases were used to cut the corresponding fucose as described by Varadi et al. [18].
2.2 C18 desalting
TFA was added until the pH value reached 2. The columns were prewetted with 200 μL 0.1% TFA in 50% ACN for five times and equilibrated with 0.1% TFA in water for three times by centrifugation at 1500 g/min for 1 min each time. The peptides were bound to the C18 medium for five times followed by three times washing with 0.1% TFA to remove nonspecific binding by centrifugation as described above; 20 μL of 50% ACN with 0.1% TFA was used for elution by centrifugation as described above. Elution was repeated once and the combined eluents were then dried in a SpeedVac.
2.3 Off-line HILIC fractionation
The column used was a Waters Xbridge HILIC column, 2.1 × 150 mm, 5 μm. The separations were performed on a Beckman HPLC system with detection at 214 nm. The sample was diluted to 100 μL with initial phase, and filtered with a 0.45 μm membrane. The gradient was set from 80 to 50% Solvent B (Solvent A: 10 mM ammonium formate; Solvent B: 980 mL ACN, 20 mL H2O, 0.1% formic acid) with a flow rate 0.2 mL/min and collection every 2 min.
2.4 PNGase F digestion, purification of deglycosylated peptides, and extraction of glycan
N-Glycosidase F (PNGase F, 2.5 U/10 μg protein) (New England Biolabs, Ipswich, MA) was added and incubated at 37 °C for 18 h. PNGase F was deactivated by boiling for 5 min. Half of the protein glycan mixture was dried in a SpeedVac, desalted with a C18 column as described above and dried for further peptide identification by LC–MS. The other half was used for glycan structure analysis.
Ten microliters porous graphitized carbon tips (PGC tips) (Sigma Aldrich, St. Louis, MO) was used to separate glycans from proteins and other impurities. The tip was activated by 50% ACN (with 0.1% TFA) and equilibrated with water (with 0.1% TFA). The samples were then loaded to the tip followed by three washes with water (with 0.1% TFA) to remove non-specific binding. Then 10 μL of 10% ACN (with 0.1% TFA) and 10 μL of 25% ACN (with 0.1% TFA) were used for glycan elution where the two eluents were combined and dried down for further glycan analysis.
2.5 LC–MS identification of peptides
Nano LC–MS/MS conditions were as described in previous work [17]. A Magic C18 capillary column (100 μm × 15 cm; 3 μm particles, 200 A) (Michrom Biosciences, Auburn, ° CA) was used for LC separation, and gradient elution was performed using a Paradigm MG4 micropump system (Michrom Biosciences) with a flow rate of 350 nL/min. The mobile phase A was 2% ACN with 0.1% formic acid in water and mobile phase B was 2% water with 0.1% formic acid in ACN. The analytical gradient lasted for 80 min where the composition of solvent B increased from 5 to 32% in 50 min, followed by a washing and equilibration step where solvent B increased to 95% in 1 min and was held for 4 min, and then returned to 5% B in 0.1 min and was held for 25 min.
An ESI-LTQ mass spectrometer (Thermo Fisher Scientific, San Jose, CA) operated in positive-ion mode was used for analysis. The ESI spray voltage and capillary voltage were set at 2.2 kV and 45 V, respectively. Collision ionization dissociation (CID) fragmentation was performed at 35% of the normalized collision energy. The mass spectra were acquired in a data-dependent manner. Following a full scan in the mass range of m/z 400 to 1800, CID MS/MS was performed on the five most intense ions.
2.6 Database search for peptide identification
The mass spectrum was searched with Proteome Discoverer1.2 (Thermo Fisher Scientific) software with SEQUEST using the following settings: (i) fixed modification: cysteine carbamidomethylation (+57.0 Da); (ii) dynamic modification: methionine oxidation (+16.0 Da), addition of +1 Da to asparagine residue due to PNGase F digestion; (iii) one missed cleavage was allowed; (iv) peptide ion tolerance: 1.4 Da; (5) fragment ion tolerance: 0.8 Da; (6) SWISS-PROT Homo sapiens database (reviewed, downloaded in April 2014) was used.
2.7 Glycan derivatization with meladrazine
For derivatization of the glycans by meladrazine [19, 20], the glycans were dissolved in 1 μL H2O and then 20 μL meladrazine (T3) labeling reagent (Mr 235.2115) was added (50 mM, methanol: acetic acid = 3:1) at 60°C for 3 h. For LC analysis, the samples were then dried and dissolved in 20 μL 80% ACN for HILIC separation.
2.8 LC–MS identification for derivatized glycans
LC-MS system used for glycan identification was the same as previously used for peptide identification but with regular HPLC column rather than nano column. A HALO Penta-HILIC column (2.1 × 150 mm, 5 μm particle size) was used. Mobile phases A and B were 10 mM ammonium formate in water (pH 6.5) and 98% ACN containing 0.1% formic acid, respectively. Ten microliters of sample was injected at the initial gradient condition (80% mobile phase). The gradient was then ramped from 80 to 50% solvent B over 25 min with a total run time of 40 min. Glycans were eluted at 0.2 mL/min. The positive-ion mode was used for analysis. The MS detection range was set at 800–2000 m/z. The ESI spray and capillary voltages were set at 5 kV and 35 V, respectively, with the stainless steel capillary heated to 275°C. The glycan structures were further confirmed by CID MS/MS using the LTQ Orbitrap Velos. Precursor ions were selected in data-dependent acquisition mode. The glycans were permethylated prior to MS/MS analysis for better ionization of the fragments and preventing glycan rearrangement in the gas phase. In order to isomerically separate permethylated glycans, a PGC column (HyperCarb, 10 μm × 100 mm, 5 μm particle size) was utilized in LC–MS/MS analysis.
2.9 Data analysis of glycans
Theoretical structures and m/z values of derivatized glycans were generated by GlycoWorkbench Software developed by the EUROCarbDB. The experimental value was used to confirm the results. The identified glycans were quantified manually with Xcalibur Qual Browser 2.1 (Thermo Fisher Scientific) using the peak area from the extracted ion chromatogram (XIC) with the following settings: (i) peaks were extracted with a 1 Da (±0.5 Da) mass window, (ii) scan filter was set as full MS, and (iii) genesis peak detection algorithm was used. Nomenclature of glycan is used according to Essentials of Glycobiology [21] and the abbreviations are used according to NIBRT GlycoBase.
3 Results and discussion
There are two different types of fucosylation structures of N-linked glycoprotein, which have been of interest in biomarker studies, i.e. core fucosylation and antennary fucosylation. It is often difficult to distinguish the two structures using direct ESI–MS/MS due to the low fragmentation signals in MS/MS analysis for glycans. The glycosylation is also known to be site specific [16, 22]. We thus sought to develop a method to analyze site-specific fucosylation of a model protein A1AT (alpha-1-antitrypsin) to distinguish core fucosylation and antennary fucosylation structures at each glycosite. A work flow describing the methods used is shown in Fig. 1.
Figure 1.

Work-flow of the experiment for determining glycosylation of A1AT. The glycosylated A1AT was first digested into peptides, followed by glycan truncation by sialidase/galactosidase double digestion. The glycopeptides were fractionated using a HILIC column. PNGase F digestion was used for separate mass spectral analysis of glycans and peptides.
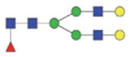
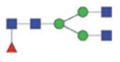
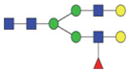
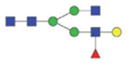
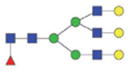
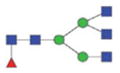
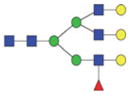
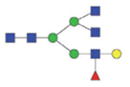
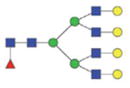
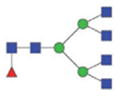
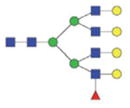
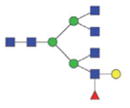
Sialidase releases α(2–3,6,8,9)-linked N-acetylneuraminic acid leaving galactose as the terminal of the N-glycan. Subsequently, β-galactosidase cleaves β (1–4,6)-linked galactose on condition that no fucose is bound to the subterminal N-acetylglucosamine in an N-glycan, thus providing a means to distinguish core fucosylation and antennary fucosylation (as illustrated in Fig. 2). The elongation of polylactosamine-type structure is not considered in this study. A previous study about the glycan structures of A1AT has shown that no polylactosamine-type structure has been found in human serum [23]. In our analysis, no obvious polylactosamine-type structure was detected. A list of sialidase or sialidase/galactosidase digested N-glycans are shown in Table 1 and the theoretical m/z is calculated using GlycoWorkbench. In order to further enhance the ionization efficiency of glycans for detection, a meladrazine derivatization reagent was used. In the Thermo LTQ ion trap instrument, the signal in the m/z range of 1000–2000 is more intense than the lower or the higher mass ranges. The m/z within this range is indicated in bold. As shown in Table 1 the core-fucosylated glycan and the antennary-fucosylated glycan have the same m/z in sialidase digested sample while the two have different m/z in the sialidase/galactosidase double-digested sample. Therefore with sialidase/galactosidase double digestion the two types of fucosylation are readily distinguished without further MS/MS analysis or extensive sequential exoglycosidase digestion [24].
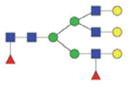
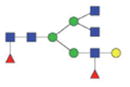
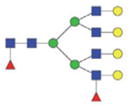
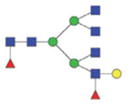
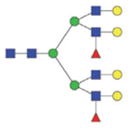
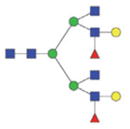
Figure 2.

Schematic of digestion by galactosidase which illustrates that digestion occurs for core fucosylation but not antennary fucosylation.
Table 1.
The list of sialidase or sialidase/galactosidase digested N-glycans and their theoretical m/z
| Glycan type | Digest with sialidase
|
Digest with sialidase/galactosidase
|
||
|---|---|---|---|---|
| [M-T3+H]+ or [M-T3+2H+H2O]2+ | Structure | [M-T3+H]+ or [M-T3+2H+H2O]2+ | Structure | |
| Single fuco biantennary | 2022.86/1020.93 |
|
1698.75/858.88 |
|
|
1860.81/939.91 |
|
||
| Single fuco tri-antennary | 2387.99/1203.49 |
|
1901.83/960.42 |
|
|
2063.89/1041.45 |
|
||
| Double fuco tri-antennary | 2534.05/1276.52 |
|
2209.95/1114.48 |
|
|
2372.01/1195.51 |
|
||
| Single fuco tetra-antennary | 2753.12/1386.06 |
|
2104.93/1061.97 |
|
|
2266.97/1142.99 |
|
||
| Double fuco tetra-antennary | 2899.18/1459.09 |
|
2413.02/1216.01 |
|
|
2575.09/1297.05 |
|
||
The m/z within 1000–2000 mass range is indicated in bold. Blue square: GlcNAc; green circle: mannose; yellow circle: galactose; red triangle: fucose.
Further MS/MS analysis and fucosidase digestion analysis were also performed to confirm this result. The MS/MS data are shown in Supporting Information. The MS/MS spectra of core-fucosylated and antennary-fucosylated bi-antennary and tri-antennary glycans are shown in Supporting Information Fig. 1. It could be clearly seen that galactosidase was not able to cut the galactose off if an antennary fucosylation was formed, leaving both galactose and fucose on the glycan; whereas the fucosylation that formed at the core position does not have galactose left after galactosidase digestion. At the same time, this was also confirmed by fucosidase digestion analysis. The XIC of tri-antennary glycans, either core fucosylated or antennary fucosylated were extracted after various fucosidase digestions, as shown in Supporting Information Fig. 2. After core fucosidase α1-2,3,4,6 fucosidase digestion (which cuts core fucosylation more efficiently than antennary fucosylation), the peak of core-fucosylated tri-antennary glycan (FA3) fully disappeared and some of the antennary-fucosylated tri-antennary glycan (A3FG) also disappeared with the appearance of its product glycan (A3G). After antennary fucosidase (α1-2 fucosidase and α1-3,4 fu-cosidase) digestion, the peak of FA3 did not change whereas most of A3FG disappeared with the appearance of A3G. This result confirmed the results from our method.
In this study, A1AT was used as the model protein. The tri-antennary glycan of A1AT was used as an example as shown in Fig. 3. Two aliquots of 10 μg A1AT were digested with a single sialidase or with sialidase/galactosidase double digestion in parallel for comparison. The base peak of the theoretical m/z of a glycan was extracted manually using Xcalibur. With a single sialidase digestion, one peak with m/z 1203.49 (FA3G3 or A3FG3, the abbreviations of glycan structure are used according to NIBRT GlycoBase) was found, indicating there is one fucose attached to the tri-antennary glycan, but it is unknown whether it is core fucosylation or antennary fucosylation. With sialidase/galactosidase, the peak with m/z 1203.49 disappeared, and a minor peak with m/z 1901.83 (FA3) and a major peak with m/z 1041.45 (A3FG) were observed, indicating A1AT contains both a core-fucosylated tri-antennary glycan at lower abundance and an antennary-fucosylated tri-antennary glycan at higher abundance. The completeness of galactosidase digestion is verified by extracting the XIC of the half-digested glycan structure with m/z at 1113.48 (FA3G2 or A3FG2). It can be seen clearly that there is no half-digested glycan structure so that galactosidase digestion is complete.
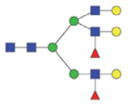
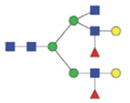
Figure 3.

The fucosylation structure of fucosylated tri-antennary glycan treated by sialidase digestion (A) cannot be distinguished, whereas with sialidase/galactosidase double digestion (B) the core-fucosylated tri-antennary glycan with m/z at 1901.83 (FA3) elutes earlier than antennary fucosylated tri-antennary glycan with m/z at 1041.45 (A3FG). The completeness of galactosidase digestion is verified by extracting the XIC of the half-digested glycan structure with m/z at 1113.48 (FA3G2 or A3FG2).
Analysis of A1AT showed that there are 12 different gly-can structures after sialidase/galactosidase double digestion as shown in Table 2. The retention time of a core-fucosylated glycan is around 30 s longer than its corresponding non-fucosylated glycan; while the antennary-fucosylated glycan is around 100 s longer than its corresponding nonfucosylated glycan, indicating that the addition of one core fucose enhanced the hydrophilicity of the glycopeptides and the addition of an antennary fucose and a galactose enhanced its hydrophilicity further. The nonfucosylated bi-antennary and tri-antennary glycans are the top two most abundant glycan structures of A1AT, comprising 35.8 and 25.2%, respectively. Both core and antennary fucosylation were found, with overall antennary fucosylation levels much higher than core fucosylation levels. In a classical lectin blot assay, one study has found that the upregulation of core fucosylated but not antennary fucosylated A1AT could be indicative for hepatocellular cancer diagnosis [9]. The procedure developed in this study would enable the precise identification and quantification of core and antennary fucosylation of A1AT.
Table 2.
Summary of truncated N-glycans identified in A1AT, including m/z, retention time, and % relative peak area
| Glycan structure | [M-T3+H]+ or [M-T3+2H+H2O]2+ | Retention time | %Relative peak area |
|---|---|---|---|
| A2 | 1552.7 | 7.72 | 35.8 |
| FA2 | 1698.8 | 8.37 | 1.8 |
| A2FG | 1860.8 | 9.66 | 0.5 |
| A3 | 1755.8 | 8.43 | 25.2 |
| FA3 | 1901.8 | 8.99 | 0.7 |
| A3FG | 1041.5 | 10.2 | 11.3 |
| A4 | 1958.8 | 9.24 | 7.0 |
| A4FG | 1142.9 | 10.92 | 13.6 |
| A3F2G2 | 1195.5 | 11.74 | 0.4 |
| FA3FG | 1114.5 | 10.69 | 0.1 |
| A4F2G2 | 1297.0 | 12.05 | 3.6 |
| FA4FG | 1215.3 | 11.36 | 0.1 |
It is not known yet which site has core fucosylation or antennary fucosylation and the relative amount of the two fucosylations at each glycosite. A1AT has three theoretical N-glycosylation sites, all of which are detectable with trypsin digestion: sites 70, 107, and 271. In order to determine the site specificity and the fucosylation type of each site, A1AT was first digested with trypsin, followed by sialidase/galactosidase double digestion. The A1AT glycopeptide mixture was then fractionated with an HILIC column into 30 fractions prior to PNGase F digestion. Each fraction was divided into two equal parts. One set of all the fractions was used for peptide identification, and the other set was used for further glycan identification. The peptide of each fraction was identified by LC–MS/MS and was quantified by #PSMs (the number of peptide spectrum matches) from ProteomeDiscoverer1.2 search engine. With PNGase F digestion, previously glycosylated peptides are deamidated showing +1 Da dynamic modification at the site of asparagines whereas the nonglycosylated peptides do not have this modification. The aim of HILIC separation is to separate different peptides rather than a quantitative comparison of glycosylated and nonglycosylated peptides. Considering the chemical deamidation rate is less than 7% [25], where our experiment showed that the amount of deamidated peptides was about twice the amount of nondeamidated peptides, chemical deamidation was not specifically differentiated with glycosylated peptides. Most of these deamidated peptides in the fraction were from glycosylated peptides rather than chemical deamidation.
All fractions have been checked by LC–MS/MS. The result showed that the glycopeptides with truncated glycans were found in the same fraction as nonglycopeptides, where the fraction was collected at every 2 min (Fig. 4). The nonglycosylated peptides may not elute at the same retention time as glycosylated peptides but the two eluted at similar retention time and in the same fraction with the Xbridge HILIC column in our experimental system. Therefore, the glycan structures of one site can be identified in sequential fractions. Three fractions F17 (fraction 17), F20, and F26 have maximum #PSMs of three glycopeptides of A1AT. As shown in Table 3, F17 mainly contains the glycopeptide YLGnATAIF-FLPDEGK with site 271; F20 mainly contains the glycopeptide ADTHDEILEGLNFnLTEIPEAQIHEGFQELLR with site 107; F26 mainly contains the glycopeptide QLAHQSnSTNIFF-SPVSIATAFAMLSLGTK with site 70. The MS/MS spectrum of one of the identified peptides of A1AT with glycosylation site 271, YLGnATAIFFLPDEGK (the deamidated asparagine is indicated by lower case) is shown in Supporting Information Fig. 3. The glycan structures of the three fractions were further analyzed with LC–MS. The glycan was first extracted by PGC tips following PNGase F digestion and derivatized with T3-labeling reagent. Three glycan structures were identified in F17, including A2, FA2, and A3 (Fig. 5A). Five glycan structures were identified in F20, including A2, A3, A4, A3FG, A4FG (Fig. 5B). No glycans were identified in F26, where within the limits of our current experiments no glycans were observed for site 70. The mass spectra of glycans are shown in Supporting Information Fig. 4.
Figure 4.

The #PSMs of identified glycosylated peptides or nonglycosylated peptides in fractions of HILIC fractionation. Deamidated peptides after PNGase digestion are considered glycosylated peptides, whereas nonglycosylated peptides are not deamidated. Chemical deamidated peptides were not differentiated due to their low percentile. “site70_deamidated,” “site107_deamidated,” and “site 271_deamidated” indicate glycosylated peptides with glycosylation sites 70, 107, and 271, respectively, “site 70,” “site 107,” and “site 271” indicate the corresponding nonglycosylated peptides.
Table 3.
The peptide identified in fractions of HILIC column fractionation
| Fraction no. | Site | Peptide |
|---|---|---|
| F26 | site 70 | QLAHQSnSTNIFFSPVSIATAFAMLSLGTK |
| F20 | site 107 | ADTHDEILEGLNFnLTEIPEAQIHEGFQELLR |
| F17 | site 271 | YLGnATAIFFLPDEGK |
The glycosylation site is indicated by lower case.
Figure 5.

LC–MS analysis of glycans in F17 (A) and F20 (B) from HILIC column fractionation. F17 contains A2, FA2, and A3; F20 contains A2, A3, A3FG, A4, and A4FG. No glycan structure was detected in F26.
4 Concluding remarks
We have developed a work flow to study the glycosylation of A1AT to identify the presence of core versus antennary fucosylation. This was performed on a standard A1AT protein that was digested by trypsin followed by sialidase/galactosidase digestion. Galactosidase removes terminal galactose residues in an N-glycan but does not cut when the subterminal N-acetylglucosamine is modified by fucosylation, thus providing a means to distinguish core fucosylation and antennary fucosylation. The resulting peptides were separated by HILIC separation and collected into 30 fractions. For each fraction the glycans were released using PNGase F digestion. The glycans could then be extracted and analyzed using meladrazine T3 labeling reagent and HILIC–LC/MS where glycans with core or antennary fucosylation could be identified via MS. In addition, the site of glycosylation could be studied via C18 extraction of the peptides followed by LC–MS/MS analysis. We identified 12 different glycans at two different glycosites in A1AT following sialidase/galactosidase digestion that clearly showed the presence of core versus antennary fucosylation. In future work, this methodology will be used to study changes in serum A1AT glycosylation during the progression of various cancers.
Supplementary Material
Acknowledgments
This work was funded by the National Cancer Institute under grant R01 CA160254 (D.M.L.) and received partial support from the National Cancer Institute under grant R01CA154455 (D.M.L.) and from the National Institutes of Health through grant R01 GM 49500 (D.M.L.) and grant 1R01GM112490-02 (Y.M.).
Abbreviations
- A1AT
alpha-1-antitrypsin
- CID
collision ionization dissociation
- HILIC
hydrophilic interaction liquid chromatography
- HPLC
high-pressure liquid chromatography
- PGC
porous graphitized carbon tips
- XIC
extracted ion chromatogram
Footnotes
The authors have declared no conflicts of interest.
Additional supporting information may be found in the online version of this article at the publisher’s web-site
References
- 1.Lau KS, Dennis JW. Glycobiology. 2008;18:750–760. doi: 10.1093/glycob/cwn071. [DOI] [PubMed] [Google Scholar]
- 2.Drake RR. Adv Cancer Res. 2015;126:1–10. doi: 10.1016/bs.acr.2014.12.002. [DOI] [PubMed] [Google Scholar]
- 3.Pompach P, Brnakova Z, Sanda M, Wu J, Edwards N, Goldman R. Mol Cell Proteomics. 2013;12:1281–1293. doi: 10.1074/mcp.M112.023259. [DOI] [PMC free article] [PubMed] [Google Scholar]
- 4.Okuyama N, Ide Y, Nakano M, Nakagawa T, Yamanaka K, Moriwaki K, Murata K, Ohigashi H, Yokoyama S, Eguchi H, Ishikawa O, Ito T, Kato M, Kasahara A, Kawano S, Gu J, Taniguchi N, Miyoshi E. Int J Cancer. 2006;118:2803–2808. doi: 10.1002/ijc.21728. [DOI] [PubMed] [Google Scholar]
- 5.Liang Y, Ma T, Thakur A, Yu H, Gao L, Shi P, Li X, Ren H, Jia L, Zhang S, Li Z, Chen M. Glycobiology. 2015;25:331–340. doi: 10.1093/glycob/cwu115. [DOI] [PubMed] [Google Scholar]
- 6.Jiang K, Shang S, Li W, Guo K, Qin X, Zhang S, Liu Y. Glycoconjugate J. 2015;32:657–664. doi: 10.1007/s10719-015-9614-6. [DOI] [PubMed] [Google Scholar]
- 7.Haab BB. Proteomics Clin Appl. 2012;6:346–350. doi: 10.1002/prca.201200014. [DOI] [PMC free article] [PubMed] [Google Scholar]
- 8.Wu J, Xie X, Liu Y, He J, Benitez R, Buckanovich RJ, Lubman DM. J Proteome Res. 2012;11:4541–4552. doi: 10.1021/pr300330z. [DOI] [PubMed] [Google Scholar]
- 9.Comunale MA, Rodemich-Betesh L, Hafner J, Wang M, Norton P, Di Bisceglie AM, Block T, Mehta A. PloS One. 2010;5:e12419. doi: 10.1371/journal.pone.0012419. [DOI] [PMC free article] [PubMed] [Google Scholar]
- 10.Zhu J, Lin Z, Wu J, Yin H, Dai J, Feng Z, Marrero J, Lubman DM. J Proteome Res. 2014;13:2986–2997. doi: 10.1021/pr500128t. [DOI] [PMC free article] [PubMed] [Google Scholar]
- 11.Tian Y, Zhang H. Proteomics Clin Appl. 2010;4:124–132. doi: 10.1002/prca.200900161. [DOI] [PubMed] [Google Scholar]
- 12.Nie S, Lo A, Wu J, Zhu J, Tan Z, Simeone DM, Anderson MA, Shedden KA, Ruffin MT, Lubman DM. J Proteome Res. 2014;13:1873–1884. doi: 10.1021/pr400967x. [DOI] [PMC free article] [PubMed] [Google Scholar]
- 13.Froehlich JW, Barboza M, Chu C, Lerno LA, Jr, Clowers BH, Zivkovic AM, German JB, Lebrilla CB. Anal Chem. 2011;83:5541–5547. doi: 10.1021/ac2003888. [DOI] [PubMed] [Google Scholar]
- 14.Chandler KB, Pompach P, Goldman R, Edwards N. J Proteome Res. 2013;12:3652–3666. doi: 10.1021/pr400196s. [DOI] [PMC free article] [PubMed] [Google Scholar]
- 15.Wu Y, Mechref Y, Klouckova I, Mayampurath A, Novotny MV, Tang H. Rapid Commun Mass Spectrom. 2010;24:965–972. doi: 10.1002/rcm.4474. [DOI] [PubMed] [Google Scholar]
- 16.Yin H, Lin Z, Nie S, Wu J, Tan Z, Zhu J, Dai J, Feng Z, Marrero J, Lubman DM. J Proteome Res. 2014;13:2887–2896. doi: 10.1021/pr500043k. [DOI] [PMC free article] [PubMed] [Google Scholar]
- 17.Yin H, Tan Z, Wu J, Zhu J, Shedden KA, Marrero J, Lubman DM. J Proteome Res. 2015;14:4876–4884. doi: 10.1021/acs.jproteome.5b00718. [DOI] [PMC free article] [PubMed] [Google Scholar]
- 18.Varadi C, Mittermayr S, Szekrenyes A, Kadas J, Takacs L, Kurucz I, Guttman A. Electrophoresis. 2013;34:2287–2294. doi: 10.1002/elps.201300041. [DOI] [PubMed] [Google Scholar]
- 19.Zhang Y, Zhu J, Yin H, Marrero J, Zhang XX, Lubman DM. J Proteome Res. 2015;14:5388–5395. doi: 10.1021/acs.jproteome.5b00792. [DOI] [PMC free article] [PubMed] [Google Scholar]
- 20.Tie C, Zhang XX. Anal Methods. 2012;4:357–359. [Google Scholar]
- 21.Varki A, Cummings DR, Esko DJ, Freeze HH, Stanley P, Bertozzi RC, Hart WG, Etzler EM. Essentials of Glycobiology. Cold Spring Harbor Laboratory Press; New York: 2008. [PubMed] [Google Scholar]
- 22.Pompach P, Ashline DJ, Brnakova Z, Benicky J, Sanda M, Goldman R. J Proteome Res. 2014;13:5561–5569. doi: 10.1021/pr5005482. [DOI] [PMC free article] [PubMed] [Google Scholar]
- 23.McCarthy C, Saldova R, O’Brien ME, Bergin DA, Carroll TP, Keenan J, Meleady P, Henry M, Clynes M, Rudd PM, Reeves EP, McElvaney NG. J Proteome Res. 2014;13:596–605. doi: 10.1021/pr400752t. [DOI] [PubMed] [Google Scholar]
- 24.Guttman A. Electrophoresis. 1997;18:1136–1141. doi: 10.1002/elps.1150180719. [DOI] [PubMed] [Google Scholar]
- 25.Zielinska DF, Gnad F, Wisniewski JR, Mann M. Cell. 2010;141:897–907. doi: 10.1016/j.cell.2010.04.012. [DOI] [PubMed] [Google Scholar]
Associated Data
This section collects any data citations, data availability statements, or supplementary materials included in this article.