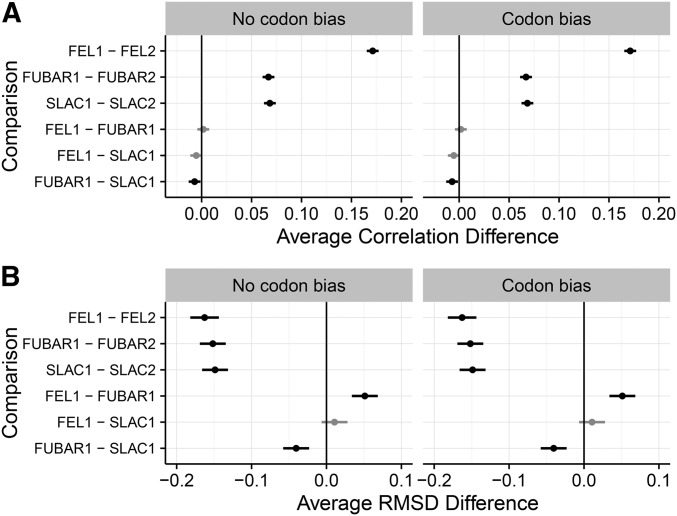
Figure 2.
Pairwise comparisons of correlation strength, RMSD, and variance in residual across methods, determined through multiple-comparisons tests, for simulations. (A) Results for multiple-comparison tests of correlation strength. (B) Results for multiple-comparison tests of RMSD. Points indicate the estimated average difference between measurements for the respective inference approaches, and lines indicate 95% confidence intervals. Solid lines indicate that the performance difference between methods differed significantly from 0 (all ). Shaded lines indicate that the difference was not statically significant (). All P-values were corrected for multiple testing. Corresponding multiple-comparison results for simulations are in Figure S5.

