Figure 5.
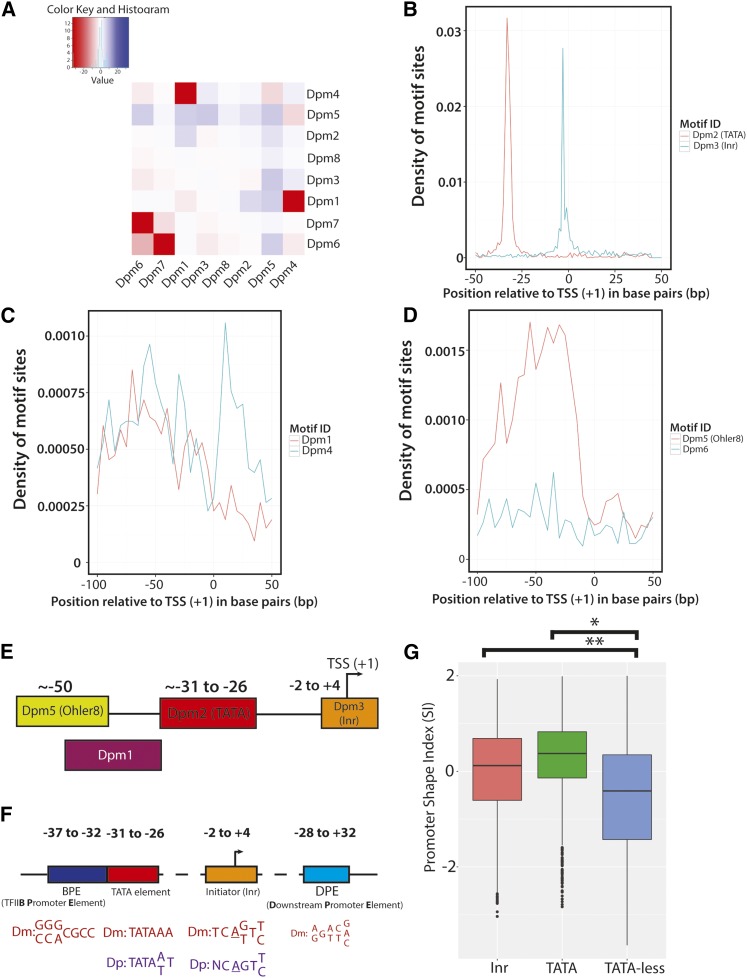
The cooccurrence and distribution of identified D. pulex core promoter motifs within promoter regions. (A) Heatmap of cooccurrence frequencies among identified D. pulex motifs. The log of each P-value is plotted within the heatmap. The frequency distributions of Dpm2 and Dpm3 (B), Dpm1 and Dpm4 (C), and Dpm5 and Dpm6 (D) relative to identified promoters (TSRs) are shown (the distributions of Dpm7 and Dpm8 are not shown). (E) Current model of core promoter composition in D. pulex derived from the evidence in this study. A cartoon illustration of the Daphnia core promoter motifs that exhibit strong positional distributions are shown, with their approximate locations relative to the TSS (+1). (F) Model representing the positions and consensus sequences of canonical core promoter elements between D. pulex and D. melanogaster. The four major core promoter elements in D. melanogaster are displayed, along with their typical positions relative to the TSS (+1). The consensus sequence of each element, if present, is shown for D. melanogaster (Dm; red) and D. pulex (Dp; purple). Note that an individual core promoter may have none, all, or some of the elements listed in the illustration. Graphic adapted from (Butler and Kadonaga 2002). (G) Comparison of promoter shape between TATA- and Inr-containing promoters and those lacking TATA. The box-and-whisker plots representing the distributions of calculated SI values for consensus promoters with Inr (coral), TATA (green), and those lacking TATA (blue) are shown. Inr- (**) and TATA-containing (*) consensus promoters possess a significantly more peaked shape (P < 0.001) than TATA-less promoters. Dpm, Daphnia (core) promoter motif; Inr, Initiator; SI, Shape Index; TSR, transcription start region; TSS, transcription start site.

