

Abstract
Background/aims
Leukodystrophies due to abnormal production of myelin cause extensive morbidity in early life; their genetic background is still largely unknown. We aimed at reaching a molecular diagnosis in Ashkenazi-Jewish patients who suffered from developmental regression at 6–13 months, leukodystrophy and peripheral neuropathy.
Methods
Exome analysis, determination of alkaline ceramidase activity catalysing the conversion of C18:1-ceramide to sphingosine and D-ribo-C12-N-(7-nitrobenz-2-oxa-1,3-diazol-4-yl) (NBD)-phytoceramide to NBD-C12-fatty acid using liquid chromatography-tandem mass spectrometry (LC-MS/MS) and thin layer chromatography, respectively, and sphingolipid analysis in patients’ blood by LC-MS/MS.
Results
The patients were homozygous for p.E33G in the ACER3, which encodes a C18:1-alkaline ceramidase and C20:1-alkaline ceramidase. The mutation abolished ACER3 catalytic activity in the patients’ cells and failed to restore alkaline ceramidase activity in yeast mutant strain. The levels of ACER3 substrates, C18:1-ceramides and dihydroceramides and C20:1-ceramides and dihydroceramides and other long-chain ceramides and dihydroceramides were markedly increased in the patients’ plasma, along with that of complex sphingolipids, including monohexosylceramides and lactosylceramides.
Conclusions
Homozygosity for the p.E33G mutation in the ACER3 gene results in inactivation of ACER3, leading to the accumulation of various sphingolipids in blood and probably in brain, likely accounting for this new form of childhood leukodystrophy.
INTRODUCTION
Leukodystrophies are genetic disorders of myelin production or maintenance affecting the central nervous system. Their incidence is estimated at 1 in 7663 births.1 Signs and symptoms of leukodystrophies, though protean, reflect involvement of myelinated tracts and may include both pyramidal and extrapyramidal motor impairments, ataxia and late cognitive impairment. Diagnosis requires demonstration of abnormal white matter on brain imaging2 where several patterns may guide the clinician towards an informed genetic differential diagnosis. Despite the identification of a number of disease-causing genes, many patients with leukodystrophy still do not receive a firm molecular diagnosis. As part of our efforts to delineate the molecular basis of novel white matter disorders among consanguineous families using exome analysis, we now report the identification of a novel leukodystrophy gene in two siblings from a consanguineous Ashkenazi-Jewish family.
PATIENTS
Patient II-2, a female, and patient II-3, a male, are the second and third out of five children to remotely consanguineous parents of Ashkenazi-Jewish origin (figure 1A). Both children shared uneventful pregnancies, deliveries and perinatal course. Initial normal motor and language development was followed by stagnation and regression between 6 and 13 months of age, eventually rendering the children unable to communicate and lacking purposeful movement. The peak gross motor performance consisted of turning from prone to supine; expressive language peaked at 5–10 words. Examination was abnormal from their initial assessment at 9 months of age when truncal hypotonia, appendicular spasticity despite areflexia and dystonia were apparent. Other salient features were pale optic discs despite apparently normal vision and neurogenic bladder in both. Head circumference for individual II-2 was at the 50th centile at 10–17 months (44.5–46.2 cm) and at the 25th centile (47 cm) at 3 years 6 months. Head circumference for individual II-3 was at the 75th centile (47.2–48.5 cm) at 12–18 months. Currently aged 13 and 11 years, both patients are neurologically severely impaired with multiple contractures, late-onset relative macrocephaly (56.5 cm in both), short stature (140 and 118 cm, respectively), coarse facial features, sloping forehead, thick eye brows, low-set ears, prominent nose, relatively flat philtrum and prominent lower lip (figure 2A–C). Both require mechanical ventilation and feeding gastrostomies. Both parents are normocephalic. Mother’s head circumference is 55 cm; father’s head circumference is 56 cm.
Figure 1.
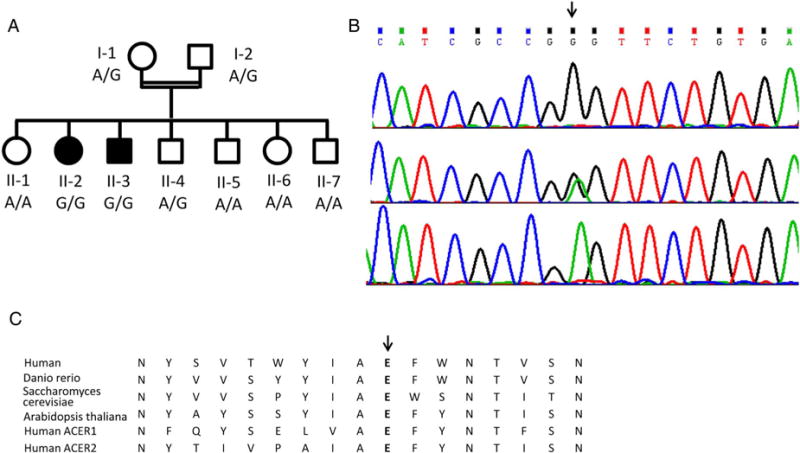
Family pedigree and the c.A98G, p.Glu33Gly mutation in the ACER3 gene. (A) Family pedigree and mutation genotype; filled symbols represent affected individuals. (B) The mutation (arrow) in patient II-2 (upper), the mother I-1 (middle) and the healthy sister II-6 (lower chromatogram). (C) Conservation of the Glu33 residue throughout evolution and among alkaline ceramidase proteins.
Figure 2.
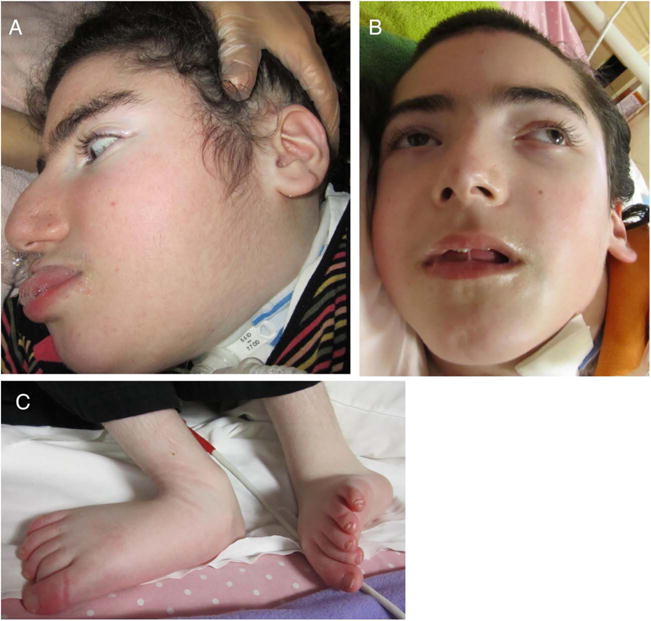
Dysmorphic features of patients with ACER3 deficiency. Coarse facial features, sloping forehead, thick eye brows, prominent nose and prominent lower lip are shown in patient II-2 (A) and II-3 (B) as well as lower limb contractures (C).
Patient II-2 underwent extensive investigation, which was positive for slightly increased plasma lactate level 3.1 mM (N<2.2). Repeated EEG disclosed generalised slowing but no epileptic activity. Brain MRI was normal at 1 and 2 years, but at 7 years disclosed diffuse abnormal white matter signal and severe atrophy (figure 3A–D). Brain magnetic resonance spectroscopy (MRS) revealed decreased n-acetyl aspartate (NAA) with normal choline and no excess of lactate. Sural nerve biopsy at 7 years showed a decrease in myelinated fibres. Chromosomal microarray analysis was performed on DNA from patient II-3 using the Affymetrix CytoScan 750K and was found to be normal [arr(1–22)x2,(XY)x1)].
Figure 3.
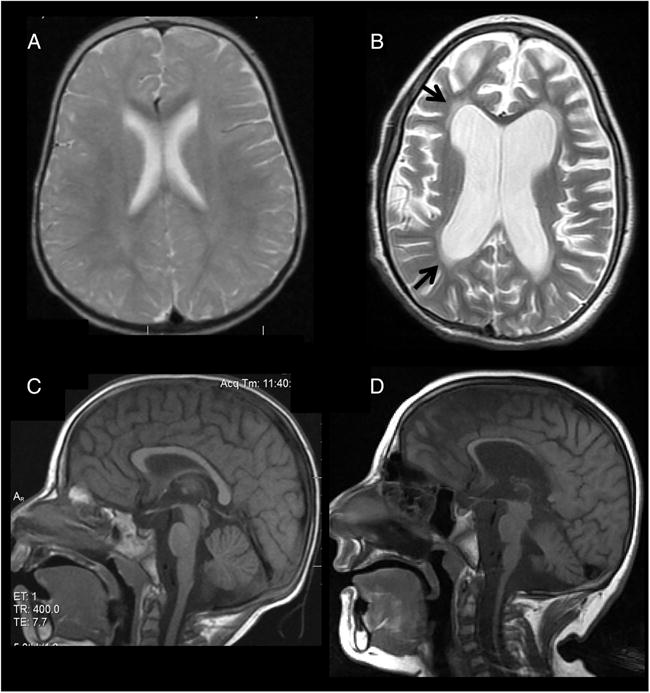
Brain MRI of patient II-2 (A and B axial proton-density and T2-weighted images, respectively; C and D midsagittal T1-weighted images, respectively). Normal study is shown at age 1 year (A) and 2 years (C). At 7 years (B and D), there is diffuse supratentorial and infratentorial atrophy with thinning of the corpus callosum (D) and increased diffuse white matter signal (arrows) (B) consistent with progressive leukodystrophy.
MATERIALS AND METHODS
Whole exome analysis
Exonic sequences were enriched in the DNA sample of patient II-3 (detailed in the online supplementary file). Parental consent was given for DNA studies.
Carrier rate determination was performed among 934 anonymous Ashkenazi-Jewish adults using TaqMan RT-PCR (detailed in the online supplementary file).
Site-directed mutagenesis
The codon of Glu33 (E33) in the ACER3 open reading frame (ORF) in the yeast expression plasmid pYES2-ACER3 was switched to Gly codon using QuickChange II XL Site-Directed Mutagenesis Kit (Agilent Technology; Danbury, Connecticut, USA) (detailed in the online supplementary file).
Protein expression in yeast cells
Cells of the Saccharomyces cerevisiae mutant strain Δypc1Δydc1, in which both yeast alkaline ceramidase genes YPC1 and YDC1 were deleted,3 were transformed with pYES2-ACER3, pYES2-ACER3E33G and the empty vector (pYES2-EV), respectively. The resulting transformants were grown in 2% galactose medium to induce ACER3 expression (detailed in the online supplementary file). Total membranes were prepared from yeast cells, and the expression of ACER3 or ACER3E33G mutant was determined by western blot analyses using anti-FLAG antibody as described.4
Alkaline ceramidase activity assays
Alkaline ceramidase activity was determined using D-ribo-C12-NBD-phytoceramide (NBD-C12-PHC) as a substrate and quantitation of the product NBD-C12-fatty acid (NBD-C12-FA) by thin layer chromatography method5 or using regular ceramide (C18:1-ceramide) as a substrate and quantitation of sphingosine (SPH) as a product by liquid chromatography-tandem mass spectrometry (LC-MS/MS)6 (detailed in the online supplementary file).
Sphingolipid analysis by LC-MS/MS
Blood samples were collected from the two patients and from an unrelated healthy control and lipids were extracted using ethyl acetate/isopropanol extraction buffer (detailed in the online supplementary file). Sphingolipids were determined by LC-MS/MS performed on a TSQ 7000 triple quadruple mass spectrometer (Thermo Finnigan; Ringoes, New Jersey, USA) as described in.6 The amount of sphingolipids in each sample was normalised to phosphates.
RESULTS
The exome analyses of the DNA of patient II-3 yielded 58.8 million confidently mapped reads (mean coverage X81). Following variant filtering, four homozygous variants remained (filtering detailed in the online supplementary file and supplementary table S1); however, only one of them, Chr11:76572118 A>G, NM_001300953:c.A98G, p.Glu33Gly (E33G) in the ACER3 gene segregated with the disease in the family (figure 1A, B). The variant was not carried by any of the ~9000 individuals, whose exome analyses included this gene (ExAC, accessed May 2015). Of 934 anonymous Ashkenazi-Jewish adults, only one carried the mutation.
ACER3 encodes an alkaline ceramidase, which catalyses the hydrolysis of several unsaturated long chain (ULC), D-e-C18:1, C20:1-ceramides or C20:4-ceramides (ULC-cer) and is as efficient towards ULC dihydroceramides or phytoceramides as towards their ceramide counterparts.4 To determine if the p.E33G mutation affected ACER3 enzymatic activity, we measured alkaline ceramidase activity on the ceramide analogue NBD-C12-PHC, a preferred synthetic substrate of ACER3,4,5 and on the ULC-cer D-e-C18:1-ceramide (18:1-Cer), a preferred natural substrate of ACER3, in skin fibroblasts and lymphoblasts of the patients and two unrelated healthy controls. We found that alkaline ceramidase activity on both NBD-C12-PHC and C18:1-cer was readily detected in fibroblasts and lymphoblasts from the healthy individuals but was undetectable in cells of the patients (figure 4A–F), suggesting that the p.E33G mutation may inactivate the catalytic function of ACER3.
Figure 4.
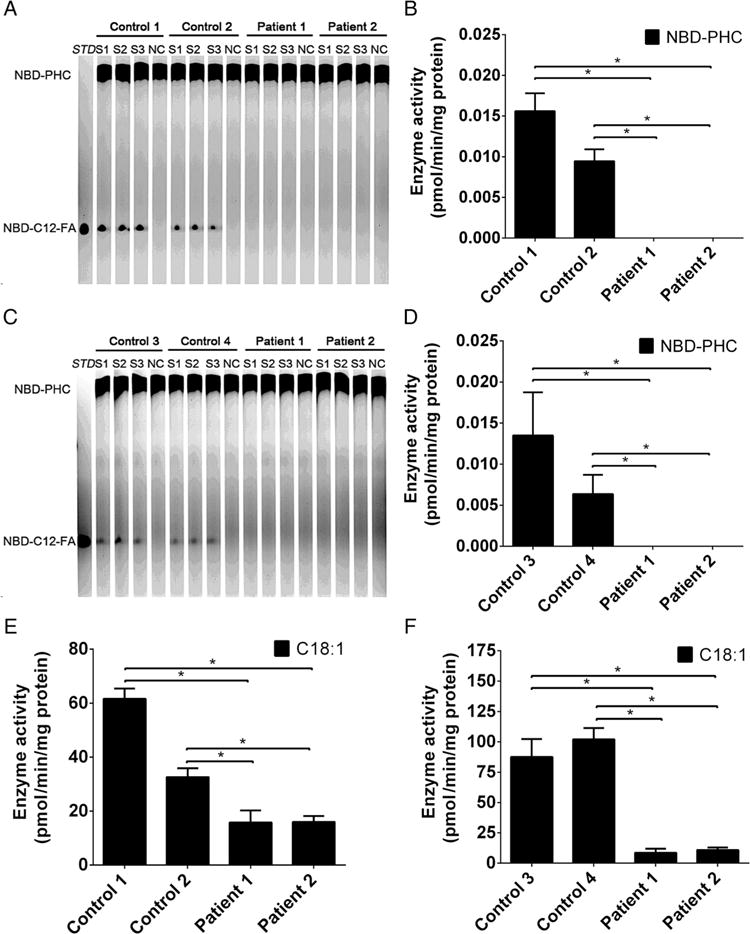
ACER3activity is abolished in patients’ cells by the p.E33G mutation (A–F). Total membranes were isolated from skin fibroblasts (A, B and E) and lymphoblasts (C, D and F) from healthy individuals (Control 1, Control 2, Control 3 and Control 4) or from the patients (Patient 1 and Patient 2) and were subjected to alkaline ceramidase activity assays using either NBD-C12-phytoceramide (NBD-C12-PHC) (A, B, C and D) or C18:1-ceramide (E and F) as a substrate. The release of the fluorescent product NBD-C12-fatty acid (NBD-C12-FA) from the substrate NBD-C12-PHC was detected by thin layer chromatography (A and C) and quantified by densitometry (B and D). The release of sphingosine from C18:1 (E and F) was determined by HPLC/MS. Data represent mean values±SD, n=3. *p<0.05.
For further verification, we determined alkaline ceramidase activity following overexpression of WT-ACER3 and E33G-ACER3 in the yeast mutant strain (Δypc1Δydc1) in which the endogenous alkaline ceramidase was completely absent. Overexpression of WT-ACER3, but not E33G-ACER3, increased alkaline ceramidase activity on NBD-C12-PHC (figure 5A, B) or C18:1-cer (figure 5C) although their expression levels were similar (figure 5D), confirming that the p.E33G mutation inactivates the catalytic function of ACER3.
Figure 5.
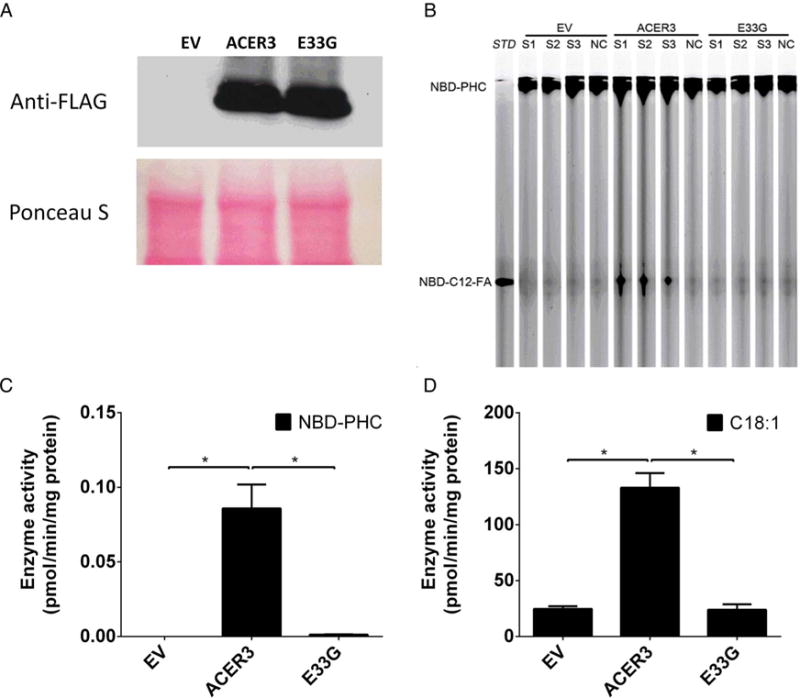
ACER3 activity is abolished in yeast cells by the p. E33G mutation (A–D). Yeast cells transformed with an empty vector (EV) and yeast cells expressing the FLAG-tagged ACER3 or its mutant, E33G, were homogenised in a lysis buffer as described in our previous study.3 The lysates were centrifuged at 1000g to pellet nuclei and unbroken cells and the resulting supernatants were centrifuged at 100 000g to pellet the membrane fractions, which were subjected to western blot analyses using anti-FLAG antibody following the protocol of the previous study5 or alkaline ceramidase activity assays using NBD-C12-phytoceramide (NBD-C12-PHC) (B and C) or C18:1-ceramide (D) as a substrate. The release of the fluorescent product NBD-C12-fatty acid (NBD-C12-FA) from the substrate NBD-C12-PHC was detected by thin layer chromatography (B) and quantified by densitometry (C). The release of sphingosine from C18:1-ceramide (D) was determined by HPLC/MS. Data represent mean values±SD, n=3. *p<0.05.
To investigate how the p.E33G mutation affected ceramide metabolism (figure 6) in the patients, we determined sphingolipid levels in blood samples from the patients and from five healthy individuals. As expected, the two patients had higher levels of the ULC-cer (C18:1-ceramide and C20:1-ceramide) (figure 7A) and ULC dihydroceramides (C18:1-dihydroceramide and C20:1-ceramides) (figure 7B) in the blood compared with the healthy individual because these ceramide and dihydroceramide species are preferred substrates of ACER3. Unexpectedly, the patients also had higher levels of other ceramide (figure 7A) and dihydroceramide species (figure 7B) although these lipids do not appear to serve as substrates of ACER3. Consistent with the increase in the levels of ceramides, complex sphingolipids, including monohexosylceramides (figure 7C, G) and lactosylceramides (figure 7D, G), were also increased in the patients. However, there was no significant difference in the levels of most sphingomyelin species and the total amount of sphingomyelins between healthy controls and the patients (figure 7E, G). The levels of C24:0-and C22:0-sphingomyelins were even decreased in the patients (figure 7E). Finally, the patients had higher levels of the sphingoid bases, SPH and dihydrosphingosine (DHS) (figure 7F) and their phosphates, sphingosine-1-phosphate (S1P) and dihydrosphingosine-1-phosphate (DHS1P) (figure 7F) although the free sphingoid bases are ACER3’s products that were expected to be decreased by the ACER3 inactivation. Taken together, these results suggest that ACER3 inactivation increases the level of various sphingolipids in the blood of the patients.
Figure 6.
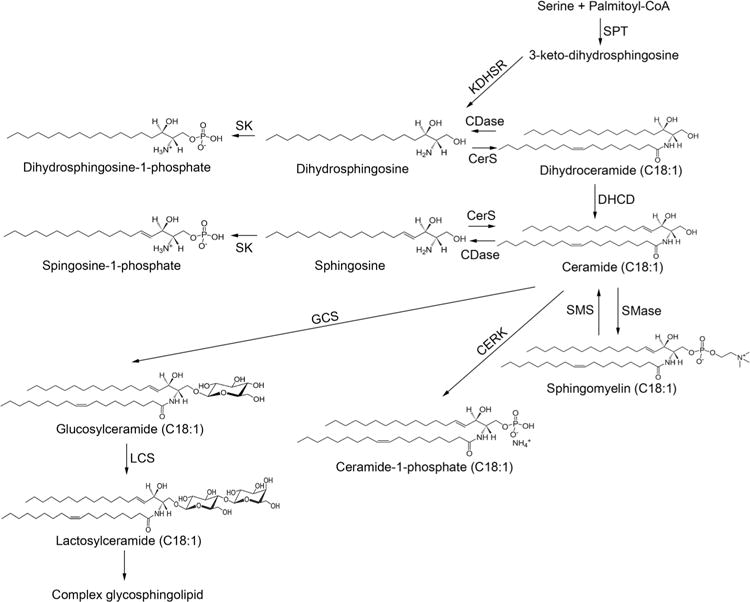
Sphingolipid metabolism ceramides, which are considered the central hub of sphingolipid metabolism, are synthesised via three different pathways (de novo biosynthesis, sphingomyelinase pathway and salvage pathway). They are then incorporated into various complex sphingolipids or broken down by ceramidases into sphingosine and dihydrosphingosine with subsequent production of sphingosine-1-phosphate and dihydrosphingosine-1-phosphate. CERK, ceramide kinase; CerS, ceramide synthase; DHCD, dihydroceramide desaturase; GCS, glucosylceramide synthase; KDHSR, 3-keto-dihydrosphingosine reductase; LCS, lactosylceramide synthase; SK, sphingosine kinase; SMase, sphingmyelinase; SMS, sphingomyelin synthase; SPT, serine palmitoyltransferase.
Figure 7.
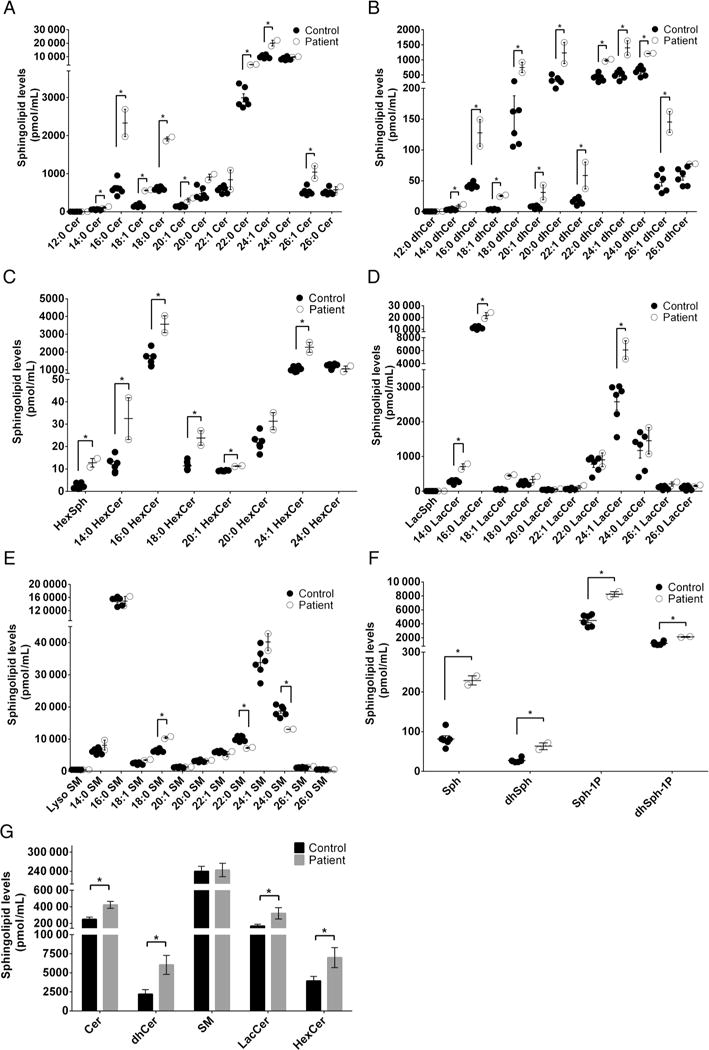
Sphingolipid profile in blood. Blood samples were collected from the five healthy individuals (Control) and the two patients (Patient). Each of the blood samples (100 μL) was subjected to liquid chromatography-tandem mass spectrometry (LC-MS/MS) for the levels of individual ceramides (A), individual dihydroceramides (B), individual monohexosylceramides (C), individual lactosylceramides (D), individual sphingomyelins (E), sphingoid bases and their phosphates (F) and total amount of each type of sphingolipids (G). Data represent mean values±SD, n=2 (patients) or 5 (controls). *p<0.05.
DISCUSSION
In two patients who suffered from leukodystrophy manifesting by neurological regression at 6–13 months of age, truncal hypotonia, appendicular spasticity, dystonia, optic disc pallor, peripheral neuropathy and neurogenic bladder, we identified a homozygous missense mutation, p.E33G in the ACER3 gene. It may be argued whether the disorder described herein is a true leukodystrophy according to the consensus statement published recently7 but as the clinical features and white matter changes on MRI were consistent with leukodystrophy we choose to classify the disease as such.
The mutation was associated with undetectable ACER3 catalytic activity towards natural and synthetic ACER3-specific substrates in the patients’ cells and could not complement a mutant yeast strain which lacked alkaline ceramidase activity, indicating that Glu33 is an essential residue for ACER3 activity.
Ceramidases catalyse the hydrolysis of ceramides to form free fatty acids and SPH and as such they are intermediates of complex sphingolipid synthesis (figure 6) which in turn play an important role in the integrity and function of cell membranes. Ceramides also act as bioactive molecules to mediate cellular responses, including cell growth arrest, differentiation and apoptosis. According to their pH optima for in vitro activity, ceramidases are classified into acid, neutral and alkaline types8,9 and differ also by their cellular localisation and substrate specificities. In humans, there are three alkaline ceramidases: ACER1 is an endoplasmic reticulum (ER) ceramidase that is predominantly expressed in the skin and uses only very long-chain ceramides (≥C22) as substrates,10 ACER2 is a Golgi ceramidase that uses both long-chain and very long-chain ceramides as substrates11 and ACER3 is localised to both the Golgi complex and the ER,5 and as mentioned above, it catalyses the hydrolysis of ULC (C18:1, C20:1) ceramides.4 Expectedly, the sphingolipid profiling in our patients’ blood disclosed increased levels of the ACER3 known substrates, C18:1-ceramides and C20:1-ceramides and C18:1-dihydroceramides and C20:1-dihydroceramides, and their complex sphingolipid derivatives (sphingomyelins, monohexosylceramides and lactosylceramides), further supporting the functional significance of the p.E33G mutation. The abnormally increased levels of ceramide species, which are not ACER3 substrates, are rather unexpected. Similarly, the increased levels of ACER3 products (sphingoid bases and their phosphates) are puzzling. Whether these aberrations are the result of compensatory mechanisms that augment the de novo biosynthesis of sphingolipids or the activity of other ceramidases (figure 6) is a matter of conjecture. Compensatory induction of ACER2 was shown upon knocking down ACER3 activity in HeLa cells.4 Either way, the aberrant levels of the saturated and ULC ceramides and dihydroceramides and their complex sphingolipid derivatives were previously shown to exert a devastating effect; ACER3 deficiency in HeLa cells impaired cell proliferation and modulated apoptosis and was associated with progressive neurological disease in ACER3 knockout mice.12 The selective involvement of the brain in both humans and mice is likely underlined by the fact that complex sphingolipids are the major lipid components of myelin,13 and most defects of sphingolipid metabolism manifest solely by aberrant central myelination. Of note, ACER3 activity is relatively low in a 2-month-old mouse brain where it is only one-tenth of ACER3 activity in the animal liver and is associated with C20:1-ceramide and C18:1-ceramide levels, which are 20-fold and 100-fold more abundant in the brain than in liver.4 These data suggest that early in life the brain ACER3 activity is a priori relatively low, rendering the brain more vulnerable to the consequences of ACER3 deficiency. Another point of interest is that all the mutant animals developed urinary retention at ~6 months and some died of enlarged urinary bladder with distended abdomen by 10–12 months of age (CM—unpublished observation), recapitulating the neurogenic bladder in our patients.
In conclusion, our data suggest that Glu33 in ACER3 is crucial for the alkaline ceramidase activity of ACER3 and that p. E33G mutation inactivates the catalytic function of ACER3, leading to accumulation of various sphingolipids in the blood and probably in the brain of the patients. Heretofore, only acid ceramidase deficiency was reported to associate with disease in humans. Recessive mutations in ASAH1, encoding acid ceramidase, manifest by Farber lipogranulomatosis14 and by spinal muscular atrophy and progressive myoclonic epilepsy.15 The present report is the first to delineate the clinical phenotype associated with an alkaline ceramidase deficiency.
Supplementary Material
Acknowledgments
The authors thank the Bonei Olam organisation, Dr Joseph S Savitt, Linda Mosiello and the staff at Sunshine Children’s Home & Rehab Center for assistance and excellent care.
Funding
This work was supported in part by National Institutes of Health (NIH) grant R01CA163825.
Footnotes
Additional material is published online only. To view please visit the journal online (http://dx.doi.org/10.1136/jmedgenet-2015-103457).
Contributors SE, CJ and BDW undertook patient management, collected samples and delineated the phenotype, analysed the data and wrote the paper. JKY, RX, AF, EK, NRT and JS performed the experiments, analysed the data and wrote the paper. CM and OE conceived and designed the experiments, analysed the data and wrote the paper.
Competing interests None declared.
Patient consent Obtained.
Ethics approval The study was performed with the approval of the ethical committees of Hadassah Medical Center and the Ministry of Health.
Provenance and peer review Not commissioned; externally peer reviewed.
References
- 1.Bonkowsky JL, Nelson C, Kingston JL, Filloux FM, Mundorff MB, Srivastava R. The burden of inherited leukodystrophies in children. Neurology. 2010;75:718–25. doi: 10.1212/WNL.0b013e3181eee46b. [DOI] [PMC free article] [PubMed] [Google Scholar]
- 2.Schiffmann R, van der Knaap MS. Invited article: an MRI-based approach to the diagnosis of white matter disorders. Neurology. 2009;72:750–9. doi: 10.1212/01.wnl.0000343049.00540.c8. [DOI] [PMC free article] [PubMed] [Google Scholar]
- 3.Mao C, Xu R, Bielawska A, Obeid LM. Cloning of an alkaline ceramidase from Saccharomyces cerevisiae. An enzyme with reverse (CoA-independent) ceramide synthase activity. J Biol Chem. 2000;275:6876–84. doi: 10.1074/jbc.275.10.6876. [DOI] [PubMed] [Google Scholar]
- 4.Hu W, Xu R, Sun W, Szulc ZM, Bielawski J, Obeid LM, Mao C. Alkaline ceramidase 3 (ACER3) hydrolyzes unsaturated long-chain ceramides, and its down-regulation inhibits both cell proliferation and apoptosis. J Biol Chem. 2010;285:7964–76. doi: 10.1074/jbc.M109.063586. [DOI] [PMC free article] [PubMed] [Google Scholar]
- 5.Mao C, Xu R, Szulc ZM, Bielawska A, Galadari SH, Obeid LM. Cloning and characterization of a novel human alkaline ceramidase. A mammalian enzyme that hydrolyzes phytoceramide. J Biol Chem. 2001;276:26577–88. doi: 10.1074/jbc.M102818200. [DOI] [PubMed] [Google Scholar]
- 6.Sun W, Jin J, Xu R, Hu W, Szulc ZM, Bielawski J, Obeid LM, Mao C. Substrate specificity, membrane topology, and activity regulation of human alkaline ceramidase 2 (ACER2) J Biol Chem. 2010;285:8995–9007. doi: 10.1074/jbc.M109.069203. [DOI] [PMC free article] [PubMed] [Google Scholar]
- 7.Parikh S, Bernard G, Leventer RJ, van der Knaap MS, van Hove J, Pizzino A, McNeill NH, Helman G, Simons C, Schmidt JL, Rizzo WB, Patterson MC, Taft RJ, Vanderver A. GLIA Consortium. A clinical approach to the diagnosis of patients with leukodystrophies and genetic leukoencephelopathies. Mol Genet Metab. 2015;114:501–15. doi: 10.1016/j.ymgme.2014.12.434. [DOI] [PMC free article] [PubMed] [Google Scholar]
- 8.el Bawab S, Mao C, Obeid LM, Hannun YA. Ceramidases in the regulation of ceramide levels and function. Subcell Biochem. 2002;36:187–205. doi: 10.1007/0-306-47931-1_10. [DOI] [PubMed] [Google Scholar]
- 9.Mao C, Obeid LM. Ceramidases: regulators of cellular responses mediated by ceramide, sphingosine, and sphingosine-1-phosphate. Biochim Biophys Acta. 2008;1781:424–34. doi: 10.1016/j.bbalip.2008.06.002. [DOI] [PMC free article] [PubMed] [Google Scholar]
- 10.Sun W, Xu R, Hu W, Jin J, Crellin HA, Bielawski J, Szulc ZM, Thiers BH, Obeid LM, Mao C. Upregulation of the human alkaline ceramidase 1 and acid ceramidase mediates calcium-induced differentiation of epidermal keratinocytes. J Invest Dermatol. 2008;128:389–97. doi: 10.1038/sj.jid.5701025. [DOI] [PubMed] [Google Scholar]
- 11.Xu R, Jin J, Hu W, Sun W, Bielawski J, Szulc Z, Taha T, Obeid LM, Mao C. Golgi alkaline ceramidase regulates cell proliferation and survival by controlling levels of sphingosine and S1P. FASEB J. 2006;20:1813–25. doi: 10.1096/fj.05-5689com. [DOI] [PubMed] [Google Scholar]
- 12.Wang K, Xu R, Schrandt J, Shah P, Gong YZ, Preston C, Wang L, Yi JK, Lin CL, Sun W, Spyropoulos DD, Rhee S, Li M, Zhou J, Ge S, Zhang G, Snider AJ, Hannun YA, Obeid LM, Mao C. Alkaline ceramidase 3 deficiency results in Purkinje cell degeneration and cerebellar ataxia due to dyshomeostasis of ceramides and their metabolites in the brain. PLoS Genet. 2015;11:e1005591. doi: 10.1371/journal.pgen.1005591. [DOI] [PMC free article] [PubMed] [Google Scholar]
- 13.O’Brien JS, Sampson EL. Fatty acid and fatty aldehyde composition of the major brain lipids in normal human gray matter, white matter, and myelin. J Lipid Res. 1965;6:545–51. [PubMed] [Google Scholar]
- 14.Koch J, Gärtner S, Li CM, Quintern LE, Bernardo K, Levran O, Schnabel D, Desnick RJ, Schuchman EH, Sandhoff K. Molecular cloning and characterization of a full-length complementary DNA encoding human acid ceramidase. Identification of the first molecular lesion causing Farber disease. J Biol Chem. 1996;271:33110–15. doi: 10.1074/jbc.271.51.33110. [DOI] [PubMed] [Google Scholar]
- 15.Zhou J, Tawk M, Tiziano FD, Veillet J, Bayes M, Nolent F, Garcia V, Servidei S, Bertini E, Castro-Giner F, Renda Y, Carpentier S, Andrieu-Abadie N, Gut I, Levade T, Topaloglu H, Melki J. Spinal muscular atrophy associated with progressive myoclonic epilepsy is caused by mutations in ASAH1. Am J Hum Genet. 2012;91:5–14. doi: 10.1016/j.ajhg.2012.05.001. [DOI] [PMC free article] [PubMed] [Google Scholar]
Associated Data
This section collects any data citations, data availability statements, or supplementary materials included in this article.