

Abstract
Introduction
We examine symptom variability in men and women with urological chronic pelvic pain syndrome (UCPPS). We describe symptom fluctuations as related to early symptom regression and its effect on estimated one-year symptom change. We then describe a method to quantify patient-specific symptom variability.
Methods
Symptoms were assessed biweekly in 424 UCPPS subjects over one year. Subjects were classified as ‘improved’, ‘no change’, or ‘worse’ according to their rate of change using 1) all data, 2) excluding week 0, and 3) excluding weeks 0 and 2 to evaluate the impact of early symptom regression. Patient-specific time-varying variability was calculated at each interval using a sliding window approach. Patients were classified as high, medium, or low variability at each time and ultimately as high or low variability overall based on their variability for the majority of contacts.
Results
Prior to excluding early weeks to adjust for early symptom regression 25–38% and 5–6% of patients were classified as improved and worse, respectively; after adjustment the percentage of patients improved or worse ranged from 15–25% and 6–9%. ‘High and ‘low’ variability phenotypes were each identified in 25–30% of participants.
Conclusions
Patients with UCPPS exhibit symptom variability. At enrollment, patients had, on average, worse symptoms, resulting in a regression effect that influenced the estimated proportion of improved or worse subjects. Prospective studies should include a run-in to account for regression to the mean and other causes of early symptom regression. Further, symptom variability may be quantified and used to characterize longitudinal UCPPS symptom profiles.
Introduction
Symptom variability is an important feature of chronic illnesses. In designing interventional studies, understanding patterns of within-patient variability is critical to discern random fluctuations from symptom progression or improvement. This distinction arises in consideration of regression to the mean (RTM), a phenomenon in which, due to randomness, observations of extreme symptoms are followed by symptoms that are closer to the population mean. Measures of within patient variability also provide insight into clinical management. High symptom variability may reflect a unique patient phenotype, and could impact quality of life, coping, health-care seeking and resource use. Using longitudinal data from the Multidisciplinary Approach to the Study of Chronic Pelvic Pain (MAPP) Research Network, a prospective study of urological chronic pelvic pain syndrome (UCPPS), we investigate several aspects of symptom variability.
We first evaluate early regression in UCPPS symptoms and its impact on one-year change. We then characterize time-varying symptom variability at the patient level.
Materials and Methods
The MAPP network is a multisite, NIDDK-funded prospective study to improve understanding of the two most prominent chronic urological pelvic pain syndromes, interstitial cystitis/bladder pain syndrome and chronic prostatitis/chronic pelvic pain syndrome1. Eight sites are involved, including six patient-recruiting discovery sites, a core laboratory site, and a data coordinating center. The MAPP study design has been described2.
This paper reports observations of the treated natural history of UCPPS in the Trans-MAPP Epidemiology and Phenotyping Study (EPS). The Trans-MAPP EPS enrolled males and females with UCPPS and followed them for 48 weeks. At enrollment subjects completed an extensive questionnaire battery. The baseline visit was followed by identical biweekly internet-based assessments until the end of the study or loss to follow up. Utilizing the biweekly assessments, we first investigate early symptom regression by examining symptom severity at weeks 0 (baseline), 2 and 4 and evaluate the impact of such regression on estimates of one-year change. We then characterize time-varying symptom variability in each participant and describe its trends.
Eligibility criteria
Male and female patients at least 18 years of age who reported a score ≥ 1 on a 0–10 pelvic pain, pressure, and discomfort scale were considered for MAPP entry. Detailed eligibility criteria have been described2.
Trans-MAPP Epidemiology and Phenotyping Study
We focus on two derived scales, pain and urinary severity, but the methodology for characterizing variability applies generally to quantitative outcomes. Pain severity varies from 0 to 28 and is the sum of the pain subscore of the Genitourinary Pain Index (GUPI)3 and item 4 of the Interstitial Cystitis Symptom Index (ICSI)4. Urinary severity varies from 0 to 25 and is the sum of the GUPI urinary subscore and ICSI questions 1–3. These composite pain and urinary severity scores were derived from multivariate analysis5.
Statistical Analysis
Assessing Early Symptom Regression and Its Impact on Change
We first consider symptom fluctuations at enrollment and their impact on estimates of one-year change. Mean symptom levels were calculated at baseline, week 2, and week 4 to determine whether average symptom severity changed over these initial assessments. To explore potential causes of early symptom regression, the proportion of patients reporting a medication change in the last two weeks was calculated at baseline and compared to the same proportion at subsequent visits. Next, each subject’s one-year change was defined using a linear slope approach. A separate linear mixed model6 was fit for each of pain and urinary severity, and the resulting individual-level random slope estimates characterized 1-year change. Slopes were calculated three times using data 1) baseline to week 48; 2) weeks 2 to 48, omitting the baseline measurement and 3) weeks 4 to 48, omitting baseline and week 2 assessments. Patient-specific slopes were categorized to indicate improved, no change, or worse using weeks 0 to 48, 2 to 48, and 4 to 48 to show the potential impact of early symptom regression on interpreting change. We defined improved patients by a slope corresponding to ≤ −0.5 baseline standard deviation units change in severity over 48 weeks; worse patients were analogously defined by a slope consistent with ≥+0.5 standard deviation units change over 48 weeks. Patients whose slopes did not indicate sufficient change in either direction were labeled no change. Sensitivity analyses were conducted to see if medication changes at baseline or patient variability accounted for differences in the estimated proportion of improved or worse subjects. Slopes were defined on week 0 to 48 data after removing patients with recent medication changes at baseline or ‘highly variable’ patients, and estimated proportions of improved and worse subjects were compared to those determined from all subjects using weeks 4 to 48.
Characterizing Variability at the Patient Level
Patient-specific variability for pain and urinary severity was defined at each contact using a sliding window approach. We defined symptom variability using the standard deviation of symptoms over the most recent 6 weeks. For patients with complete data, this was the standard deviation of symptom levels reported at the current week and 3 previous biweekly assessments. For patients who had missed assessments, this was the standard deviation of 2–3 measurements over the most recent six weeks. The sliding window for defining the standard deviation at each assessment is illustrated in Figure 1. Variability profiles were graphically examined and summary statistics for the distribution of within-patient symptom variability at several contacts were generated. Patients were classified as ‘high variability’ over all 48 weeks for a symptom if their 6-week standard deviation was greater than or equal to the 60th percentile of 6-week standard deviation estimates across all UCPPS patients at a given biweekly contact for >50% of reported biweekly contacts. Similarly, patients were defined as ‘low variability’ if for >50% of biweekly contacts their standard deviation was less than the 40th percentile of variability estimates across all UCPPS patients at a contact. The remaining patients were designated as ‘medium’ variability for their 48-week variability phenotype. The thresholds of 40th and 60th percentiles were chosen arbitrarily to detect a reasonable number of high and low variability patients but could be adjusted for greater sensitivity or specificity. The correlation of symptom level and 6-week variability at weeks 4, 24, and 48 was assessed by Spearman’s rank correlation coefficient. The association of week 4 variability and overall variability phenotype with the 1-year slope was assessed by ANOVA considering ‘low’, ‘medium’ or ‘high’ variability.
Figure 1. Defining Time-varying Symptom Variability.
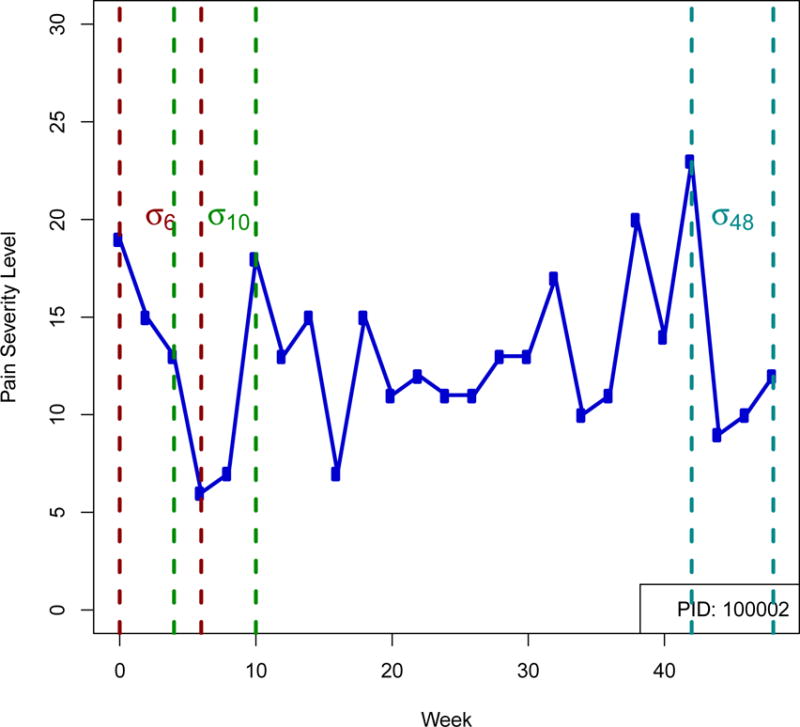
For an example patient the pain severity symptom level is plotted for 48 weeks. Example intervals for the calculation of 3 within subject standard deviation measurements in time are shown: σ6, the standard deviation over the first 6 weeks, calculated using data from weeks 0 through 6; σ10 the standard deviation estimate at week 10 calculated from data weeks 4 through 10, and σ48, the standard deviation at week 48, calculated from data weeks 42 through 48.
Results
Early Symptom Regression
Fully 372 (88%) of 424 subjects in the Trans-MAPP EPS completed 24 weeks of follow-up, and 350 (83%) completed 48 weeks. Figure 2 plots mean levels of pain and urinary severity at each contact. Changes in mean levels between weeks 2 and 4 were smaller than observed between weeks 0 and 2. At baseline, week 2, and week 4, respectively, 89 (21.2%), 65(18.4%), and 52(15.9%) of patients reported undergoing a new treatment or medication change in the prior two weeks. For remaining visits, the percentage of subjects reporting a medication change ranged from 7.8% to 16.0%. Using data from 0 to 48 weeks, 160 (37.7%) patients were classified as improved, 241 (56.8%) as no change, and 23 (5.4%) as worse on pain severity. Based on weeks 4 to 48 only, the number of improved subjects decreased to 105 (24.8%), 279 (65.8%) were classified as no change, and 40 (9.4%) were worse. For urinary severity, the numbers of improved, no change, and worse were 107(25.2%), 292(68.9%), and 25 (5.9%) for weeks 0 to 48 and 65 (15%), 333 (78.5%), and 26 (6.1%) for weeks 4 to 48 (Table 1). Overall, adjustment for early symptom regression resulted in 86 (20.3%) subjects being reclassified for pain severity change and 57 (13.4%) reclassified for urinary severity change. Our sensitivity analysis suggested that the impact of early symptom regression on the estimated proportion of improved and worse subjects was not entirely explained by high variability patients or recent treatment changes (Table 2).
Figure 2.
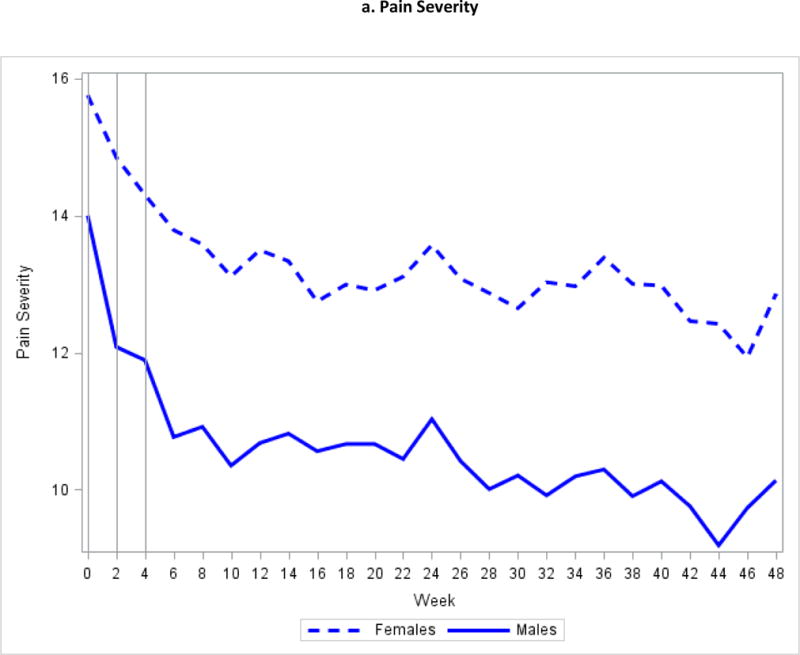
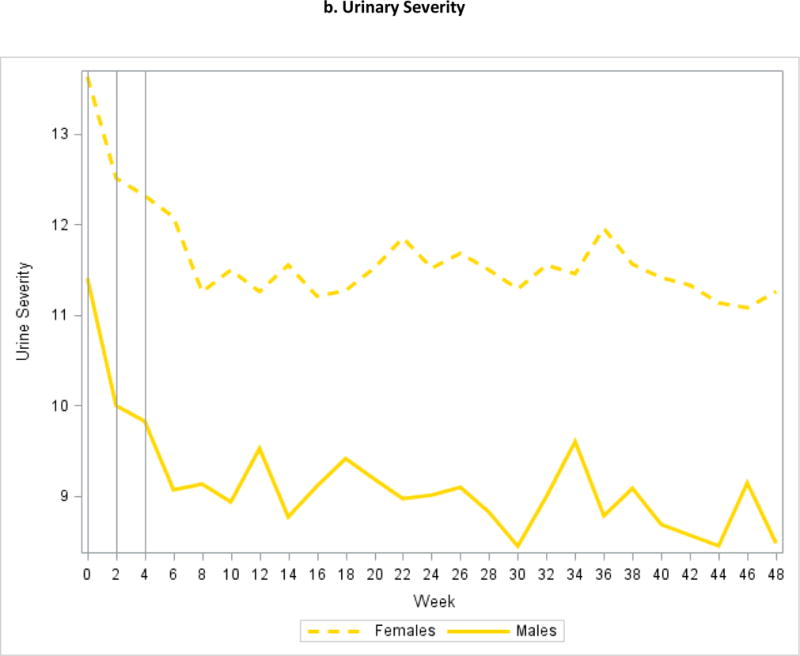
Mean Symptom Severity at Weeks 0, 2, and 4
Table 1.
Percentage of Improved, No change, and Worse based on Weeks 0 to 48, 2 to 48, and 4 to 48.
| Improved | No change | Worse | |||||||
|---|---|---|---|---|---|---|---|---|---|
|
| |||||||||
| Weeks | Weeks | Weeks | Weeks | Weeks | Weeks | Weeks | Weeks | Weeks | |
| 0 to 48 | 2 to 48 | 4 to 48 | 0 to 48 | 2 to 48 | 4 to 48 | 0 to 48 | 2 to 48 | 4 to 48 | |
|
|
|||||||||
| Pain Severity | 160 (37.7%) | 130 (30.6%) | 105 (24.8%) | 241 (56.8%) | 264 (62.3%) | 279 (65.8%) | 23 (5.4%) | 30 (7.1%) | 40 (9.4%) |
| Urinary Severity | 107 (25.2%) | 77 (18.2%) | 65 (15%) | 292 (68.9%) | 321 (75.7%) | 333 (78.5%) | 25 (5.9%) | 26 (6.1%) | 26 (6.1%) |
Table 2.
Sensitivity analysis. Percentage of Improved, No Change, and based on Weeks 0 to 48 After Excluding Patients Who Were Highly Variable Over 48 Weeks, Highly Variable at Week 4, or Reported a Recent Medication Change at Week 0.
| Improved | No change | Worse | |||||||
|---|---|---|---|---|---|---|---|---|---|
|
| |||||||||
| Exclude Highly Variable | Exclude Highly Variable (Week 4) | Exclude Med Change (Week 0) | Exclude Highly Variable | Exclude Highly Variable (Week 4) | Exclude Med Change (Week 0) | Exclude Highly Variable | Exclude Highly Variable (Week 4) | Exclude Med Change (Week 0) | |
|
|
|||||||||
| Pain Severity | 104 (34.7%) |
122 (37.3%) |
131 (39.7%) |
179 (59.7%) |
189 (57.8%) |
181 (54.9%) |
17 (5.7%) |
16 (4.9%) |
18 (5.5%) |
| Urinary Severity | 56 (19.0%) |
63 (19.8%) |
76 (23.0%) |
227 (77.0%) |
234 (73.6%) |
232 (70.3%) |
12 (4.1%) |
21 (6.6%) | 22 (6.7%) |
Symptom Variability
Individual symptom variability varied considerably at all contacts. For pain severity, the median week 6 standard deviation was 2.37 with a range of 0 (constant 6 week symptoms) to 13.9, and for urinary symptoms, the median standard deviation was 1.80, ranging from 0 to 8.1. Symptom variability decreased by week 24, with median (range) symptom standard deviation 2.1 (0.0–9.9) and 1.29 (0.0–6.1) in the pain and urinary domains, respectively. Week 48 6-week median (range) symptom standard deviation was 1.7 (0–7.8) for pain and 1.2 (0–7.2) for urinary severity. Figure 3 shows the distribution of 6-week pain and urinary symptom standard deviation at weeks 6, 24, and 48, further illustrating the decline in symptom variability during the first 6 months. Across all 48 weeks, 124 patients (29.2%) demonstrated high pain variability and 106 (24.9%) demonstrated low pain variability; for urinary symptoms, 129 (30.4%) demonstrated high variability and 106 (24.9%) demonstrated low variability. There were 55 (12.9%) patients with a high variability phenotype for both pain and urinary symptoms and 35 (8.2%) with a low variability phenotype for both symptoms. In males, increased urinary symptom variability was correlated with greater urinary severity (Spearman correlation 0.19 (p=0.038), 0.43 (p<0.0001), 0.33 (p=0.0001) at week 4, week 24, and week 48, respectively). This was not observed for pain severity in males, or either symptom in females. High week 4 variability was associated with a lower slope (indicating improvement) for urinary severity in women (mean slope 0.067 ‘low’, 0.036 ‘medium’, −0.058 ‘high’, p=0.02). In men, high week 4 variability was associated with a greater slope (indicating progression) for pain severity (mean slope −0.080 ‘low’, −0.030 ‘medium’, 0.080 ‘high’, p=0.001), but not for urinary severity. The overall variability phenotype was not significantly associated with week 4 to 48 slopes.
Figure 3. Distribution of 6-Week Standard Deviation of Pain and Urinary Symptoms at Weeks 6, 24 and 48.
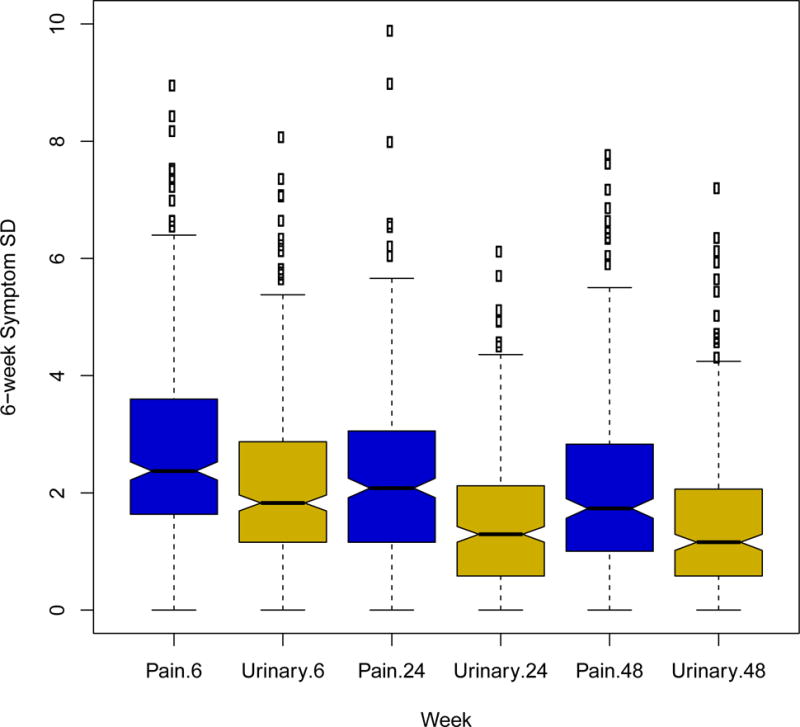
Boxplots show the distribution of the standard deviation of pain severity (blue) and urinary severity (gold) at weeks 6, 24, and 48.
Discussion
Symptom variability is an important aspect of chronic disease research for establishing a patient’s clinical profile and interpreting indications of symptom change. The MAPP EP Study provides a rich dataset for examining symptom variability in UCPPS. We describe the impact of symptom variability on measuring change by discussing early symptom regression in UCPPS. We also quantitatively characterize variability in pain and urinary symptoms at the participant level.
We showed that UCPPS symptoms of pain and urinary severity are subject to early regression. Similar trends have been observed in previous prospective studies of Interstitial Cystitis7 and Chronic Prostatitis/Chronic Pelvic Pain Syndrome8. This phenomenon is important, as it may have a clinically significant impact on observed symptom changes in cohort studies. It may also lead to overestimation of the impact of an intervention in uncontrolled interventional studies. On average, subjects reported more severe symptoms at baseline than in the next two visits. As discussed by Propert et al.7,8, these exacerbated symptoms and apparent improvement can result from several factors, including regression to the mean and the intervention effect. Regression to the mean (RTM)9,10 describes otherwise unexplained declines in symptom severity toward the population mean after initial observation when participants are selected according to the presence or severity of symptoms. The intervention effect describes a phenomenon in which subjects report favorable outcomes as a result of the additional attention received as study participants. Another factor possibly contributing to the observed decline in average symptom severity over the first two contacts is the greater likelihood of enrolling in the study when receiving a new therapy.
In the present study, not accounting for early symptom regression resulted in overestimation of the proportion of improved subjects and underestimation of the proportion of worse subjects. We defined improved and worse subjects based on the person-specific average rate of change as determined by the random slopes from a linear mixed model. Although alternative methods of defining change could result in a different proportion of improved or worse subjects, we expect that some degree of overestimation of improved subjects and underestimation of worse subjects is likely to occur regardless of the analytic approach. We advocate for awareness of RTM and other causes of early symptom regression in the design and analysis of studies of UCPPS.
Several strategies exist for dealing with RTM in observational and interventional research9. These include the use of placebo controlled randomized trials or characterizing subjects during a pre-enrollment screening based on multiple measurements11. In randomized clinical trials each group is assumed to be nondifferentially subject to RTM and other causes of early regression such that comparisons of intervention arms are not consequently biased. Randomized controlled trials, especially when blinded, also offer protection against other sources of bias, such as evaluation or ascertainment bias. In nonrandomized studies, collection of pre-enrollment data allow for subjects’ symptoms to stabilize prior to establishing baseline severity. Multiple pre-baseline measurements provide a more complete assessment of a patient’s condition. For stable conditions, additional observations enhance precision in assessing a patient’s baseline condition. For variable conditions, measures of baseline variability may predict placebo response12. In a study of the treated natural history of disease, the randomization strategy is not applicable. A pre-enrollment screening period, although possible, was not undertaken in MAPP phase I but will be implemented in subsequent phases as motivated by the current findings. Our data showed the greatest change in mean symptoms between baseline and week 2, with a smaller decrease in mean symptoms between weeks 2 and 4, which led to the selection of a pre-enrollment period of 4 weeks for phase II. Future cohort studies of UCPPS might therefore consider a pre-enrollment of similar duration or longer. Analytical approaches to address RTM include calculation of the RTM effect based on sample data when available, which would provide a measure of the amount of change attributable to RTM, and adjustment for baseline symptoms in multivariable models. Measurable causes of early symptom regression, such as treatment switches, should be considered and factored into eligibility criteria or analyses. Our sensitivity analyses showed that neither patient variability nor recent treatment switches completely explained the differences in the estimated proportion of improved and worse subjects observed after adjustment for early symptom regression.
The repeated symptom data that were collected during the MAPP EPS provide an exceptional opportunity to measure and examine UCPPS symptom variability as a potentially important clinical characteristic. We have developed standard methodology to quantify subject level variability and have demonstrated how one might define a ‘high variability’ phenotype. Our results indicate that UCPPS patients exhibit wide degrees of variability, with symptom variability declining on average during the first 6 months. One potential explanation for this observation is that participants became accustomed to reporting similar outcomes. This finding also suggests that interventional studies with endpoints based on duration of follow up longer than 6 months may be more reliable for identifying sustained change in UCPPS. Additional MAPP analyses are planned that will examine the association of symptom variability with quality of life, healthcare seeking, biomarkers, pain testing results, and neuroimaging.
Conclusion
Our comprehensive study of symptom variability in patients with UCPPS cautions against overinterpreting observed changes in patient symptoms when not accounting for early symptom regression. Additionally, the presented time-varying person-specific symptom variability may be associated with behavioral and neurological outcomes, which is the subject of forthcoming research. Our data are informative for the design of future randomized trials and cohort studies of UCPPS.
Acknowledgments
Funding for the MAPP Research Network was obtained under a cooperative agreement from the National Institute of Diabetes and Digestive and Kidney Diseases, National Institutes of Health ((DK82370, DK82342, DK82315, DK82344, DK82325, DK82345, DK82333, and DK82316)
Abbreviations
- UCPPS
Urological Chronic Pelvic Pain Syndrome
- RTM
regression to the mean
- MAPP
Multidisciplinary Approach to the Study of Chronic Pelvic Pain
- Trans-MAPP EPS
Trans-MAPP Epidemiology and Phenotyping Study
- EPS
Epidemiology and Phenotyping Study
Footnotes
Publisher's Disclaimer: This is a PDF file of an unedited manuscript that has been accepted for publication. As a service to our customers we are providing this early version of the manuscript. The manuscript will undergo copyediting, typesetting, and review of the resulting proof before it is published in its final citable form. Please note that during the production process errors may be discovered which could affect the content, and all legal disclaimers that apply to the journal pertain.
References
- 1.Clemens JQ, Mullins C, Kusek JW, et al. The MAPP research network: a novel study of urologic chronic pelvic pain syndromes. BMC Urol. 2014;14:57. doi: 10.1186/1471-2490-14-57. [DOI] [PMC free article] [PubMed] [Google Scholar]
- 2.Landis JR, Williams DA, Lucia MS, et al. The MAPP research network: design, patient characterization and operations. BMC Urol. 2014;14:58. doi: 10.1186/1471-2490-14-58. [DOI] [PMC free article] [PubMed] [Google Scholar]
- 3.Clemens JQ, Calhoun EA, Litwin MS, et al. Validation of a modified National Institutes of Health chronic prostatitis symptom index to assess genitourinary pain in both men and women. Urology. 2009;74:983. doi: 10.1016/j.urology.2009.06.078. [DOI] [PMC free article] [PubMed] [Google Scholar]
- 4.O’Leary MP, Sant GR, Fowler FJ, et al. The interstitial cystitis symptom index and problem index. Urology. 1997;49:58. doi: 10.1016/s0090-4295(99)80333-1. [DOI] [PubMed] [Google Scholar]
- 5.Griffith J, Stephens-Shields AJ, Hou X, et al. Pain and urinary symptoms should not be combined into one score: Psychometric findings from the Multidisciplinary Approach to the Study of Chronic Pelvic Pain (MAPP) Research Network. J Urology. 2015 doi: 10.1016/j.juro.2015.11.012. in press. [DOI] [PMC free article] [PubMed] [Google Scholar]
- 6.Laird NM, Ware JH. Random-effects models for longitudinal data. Biometrics. 1982;38:963. [PubMed] [Google Scholar]
- 7.Propert KJ, Schaeffer AJ, Brensinger CM, Kusek JW, Nyberg LM, Landis JR, Interstitial Cystitis Data Base Study Group A prospective study of interstitial cystitis: results of longitudinal followup of the interstitial cystitis data base cohort. The Journal of Urology. 2000;163:1434. doi: 10.1016/s0022-5347(05)67637-9. [DOI] [PubMed] [Google Scholar]
- 8.Propert KJ, McNaughton-Collins M, Leiby BE, O’Leary MP, Kusek JW, Litwin MS, Chronic Prostatitis Collaborative Research Network A prospective study of symptoms and quality of life in men with chronic prostatitis/chronic pelvic pain syndrome: the National Institutes of Health Chronic Prostatitis Cohort study. The Journal of Urology. 2006;175:619. doi: 10.1016/S0022-5347(05)00233-8. [DOI] [PubMed] [Google Scholar]
- 9.Gardner MJ, Heady JA. Some effects of within-person variability in epidemiological studies. J Chronic Dis. 1973;26:781. [Google Scholar]
- 10.Davis CE. The effect of regression to the mean in epidemiologic and clinical studies. Am J Epidemiol. 1976;104:493. doi: 10.1093/oxfordjournals.aje.a112321. [DOI] [PubMed] [Google Scholar]
- 11.Barnett A, van dar Pols JC, Dobson AJ. Regression to the mean: what it is and how to deal with it. Int J Epidemiol. 2005;34:215. doi: 10.1093/ije/dyh299. [DOI] [PubMed] [Google Scholar]
- 12.Farrar JT, Troxel AB, Haynes K, et al. Effect of variability in the 7-day baseline pain diary on the assay sensitivity of neuropathc pain randomized clinical trials: AN ACTTION study. Pain. 2014;155:1622. doi: 10.1016/j.pain.2014.05.009. [DOI] [PubMed] [Google Scholar]