

Abstract
Neonates are particularly susceptible to a number of infections, and the neonatal CD8+ T cell response demonstrates differences in both the phenotype and magnitude of responses to infection compared with adults. However, the underlying basis for these differences is unclear. We have used a mathematical modeling approach to analyze the dynamics of neonatal and adult CD8+ T cell responses following in vitro stimulation and in vivo infection, which allows us to dissect key cell-intrinsic differences in expansion, differentiation and memory formation. We found that neonatal cells started dividing 8 hrs earlier and proliferated at a faster rate (0.077 day−1 vs 0.105 day−1) than adult cells in vitro. In addition, neonatal cells also differentiated more rapidly, as measured by the loss in CD62L and Ly6C expression. We extended our mathematical modeling to analysis of neonatal and adult CD8+ T cells responding in vivo and demonstrated that neonatal cells divide more slowly than adult cells after day 4 post-infection. However, neonatal cells differentiate more rapidly, up-regulating more KLRG-1 per division than adult cells (20% vs. 5%). The dynamics of memory formation were also found to be different, with neonatal effector cells showing increased death (1.0 day−1 vs. 2.45 day−1). Comparison of the division of human cord blood and adult naïve cells stimulated in vitro showed more division in cord blood derived cells, consistent with the observations in mice. This work highlights differences of the cell-intrinsic division and differentiation program in neonatal CD8+ T cells.
Introduction
CD8+ T cells play an important role in the control and clearance of viral infection. During acute infection, virus-specific CD8+ T cells undergo activation, followed by massive expansion and differentiation 1. Following viral control and clearance, most activated T cells will die by apoptosis leaving only a small proportion of virus-specific memory cells to provide enhanced protection from subsequent infection. Neonatal individuals show an increased susceptibility to infection compared to adults, which is thought to arise from differences in both innate and acquired immune responses to infection 2, 3. In the case of CD8+ T cell responses to infection, there are a variety of environmental and cell-intrinsic factors that may affect the neonatal response. Previous work by Kollman et al. showed that the neonatal immune environment differs substantially from the adult 4. Neonatal mononuclear cells secrete less interferon-alpha, interferon-gamma and IL-12 following stimulation with toll-like receptor (TLR) agonist 5, 6. In contrast, neonatal cells produced more IL-10, IL-6 and IL-23. This data suggests that neonates may be more susceptible to intracellular pathogens due to a reduced capacity to initiate strong Th1 and CD8+ T cell responses. Other groups have also reported developmental differences in the number and composition of the dendritic cell population, which may further limit the induction of robust cellular immunity 7, 8.
Cell-intrinsic differences between adult and neonatal CD8+ T cells include the limited diversity of the neonatal T cell receptor (TCR) repertoire compared to adults. The generation of TCR diversity is accomplished by the somatic recombination of the V-D-J gene segments 9 and the addition of random nucleotides (N-addition) mediated by the TdT enzyme 10. The TdT enzyme is absent prior to birth in mice, and thus neonatal T cells show a lower diversity in their TCR repertoire responding to infection 11–15. This limited diversity persists as neonatal cells transition into the memory pool, limiting their ability to undergo robust recall responses 16. In addition to the TCR, neonatal T cells may also respond differently to identical stimuli, having different rates of proliferation and / or differentiation in response to the same stimulus.
Given the large number of cell-intrinsic and environmental differences between neonates and adults, we employed a reductionist approach to understand the relative influence of these factors in the development of CD8+ T cell responses. Recently, we focused on cell-intrinsic differences in neonatal responses by assuring identical TCR (using TCR-transgenic mice) and identical host environment (using in vitro assays and co-transfer of congenically marked neonatal and adult donor CD8+ T cells into the same recipient animal) 17. Consistent with previous studies 18, our data showed faster early growth of neonatal CD8+ T cells both in vivo and in vitro compared to the adult. Our previous in vitro studies indicated that neonatal cells proliferate more during the first 72 hours of stimulation. Furthermore, neonatal cells were present in higher numbers at early stages of in vivo infection 17, and showed a more differentiated phenotype at this time. Despite this faster early growth, we also showed neonatal cells have a smaller peak in primary responses, and also made a poor memory recall response to secondary infection.
These kinetic observations raise a number of questions about the differences in the cell-intrinsic differentiation and proliferation program between neonatal and adult CD8+ T cells. The simplest explanation would be that neonatal cells divided sooner than adult cells, and also differentiated faster than adult cells. However, since division has been shown to be associated with differentiation in many circumstances, it may be that neonatal cells differentiate at the same rate per division, but just divided more rapidly than adult cells. Similarly, the poor memory formation in neonatal infection may occur because all neonatal cells survive poorly, or just because the neonatal response was dominated by terminally differentiated effectors at the peak, and the underlying death rate of memory-precursor cells may be the same in adult and neonate.
Understanding the fundamental mechanisms that alter neonatal T cell behavior is important for developing more rational approaches to enhance immunity in early life. However, traditional methods of measuring T cell proliferation and memory differentiation only provide a snapshot of the response, and it is often difficult to differentiate the underlying mechanisms of behavior. Mathematical modeling allows the dissection of these factors by analyzing cell number and cell division profiles over time 19. In the present study, we have combined new experimental data with mathematical modeling to understand the key differences in behavior between adult and neonatal CD8+ T cells.
Results
Earlier onset and faster division of neonatal CD8+ T cells in vitro
Previous studies have shown that neonatal CD8+ T cells stimulated in vitro undergo a higher number of divisions than adult CD8+ T cells. However, this may have occurred because of earlier division, higher divisions rates, or lower death rates of neonatal cells. Our goal in this study was to quantify the cell-intrinsic differences in behavior between adult and neonate CD8+ T cells undergoing the same stimulus. To answer this question, naïve adult and neonatal transgenic gBT-I CD8+ T cells were labeled with CFSE and stimulated with peptide in the presence of IL-2 19. First, we compared the expression of CD3, Vβ8, IL2-Rα, CTLA-4 and CD62L between neonate and adult cells. Naive neonatal cells express slightly lower levels of CD3 and Vβ8 but have similar expression of CD25 (IL2-Rα), CTLA-4 and CD62L (Supplementary Figure 1). As previously observed, we found that neonatal CD8+ T cells divided more than adult cells (Fig. 1A and Fig. 1B). To dissect whether these gross differences in proliferation could be best explained by differences in time-to-first-division, division rate, or death rate of neonatal cells (see Materials and Methods), cells were harvested at multiple timepoints (4, 16, 28, 40, 52, and 64 h). Our analysis of the in vitro CD8+ T cell proliferation kinetics (Equations 1 and 2) revealed that neonatal CD8+ T cells divide faster than adult cells, with the duration of each division approximately 13 h for adult and 9 h for neonate (Fig. 1C, P<0.001, Table I). Neonatal CD8+ T cells also enter their first division earlier (about 30 h for neonate and 38 h for adult). We also estimated death rates of adult and neonatal cells (Fig. 1D), and found that neonatal CD8+ T cells were more susceptible to death before their first division in culture (P=0.001, Table I). However, neonatal cells underwent less death in each subsequent division compared to adult cells (Fig. 1E, P<0.001, Table I). Thus, despite higher death rate before their first division, neonatal CD8+ T cells enter their first division earlier than adult cells and proliferate faster than adult cells over the first 64 hours in vitro. To verify that these differences between neonatal and adults cells are not dependent on the choice of model, we also applied the alternative cyton method 20, which is a more complex version of the original method that we use here. Information about the cyton model and application to this data are provided in Supplementary Information, with the results presented in Supplementary Figure 2 and Supplementary Table 1.
Figure 1. Division of adult and neonatal cells in vitro.
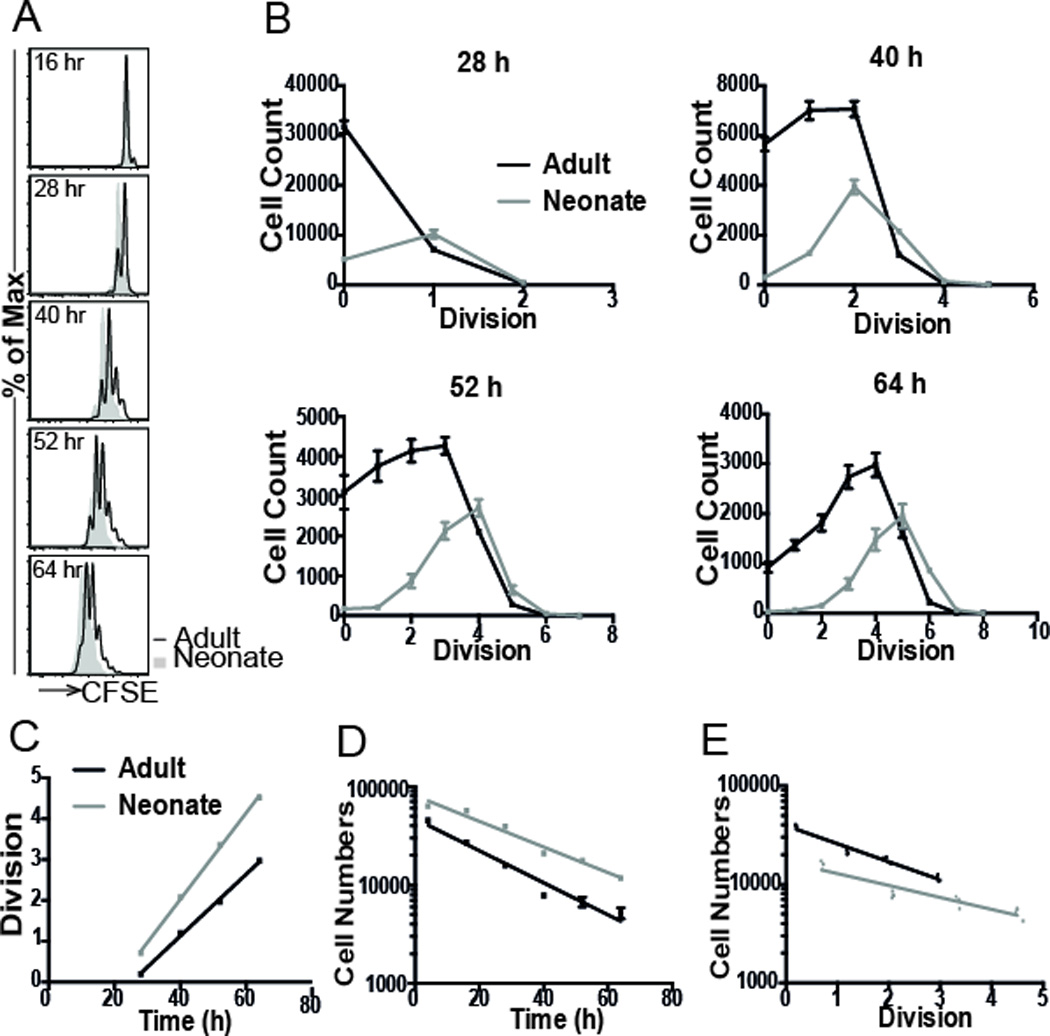
(A) CFSE labeled gB-1 T cells were stimulated with peptide (10−9 M) in the presence of IL-2, and sampled at 4, 16, 28, 40, 52, and 64 h. (B) The number of cells in each division was compared at each timepoint. Neonatal cells (n=4 replicate samples) consistently show a higher number of divisions than adult cells (n=4). (C) Plot of mean division number against various harvest times. Linear regression was performed to find the division rate (slope of the line) and time-to-first division (intercept of line with 1 division). Cell numbers were also plotted against (D) harvest time and (E) division number to estimate death rates of adult and neonatal cells (see Materials and Methods).
Table I.
In vitro data analysis.
| Adult | Neonate | |||||
|---|---|---|---|---|---|---|
| Name | Units | Value | 95% CI | Value | 95% CI | p-val |
| Division rate | day−1 | 0.077 | [0.07,0.08] | 0.105 | [0.10,0.11] | <0.001 |
| Death before division | day−1 | 0.029 | [0.022,0.037] | 0.037 | [0.034,0.04] | 0.001 |
| Death rate per division | day−1 | 0.422 | [0.39,0.55] | 0.278 | [0.23,0.33] | <0.001 |
Estimated parameters from the analysis of the in vitro data obtained for n=4 replicate samples of adult and neonate gBT-1 CD8+ T cells. A linear regression analysis was performed on various data (Figure 1C, 1D, and 1E). p-val is the significance of the treatment effect between adult and neonate determined using the Wald test from nlme package in R. 95% CI was obtained using R function intervals in library nlme.
Faster rate of differentiation of neonatal CD8+ T cells in vitro
Our previous studies 17 demonstrated a more differentiated phenotype of neonatal cells in vivo. However, given that neonatal CD8+ T cells also proliferate more (as described above), it is not clear whether this difference in differentiation is simply because neonatal cells have undergone more rounds of division (with the same rate of differentiation per division), or if they also differentiate more per division than adult cells. The frequent sampling of cell division in vitro allowed us to model the differentiation patterns of adult and neonatal CD8+ T cells. That is, we analysed the proportion of cells of a given phenotype in each division (identified by CFSE dilution) and applied a formula for the rate of differentiation per division (see Materials and Methods). These results firstly confirmed that the data are consistent with a model of both adult and neonatal cells differentiating with a constant rate of differentiation per division. However, when we compared this rate of differentiation in neonatal versus adult cells, we observed a more rapid loss of CD62Lhi in neonatal cells (0.8% per division vs. 4% per division respectively, P=0.008 [using non-linear regression to evaluate the effect of group (adult and neonate)] in neonatal cells up to 64 h in vitro (Fig. 2A). The same was true for expression of Ly6Chi, where we observed that neonatal cells differentiated at a rate of 13% per division, whereas adult cells differentiated at a rate of 9% per division (P=0.01, Fig. 2B). Thus, in addition to faster division, it appears neonatal cells are also programmed for faster differentiation per division.
Figure 2. More rapid differentiation of neonatal CD8+ T cells in vitro.
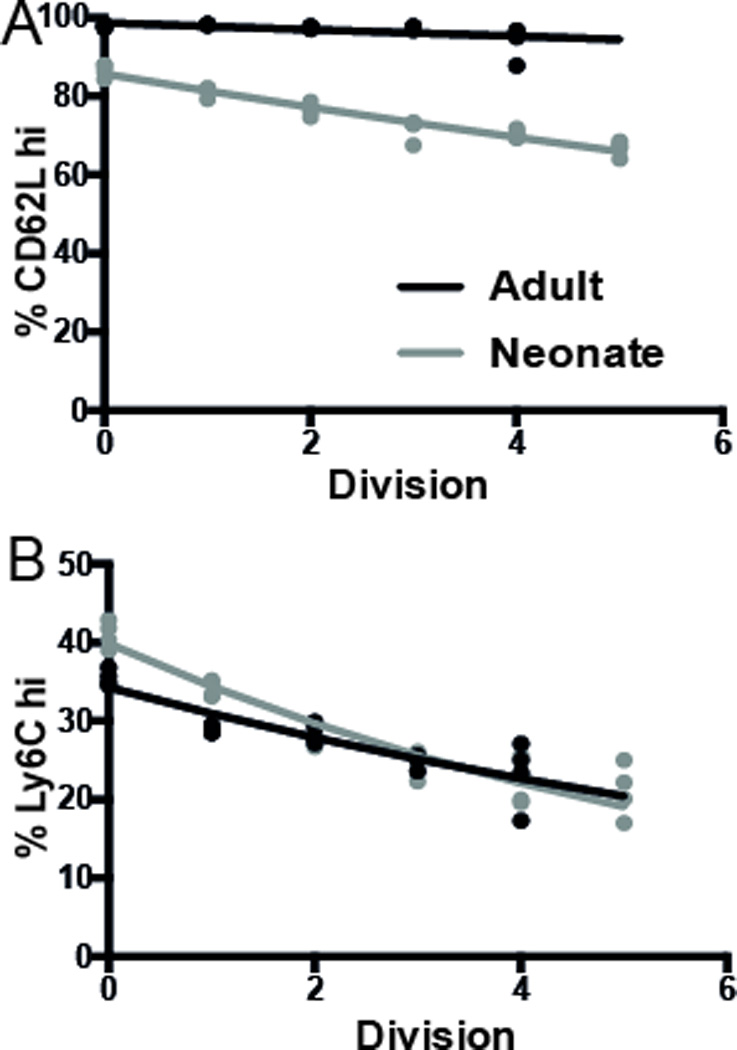
One way division-linked differentiation model could predict the expression of (A) CD62L and (B) Ly6C. The model assumes that, on each division, the cell will lose a certain amount of CD62Lhi and Ly6Chi. The data represents the average phenotype across 4 replicate samples each of adult and neonate CD8+ T cells in each division, as identified by CFSE dilution. Experimental data is shown as dots, and best-fit model of division-linked differentiation as solid lines.
Adult and neonatal CD8+ T cell responses are correlated after in vivo co-transfer
To understand more about the differences between adult and neonatal CD8+ T cell responses during primary infection, we also compared the dynamics of adult and neonatal transgenic gBT-I CD8+ T cells in vivo using an adoptive co-transfer experiment. We transferred equal numbers of adult (Thy1.1+, CD45.2+) and neonatal (Thy1.2+, CD45.2+) transgenic donor CD8+ T cells into adult Ly5.2+ recipients (Thy1.1-, CD45.1+) (Fig. 3A). Using this method, cells are exposed to the same host and antigenic environment, allowing us to focus on the cell intrinsic factors affecting the responses. In order to analyse the detailed dynamics of T cell growth and differentiation in vivo, we required regular (daily) sampling of CD8+ T cell numbers. Two cohorts of mice were analysed in parallel, to allow regular sampling without the risk of excessive bleeding (Fig. 3A).
Figure 3. Kinetics of adult and neonatal CD8+ T cell responses in vivo.
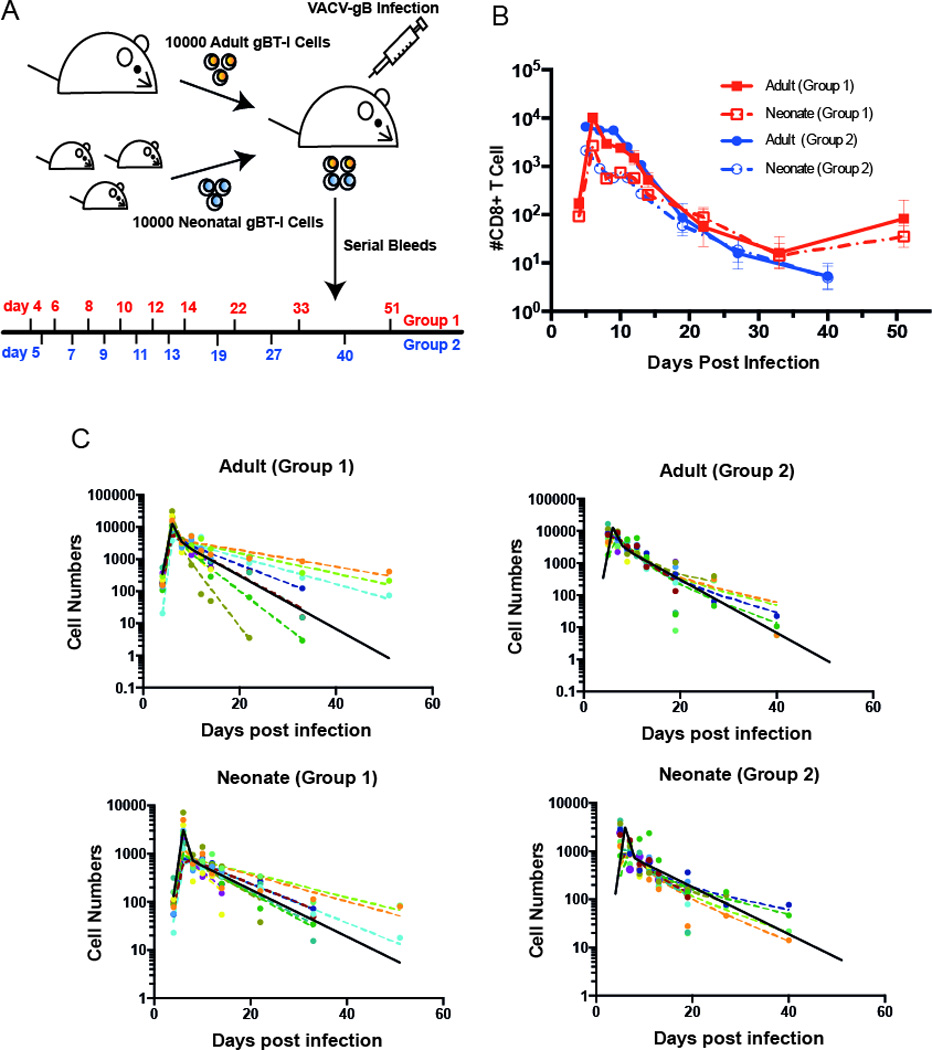
(A) Co-transfer experiment: 10,000 adult gBI-T CD8+ T cells and 10,000 neonatal gBI-T CD8+ T cells were co-transferred into an adult recipient. Recipients were infected with VACV-gB one day after transfer. 2 groups of mice (n=11 for each) were bled on indicated days post infection to observe the kinetics CD8+ T cells of both donor populations. (B) Kinetics of adult and neonatal CD8+ T cells, with error bars represent SEM from 11 samples. (C) Non linear mixed effect model fit for the data. We have a fixed peak response at day 6. The solid black line represents the global fit (pooled from group 1 and group 2), and the dashed coloured lines represent the individual fits (varying for each mouse). Although the response varies considerably between individual animals, the adult and neonatal responses are highly correlated within an individual animal (Supplementary Figure 3). Our analysis involved pair-wise consideration of adult and neonatal responses in each animal. Significance was determined by using Wald test from the package nlme in R. For parameters, see Table II.
Our experimental design, whereby adult and neonatal donor CD8+ T cells were transferred into the same host and paired samples for the response to antigen of adult and neonatal CD8+ T cells were obtained at each time point, enabled us to first investigate the impact of host environment on the response of these cells. Both adult and neonatal CD8+ T cells showed a wide variation in the rate of growth and differentiation between individual recipient mice. However, when we compared these features within an individual animal, we found that the adult and neonatal donor cells behaved similarly. That is, although the overall average growth rate was different between adult and neonatal-derived cells, if one donor population grew more slowly in a given recipient, the other donor population also tended to grow slowly. Features including early magnitude of response (day 4), peak level of response (day 6), and memory level of donor cells (day 33) were highly correlated between neonatal and adult cells within the same recipient (Supplementary Figure 3A). The level of differentiation, as assessed by surface marker expression at the peak response, was also highly correlated (Supplementary Figure 3B). Overall, this highlights the importance of co-transfer of adult and neonatal cells in our study, and the important role of host environment in determining CD8+ T cell kinetics. To account for host environment as a factor in our investigations of the dynamics and differentiation of adult and neonatal CD8+ T cells, we modeled the cell number and surface marker expression data accounting for the pairing of the sampled of neonatal and adult CD8+ T cell populations obtained from the same recipient animals.
Dynamics of adult and neonatal CD8+ T cells in vivo
Previous work has shown that neonatal CD8+ T cells showed lower peak responses and poorer memory formation than adult cells 17. Our observation of the primary response to antigen of adoptively co-transferred neonatal and adult donor CD8+ T cells (described in the previous section) revealed the same pattern (Fig. 3B). Consistent with the observations in vitro, this work showed that at 3 days post-infection, there were higher numbers of neonatal cells, and they were more differentiated than adult cells. However, after day four neonatal cells proliferated more slowly, and also formed poor memory responses. In order to understand the differences in the cell intrinsic differentiation program between adult and neonatal CD8+ T cells in vivo, we repeated these experiments using a fine time-sampling, and applied a mathematical model (Methods section, Equations 3 and 4) and non-linear mixed effect fitting (Fig. 3C) of T cell growth to fit the data. The model assumes that CD8+ T cells replicate exponentially during the expansion phase until the peak response (day 6). We also accounted for the pairing between the expanded neonatal and adult donor CD8+ T cell populations sampled from the same recipient. Adult CD8+ T cells were found to have a higher net-growth rate during the expansion phase compared to neonatal cells (1.86 day−1 and 1.48 day−1, (P<0.001, Table II)). This equates to a doubling time for adult cells of ≈8.9 hours, and for neonatal cells of ≈11.2 hours. Thus, whereas our in vitro analysis demonstrates more rapid proliferation by neonatal cells in the first 3 days post-stimulation, from day 4–6 in vivo this has slowed down. It is difficult to directly analyse antigen-specific CD8+ T cells in vivo prior to day 4, because of the low cell numbers involved. One approach to overcoming low cell numbers is simply to transfer more cells. Using higher cell numbers we have previously shown that neonatal cells outnumber adult cells at day 3 post-infection 17, consistent with our in vitro observations. In addition, using high cell transfer numbers we find that neonatal cells have diluted CFSE more at day 3 (data not shown). Although using higher cell transfer numbers may not be directly comparable 21, we believe that the cell numbers and CFSE dilution (at high cell transfer numbers) and the more differentiated phenotype of neonatal cells observed at day 4 (Fig. 4B) are consistent with the rapid early proliferation and differentiation of neonatal CD8+ T cells in vivo.
Table II.
Dynamics of adult and neonatal CD8+ T cell responses in vivo.
| Adult | Neonate | |||||
|---|---|---|---|---|---|---|
| Name | Units | Value | 95% CI | Value | 95% CI | p-val |
| Growth rate | day−1 | 2.11 | [1.94,2.28] | 1.2 | [0.81,1.6] | <0.001 |
| Effector death rate | day−1 | 1.003 | [0.6,1.41] | 2.45 | [0.6,4.3] | 0.05 |
| Memory death rate | day−1 | 0.17 | [0.14,0.2] | 0.11 | [0.04,0.15] | 0.007 |
| Fraction of memory | % | 0.31 | [0.22,0.4] | 0.26 | [0.04,0.46] | 0.33 |
The data consisted of paired adult and neonatal CD8+ T cell samples from blood obtained from the same host at multiple time points for two groups of 11 mice each. We fitted a linear regression on log-transformed data (from day 4 – day 6) to find the growth rate. Then, for effector death rate, memory death rate, and fraction of memory we fitted the data from day 6 – day 51 on the model described in Materials and Methods. The values here are the global parameter estimation of a mixed effect model; p-val is the significance of the difference between adult and neonate determined using the Wald test from nlme package in R. 95% CI was obtained using R function intervals in library nlme.
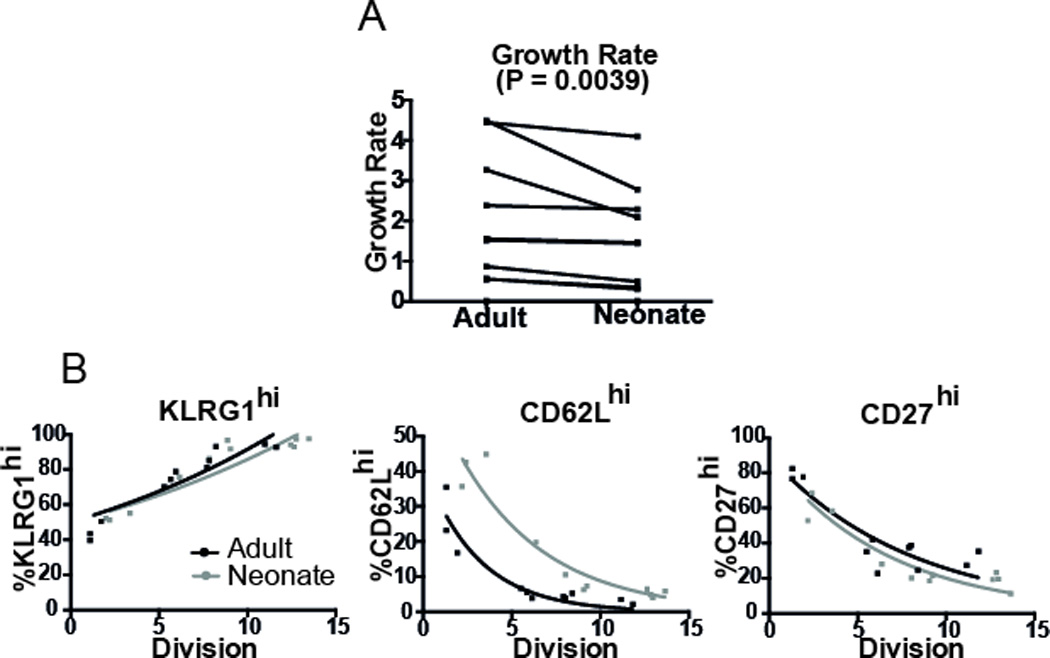
Figure 4. Phenotypic analysis of adult and neonatal CD8+ T cells in vivo.
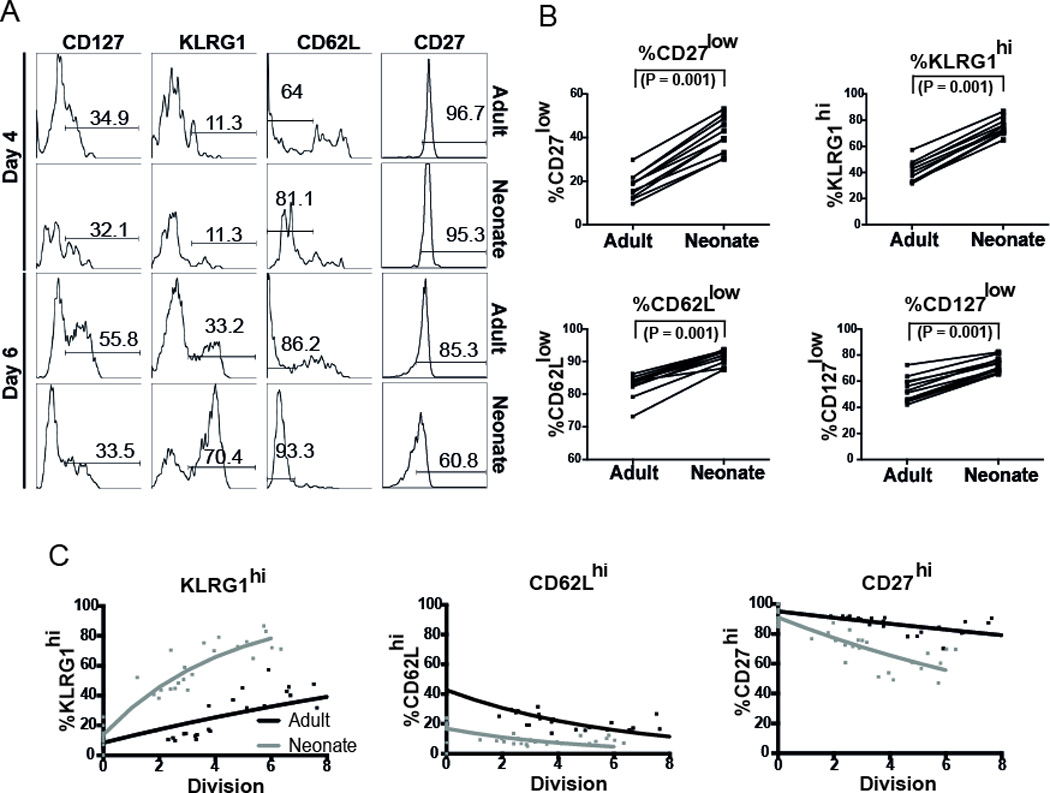
(A) Expression of various markers from day 4 to the peak response in vivo. (B) Phenotype of adult and neonatal donor at the peak of the primary challenge (day 6). Overall, we observed more differentiated phenotype in neonatal cells. Significance was determined by paired Wilcoxon test. (C) In vivo one-way division-linked differentiation from day 4 post infection up to the peak response (day 6). Number of divisions was estimated from net change in cell numbers. On each division, we assumed a probability that KLRG-1low cells will become KLRG-1hi cells, CD62Lhi cells will become CD62Llow cells, and CD27hi cells will become CD27low cells. Experimental data for individual animals is shown as dots, and best-fit model of division-linked differentiation is shown as lines. Significance was determined by using Wald test from the package nlme in R.
Differentiation of CD8+ T cells during early infection
The investigation in the previous section of the dynamics of the adoptively co-transferred neonatal and adult donor CD8+ T cells during the primary response shows lower peak numbers of neonatal CD8+ T cells compared with adult (Fig. 3B). However, our phenotypic analysis of these neonatal- and adult-derived CD8+ T cell populations during the primary response showed that neonatal CD8+ T cells consist of a more effector-like, terminally differentiated cell population (Fig. 4A). We found that at the peak neonatal CD8+ T cells consist of a higher proportion of KLRG1hi cells at the peak (p=0.001), and a higher proportion of CD62Llow cells at the peak (P=0.001), and a higher proportion of CD127low cells (P=0.001) (Fig. 4B). This phenotypic difference arose during the expansion of donor CD8+ T cells during the response to primary infection, as the phenotype of donor cells was similar prior to transfer 17. Previous work by ourselves and others has suggested that the rate of differentiation is in some cases well-correlated with cell division both in vitro22, 23 and in vivo 24, 25. Therefore, just as in the in vitro situation above, these phenotypic differences may have either arisen as a result of more divisions by neonatal cells or a higher differentiation rate per division, or both. We used a model of CD8+ T cell differentiation (Methods section, Equations 5–8) to analyse the rate of differentiation of adult and neonatal T cells during the expansion phase in order to determine (i) whether differentiation was correlated with cell division, and if sso (ii) whether the more rapid differentiation in neonatal cells occurred simply because of more rapid division, or because of a higher rate of differentiation per division. Although different combinations of marker expression form an observed cellular phenotype we analysed the immune markers independently of each other. Similar to the modeling for the investigation of the CD8+ T cell dynamics, our cell differentiation model also accounted for the pairing between the neonatal- and adult-derived CD8+ T cell populations sampled from the same host. Our assumption is that CD62Lhi cells have a probability of giving rise to CD62Llow cells in each division. This behavior is also assumed in CD27 cells (CD27hi cells will give rise to CD27low cells). However, for KLRG1, the assumption is that in each division, KLRG1low cells will give rise to KLRG1hi cells. To investigate this, we first estimated the number of divisions that cells in individual animals had undergone from day 4 to the peak of the response. Then, we compared this with the change in the proportion of cells of different phenotypes over the same period (Fig. 4C). In keeping with our previous work, we observed the proportion of cells remaining CD62Lhi was nicely predicted by a model of division-linked differentiation 24. Neonatal cells started with a lower proportion of CD62Lhi cells than adult cells (16.9% vs. 42.7%, P<0.001; Table III). The rate of loss of CD62L per division was also slightly higher in neonatal cells compared to adult cells, although this was not significant (19.1% per division vs. 15.2% per division, P=0.35). The opposite effect was seen in KLRG1 expression. That is, the starting proportion of KLRG1low cells was similar (adult 91.7%, neonate 86.7%, P=0.08). However, the up-regulation of KLRG1 per division was much greater for neonatal cells (21.2% per division for neonates versus 5.1% for adults, P<0.001). Finally, for CD27 expression we observed a significant difference in both the starting proportion of CD27hi cells, as well as the rate of differentiation per cell division (Table III). We explored another scenario assuming that the observed difference in growth rate (during the expansion phase) was due to increased death in neonatal cells. Even when we took into account this increased death, we could see still see the difference in differentiation rate (see Supplementary Table 3)
Table III.
Phenotype and differentiation of adult and neonate CD8+ T cells in vivo.
| Initial Proportion (%) | Gain or Loss Rate (%/div) | ||||||
|---|---|---|---|---|---|---|---|
| Phenotype | Type | Value | 95% CI | p-val | Value | 95% CI | p-val |
| KLRG1(hi) | Adult | 91.7 | [86.4, 96.99] | 0.08 | 5.1 | [−6.9, −3.25] | <0.001 |
| Neonate | 86.7 | [82.78, 90.62] | 21.2 | [−23.5, −18.84] | |||
| CD62L(hi) | Adult | 42.7 | [38.97, 46.42] | <0.001 | −15.2 | [−17.7, −12.6] | 0.35 |
| Neonate | 16.9 | [13.18, 20.62] | −19.1 | [−26.7, −11.45] | |||
| CD27(hi) | Adult | 95.1 | [92.36, 97.84] | 0.045 | −2.27 | [−3.3, −1.23] | <0.001 |
| Neonate | 91 | [88.06, 93.94] | −7.86 | [−9.21, −6.5] | |||
The data consisted of the phenotypes of paired adult and neonatal CD8+ T cell samples from blood obtained from the same host at multiple time points for two groups of 11 mice each. Estimation of initial proportion and gain/loss rate per division. We assumed that on each division, cells will lose or gain certain amounts of cell surface markers (see Materials and Methods). The values here are the global parameter estimation of the mixed effect model. The 95% CI was obtained using R function intervals in library nlme. p-val is the significance of the treatment effect between adult and neonate determined using the Wald test from nlme package in R..
Overall, this suggests a faster rate of differentiation per division for neonatal cells in vivo between day 4 and 6 of infection.
Formation of immune memory
Having used the donor-derived adult and neonatal CD8+ T cell populations responding to primary infection in the adoptive co-transfer experiments to compare the expansion kinetics of adult and neonatal CD8+ T cells from infection to day 6, we also compared the dynamics of memory formation in these animals. One approach to identify putative ‘memory precursor’ cells is to analyse cellular surface markers. An alternative is to look at the kinetics of the response, and estimate the proportion of cells present at the peak of the response that exhibit a long-lived memory phenotype (by their later persistence). From the peak of CD8+ T cells at day six, we assumed that there exist two populations, namely short-lived effector CD8+ T cells and long-lived memory-precursor CD8+ T cells. Each population may subsequently die, with different death rates. Thus, we aimed to estimate the initial proportions of short-lived and long-lived cells, as well as the death rates for each population, and compare these between adult and neonatal cells. We used a non-linear mixed effects model of the in vivo CD8+ T cell dynamics (Equations 3 and 4) to fit our experimental data on total numbers of donor adult / neonate cells over time (Fig. 3C). We used the paired adult and neonatal cells from the same host to evaluate the effect of group (adult and neonate as treatment factor).
Using this approach we found that the effector death rate was higher in neonates (2.45 day−1) than adults (1.003 day−1) although this did not achieve significance (P=0.05, Table II). This equates to a half-life of effector cells of neonatal cells of 6.8 hours, versus 16.6 hours for adult cells. In contrast to this rapid death of effectors, we observed a more stable pool of memory CD8+ T cells in neonates compared to adults (decay of 0.11 day−1 vs. 0.17 day−1 (P=0.007, Table II)). This equates to an early half-life of memory cells of 6.3 days in neonates, and 4.1 days in adults. Finally, the model also estimated that the fraction of putative memory precursors present at the peak of the response was very similar between adult and neonatal cells (31% vs. 26% (P=0.33)). Thus, the major difference between neonatal and adult cells appears to be the more rapid death of short-lived effector cells following the peak response, consistent with a more terminally differentiated state of these cells in the neonate. We also tested the data to another model with a contraction of effector cells and the forming of memory cells26, however this did not provide a better fit (for a more detailed description, see Supplementary Information, with the results presented in Supplementary Figure 4 and Supplementary Table 2).
Weak neonatal CD8+ T cell expansion in secondary challenge
Using the same cohort of animals involved in our investigations of the dynamics and differentiation during primary infection of adoptively co-transferred adult and neonatal CD8+ T cells, we also compared the recall response between adult and neonatal CD8+ T cells 51 days after primary challenge. We measured the growth rate from the initial day of re-challenge up to the peak of the response (day 5 post re-challenge). We found the growth rate during the expansion phase was significantly slower in neonatal compared to adult CD8+ T cells (doubling time of 8 h for adult and 11 h for neonate, P=0.004, Fig. 5A). This is consistent with our previous observation that neonatal CD8+ T cells contributed less to secondary immune responses 17, 27. However, although on average there is a statistical significance between adult and neonatal growth rates, this difference is small, and would only result in a median growth rate of 1.56 per day (adult) and 1.46 per day (neonate). Moreover, the very low starting levels of memory CD8+ T cells in most mice (Supplementary Figure 5) also increases the possibility of errors in calculating these growth rates. We also looked at the differentiation pattern from the initial day of re-challenge up to the peak of the secondary response. We modeled division-linked differentiation using the same method as primary infection, and observed that the expression of various markers was correlated with cellular division (Fig. 5B). Neonatal cells started with a higher proportion of CD62Lhi cells than adult cells (68% for neonate vs. 42% for adult, P=0.003). However, in contrast to primary infection, the rate of loss of CD62L per division was higher in adult cells compared to neonatal cells (28% per division in adult vs. 18% per division in neonate, P=0.02). In the case of KLRG1hi, the starting proportion of KLRG1hi cells was not significantly different (adult 47%, neonate 53%, P=0.34). However, the up-regulation of KLRG1 per division was slightly higher in adult, although not significantly different (7% per division for adult versus 5% for neonate, P=0.17). Finally, for the expression of CD27hi, we found no significant difference in the starting proportion of CD27hi cells (92% for adult and 83% for neonate, P=0.52), and there was no difference in rate of differentiation on each cell division (12.2% for adult and 12.8% for neonate, P=0.82). Overall, based on this analysis of division and differentiation, we found no evidence of faster differentiation in neonatal cells during secondary challenge (based on the differentiation pattern of KLRG1 and CD27), and if anything the results suggest that the rate of effector acquisition may be lower in neonatal CD8+ T cells compared to adult (based on CD62L marker).
Figure 5. Division and differentiation in secondary challenge.
(A) We measured the growth rate from the initial day of re-challenge (day 51 post-primary infection) up to the peak of the response (day 5 post re-challenge). Neonatal T cells showed reduced growth compared with adult T cells during secondary challenge (paired Wilcoxon test). (B) Differentiation pattern from the initial day of re-challenge up to the peak of the secondary response. Neonatal cells also showed the same (for KLRG-1 and CD27) or slower differentiation (CD62L) per division than adult cells. Overall, we found no evidence of faster differentiation in neonatal cells during secondary challenge. Significance was determined by using Wald test from the package nlme in R.
Human cord blood CD8+ T cells divide earlier than adult cells in vitro
To determine if our observations with a murine model can be extended to humans, we purified naïve CD8+ T cells from human cord blood (neonates) and peripheral blood (adults). Cells were labeled with CFSE and stimulated with microbeads coated with anti-CD3, anti-CD28 and anti-CD2 in the presence of IL-2. We collected the cells at 16, 40, 64, 88, and 111 h and analyzed the CFSE levels to assess cell division. We found more peak of division in human cord blood CD8+ T cells compared to adult cells (Fig. 6A). We then asked whether some features of CD8+ T cell proliferation observed in mice could also be found in human cells. Our analysis (based on the precursor cohort method, since the experiment to obtain human data was not set up to facilitate the more complicated cyton method) revealed that the division rate for human cord blood CD8+ cells was similar to adult cells, with the duration of each division approximately 20h (Fig. 6B; P=0.79). However, consistent with the results observed in mice, human cord blood CD8+ T cells entered their first division earlier (about 48 h for cord blood cells and 58 h for adult cells, P <0.001). This suggests that cell-intrinsic differences in neonatal CD8+ T cell responses are also seen in humans.
Figure 6. Human cord blood and adult peripheral blood stimulation.
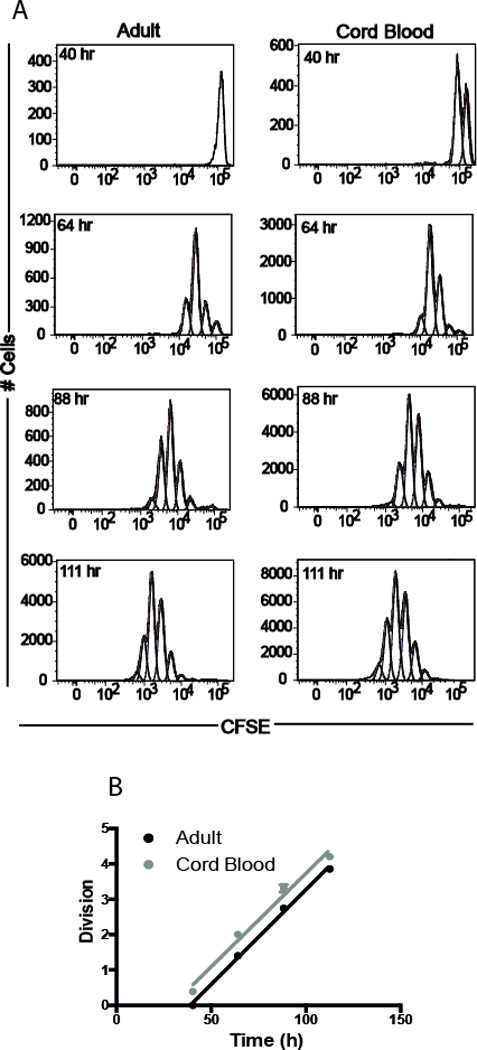
(A) Division of human adult and cord blood purified naïve CD8+ T cells in vitro. (B) Analysis of average division numbers with time revealed earlier onset of division in cord blood derived CD8+ T cells (n=3 for both adult and cord blood sample).
Discussion
Although it is well understood that there are limitations to neonatal immunity, there has been to date no rigorous quantitative investigation of the underlying mechanisms. In this study, we used statistical analysis and mathematical modeling to uncover the key differences in the dynamics of neonatal and adult CD8+ T cells following activation. Such an approach is necessary to calculate the rates of proliferation, death and formation of memory as opposed to just simply measuring the proportion of cells that are proliferating or dying at individual time points. In doing so we have been able to obtain a greater understanding of why neonatal CD8+ T cells more rapidly become terminally differentiated and fail to develop into memory cells after infection.
For example, we previously showed that neonatal CD8+ T cells undergo more cell divisions than adult cells following in vitro stimulation, but the underlying mechanism that allows neonatal cells to divide more than adults was unclear. Here, we performed new experiments in order to analyze cell number and cell division profiles over time and report that neonates divide more than adults because they enter division earlier and have a faster cell cycle time. Consistent with our observations in mice, neonatal CD8+ T cells from humans were also found to divide sooner than their adult counterparts. In addition, we also used mathematical modeling to understand the suboptimal generation of neonatal memory CD8+ T cell after infection in vivo. Earlier work indicated that fewer neonatal effector cells transition to the long-lived memory pool but the underlying basis for this imbalance in effector and memory cell differentiation remained undefined. By repeating these experiments with many more timepoints, we were able to understand which stages of the response are altered and identify the major factors contributing to age-related differences (e.g. increased death, slower proliferation). A number of novel observations emerged from this analysis. We made an assumption that the precursor cells seed recipient mice in a comparable manner based on our previous observations that both neonatal and adult donor cells express similar levels of CD62L, a major lymph-node homing molecule and the “take” is the same in the spleen after the adoptive transfer17.
Perhaps one of the most remarkable findings from our study was that neonatal CD8+ T cells differentiate more per division than adults. For example, we found that neonatal CD8+ T cells were more likely to upregulate KLRG1 per round of division (20% in neonates vs 5% in adult cells) following infection. As a result, neonatal CD8+ T cells consist mainly of terminally differentiated KLRG1+ cells at the peak of the response. One feature of KLRG1+ effector cells is a decreased proliferative potential 28, which may explain why rapid proliferation in neonatal CD8+ T cells was not maintained at later timepoints. Although it is unclear why neonatal cells undergo increased rates of differentiation, one possibility may relate to differences in asymmetric cell division 29–31. Previous data has shown that proximal daughter cells receive more stimulation and are fated to become effector cells, whereas distal daughter cells receive less stimulation and are biased to the memory cell lineage. Thus, it is possible that neonates preferentially differentiate into short-lived effectors because of reduced amounts of asymmetric cell division, which may also coincide with increased rates of proliferation.
Another interesting finding from our study was that neonatal CD8+ T cells exhibit less death per division than adult cells early after stimulation in vitro but exhibit a higher death rate than adult effector cells after infection in vivo. A key difference between the in vitro and in vivo experiments is the presence of pro-inflammatory cytokines (e.g type I IFNs, IL-12) in host mice after infection. Pro-inflammatory cytokines can promote or inhibit CD8+ T cell survival, which depends in large part on the amount and timing of exposure relative to T cell receptor signaling 32, 33. As the threshold to pro-inflammatory signaling is known to increase in T cells with progressing age 34, it would be interesting to investigate whether neonatal CD8+ T cells are hypersensitive to type I IFNs or IL-12.
We have also shown that neonatal cells enter their first division cycle earlier compared to adult. Interestingly, some models of T cell differentiation propose that cells recruited late into the effector phase may preferentially differentiate into memory cells, which might fit with our finding35. Lastly, it is worth commenting on the differences in behavior between neonatal primary and neonatal memory CD8+ T cells. Whereas neonatal CD8+ T cells differentiate more rapidly than adults during primary infection, the rate of effector acquisition was similar (or slightly higher) in adult memory CD8+ T cells compared to neonatal memory CD8+ T cell after secondary challenge. Given that nearly all neonatal and adult memory CD8+ T cells become KLRG1+ during the recall response, it seems possible that memory CD8+ are simply ‘wired’ differently than primary cells and follow more of a default pathway toward terminally highly differentiated effector cells. An alternative explanation is that the subsets of naïve neonatal cells that have an enhanced capacity to proliferate and differentiate are lost during the primary response to infection. As a result neonatal and adult memory CD8+ T cells exhibit a more uniform pattern of differentiation during memory recall.
Clearly, more studies are warranted to better understand the ontology of the CD8+ T cell response and its implications for immune control of infection.
The technical difficulties of comparing neonatal and adult responses in vivo provide a powerful analytical approach, but also a number of limitations. Firstly, adoptive transfer always provides some risks of manipulation of cells. Secondly, the need to track the responses in individual animals longitudinally meant that we were restricted to analyzing cells in blood. As we have shown previously, the ratio of adult and neonatal cells can vary slightly in different tissues 17. However, tissue sampling would mean different animals at each timepoint, which would have severely limited comparisons. Another limitation is our assumption about cell divisions in vivo, since we used a simple method to estimate the number of relative divisions based on the net change in cell numbers. The differences during expansion may be a product of differences in division rates or differences in death rates, and these cannot be differentiated from cell numbers alone. However, we have analysed the possibility that differences in observed growth rate occurred due to increases in death rate during proliferation (see Supplementary Information).
Overall, our current study highlights the importance of modeling in vitro and in vivo cell dynamics to obtain greater insights into the key differences between neonatal and adult memory CD8+ T cells. The demonstration that neonatal and adult CD8+ T cells respond differently during various stages of the response reveals new opportunities of therapeutic intervention. Further understanding the intrinsic and extrinsic factors that shape the development of neonatal memory CD8+ T cells will help guide the development of more effective vaccines that can be safely administered in early life.
Methods
Mice
B6-Ly5.2/Cr mice were purchased from the National Cancer Institute colony (Fredrick, MD). gBT-I TCR transgenic mice (mice transgenic for TCRαβ specific for the HSV-1 glycoprotein B498–505 peptide SSIEFARL) were provided by Dr. Janko Nikolich-Zugich (University of Arizona, Tucson, AZ) and crossed with B6-Thy1.1/CyJ mice, which were obtained from the Jackson Laboratory. For experiments, male mice were used (6–7 day-old pups were considered neonates and adults were 2–4 months of age) and all mice were maintained under pathogen-free conditions at Cornell University College of Veterinary Medicine, accredited by the American Association of Accreditation of Laboratory Animal Care. The experiments in this study were performed in strict accordance with the recommendations in the Guide for the Care and Use of Laboratory Animals of the National Institutes of Health. The protocols were approved by the Institutional Animal Care and Use Committee at Cornell University.
In vitro proliferation
For in vitro proliferation experiment, gBT-1 CD8+ T cells from adult and neonatal mice were isolated by positive magnetic selection. Purified cells were labeled with CFSE dye 36, resuspended in RPMI 1640 (Lonza, Basel, Switzerland) supplemented with 10% heat inactivated serum (PAA Laboratories, Pasching, Austria) and stimulated with peptide (10−9M) in the presence of IL-2 (100U/ml). Cells were collected at 4, 16, 20, 40, 52, and 64 hours post-stimulation. To determine total cell number, 1×10⁴ unlabeled calibrite beads (BD Biosciences, Mountain View, CA) were added to samples prior to staining procedures. Cells were stained with monoclonal antibodies to anti-CD8α (53–6.7, cat # 48–0081–82, eBiosciences, San Diego, CA), anti-CD4 (GK1.5, cat # 56–0041–82, eBiosciences), anti-CD62L (MEL-14, cat # 562404, BD Biosciences, San Jose, CA) and anti-Ly6c (HK1.4, cat # 47–5932–82, eBiosciences). To determine cell viability, cells were stained with fixable viability dye-e780 (65–0856–14, eBiosciences) according to manufacturer’s instruction. The number and phenotype of cells in each division was estimated using FlowJo’s proliferation analysis (Treestar, OR). We used four replicates of adult and four neonatal cells in our in vitro experiment (based on our pilot study).
Human cord and adult peripheral blood in vitro proliferation
De-identified whole adult (18–55 years of age) and cord blood (39–41 weeks gestation) samples from healthy donors were obtained from New York Blood Center and National Disease Research Interchange, respectively. Cornell University’s Committee on the Use of Human Subjects does not consider the use of this material to be Human Subjects Research because all the samples are de- identified, and the research does not involve intervention or interaction with the donors. Mononuclear cells were isolated using Ficoll-paque Plus (GE Healthcare) and CD8+ T cells were enriched using CD8+ microbeads (Miltenyi Biotec), both according to manufacturer’s instructions. Following magnetic enrichment of CD8+ cells, samples were labeled with anti-CD8 (efluor450, RPA-T8, cat # 48–0088–42, eBiosciences), anti-CD4 (A700, RPA-T4, cat # 56-0049-42, eBiosciences), anti-CD45RA (efluor610, HI100, cat # 61–0458-42, eBiosciences) and CD45RO (PE-Cy7, UCHL1, cat # 25–0457-42, eBiosciences). Naïve CD8+ cells (CD45RA+, CD45RO–) were FACS sorted to <95% purity with an Aria (BD Biosciences). Sorted cells were labeled with CFSE and then plated in RPMI 1640 (Lonza, Basel, Switzerland) supplemented with 10% heat inactivated serum (PAA Laboratories, Pasching, Austria), 20 U/ml IL-2 and prepared beads from human T cell activation/expansion kit (Miltenyi), prepared according to manufacturer’s instructions. We used three replicates of adult and three replicates of cord in our in vitro experiment (based on our pilot study).
Modeling in vitro CD8+ T cell proliferation kinetics
We used the precursor cohort plot approach based on the method described by Gett and Hodgkin 37, which assumes that the average division number varies linearly with time. Briefly, we calculated the fraction of cells in each division at a given time (f(i,t)) from the normalized cell count at a certain harvest time using this formula
| (1) |
Here, n(i,t) is the non-normalized cell count in division i, at harvest time t. Then we found the average division number at a given harvest time,
| (2) |
Plotting these values against various harvest times will generate a linear relationship, in which the slope is the division rate. We can also find the time to first division, . Here m and c are the gradient and intercept of the best-fit linear line, respectively.
We can also estimate two kinds of death rate: the initial death rate, which is the death of cells before they enter the first division (assumed to be approximately exponential), and subsequent death rate per division, which is the loss of cells through their division cycle 37, 38. In order to estimate the initial death rate and death rate per division, we fitted an exponential function to the total numbers of live cells against time before the first division (for initial death rate) or against time after the first division (for subsequent death rate in each division). We performed linear regression on log-transformed data to find the initial and subsequent death rates. We also fitted our in vitro data using the Cyton model20. This model was developed by Hodgkin and colleagues20, 39, and is available online (https://github.com/hodgkinlab/destinypaper). It assumes that each cell has an internal machinery governing how it might divide or die, and on each division, an individual cell will reset both the division and death time. A more detailed description can be seen in the Supplementary Information.
In vivo co-transfer of adult and neonatal CD8+T cells
These experiment were conducted as described previously 17. Briefly, we co-transferred 104 congenically-marked donor CD8+ T cells from adult and neonatal gBT-I mice into adult Ly5.2 recipient mice that were then infected with VACV-gB (2 × 10⁵ PFU, i.p.) the following day. To monitor donor responses, recipient mice were bled at regular intervals after infection. Both neonatal and adult cells were analyzed together within the same host animal to account for differences in the size of the overall response between animals. In order to study the fine kinetics of the response, we prepared two groups of mice (no blinding, n = 11 for each group, 22 mice total, based on our pilot study), and bled the groups alternatively on indicated days post infection (Fig. 3A). To determine CD8+ T cell numbers in the blood, 1×10⁴ unlabeled calibrate beads (BD Biosciences) were added to a known volume of blood prior to staining. Cells were stained with monoclonal antibodies anti-CD8α (53–6.7), anti-CD4 (GK1.5, cat # 56–0041–82, eBiosciences), anti-CD45.1 (A20, cat # 25–0543082, eBiosciences), anti-CD45.2 (104, cat # 47–0454082, eBiosciences), anti-CD90.1/Thy1.1 (OX-7, cat # 202526, Biolegend, San Diego, CA), anti-KLRG1 (2F1, cat # 46–5893–82, eBiosciences), anti-CD127 (A7R34, cat # 12–1271–83, eBiosciences), anti-CD27 (LG7F9, cat # 11–0271–85, eBiosciences), and anti-CD62L (MEL-14, cat # 562404, BD Biosciences). For studies of secondary responses (n=9, some mice died due to complication), mice were challenged with 5×10⁴ CFU wild-type Listeria monocytogenes expressing gB peptide 51 days after initial exposure to VACV-gB.
Modeling in vivo CD8+ T cell dynamics
In order to compare proliferation kinetics between adult and neonatal cells, we used a piecewise fitting of growth and decay rates similar to that described by de Boer and colleagues 40, 41. Briefly, in this model, it is assumed that CD8+ T cells proliferate exponentially at a rate ρ after initial antigen stimulation, until the peak response. Let A be the total number of CD8+ T cells, thus we have
| (3) |
where A0 is the initial number of CD8+ T cells at day 4. We assumed equal numbers of precursor cells for adult and neonate, as they received approximately the same number of transgenic cells during adoptive transfer. We assumed that the precursor frequency of each type of transgenic CD8+ T cells was 0.003% of the total T cell population at the time of infection (ie: total CD8+ T cell number is around 3 × 10⁷, we add 104 of each cell type, so if we have a 10% take 42–45, we have approximately 0.3 in 104 cells).
To compare the decay phase of CD8+ T cells after the peak, we modeled a fraction ff of cells at the peak (day 6) as memory-precursor CD8+ T cells, and the remainder (1-f) as short-lived effectors. We then estimated both f as well as the death rate of effector cells (δ1) and memory cells (δ2). For the decay phase, we have
| (4) |
in which AToff is the total number of CD8+ T cells at the peak.
An alternative model26 to describe the decay phase of CD8+ T cells after the peak would be to allow a period of rapid effector death (due to apoptosis) of length ΔTdeath. Model selection was done based on the Akaike weight (based on the difference in the AIC). A brief description of the model can be seen in the Supplementary Information.
Modeling CD8+ T cell differentiation
In order to understand the differentiation pathways of adult and neonatal CD8+ T cells we modeled the process of differentiation being linked to T cell division. The assumption of this simple ‘division-linked differentiation’ is that on each division, cells will lose or gain certain amounts of specific cell surface markers 22, 25, 46. We cannot really measure both death and proliferation simultaneously, and what we observe is only the net effect from these two. However, we have discussed an alternative scenario where neonatal cells are allowed to proliferate as fast as adult cells (see Supplementary Information). For CD62L and CD27, we assume that at each division there are certain proportions of high expressor cells (CD62Lhi or CD27hi) that will be converted to low expressers (CD62Llow or CD27low) 24. The model can be written as:
| (5) |
Where H(n) is the proportion of CD62Lhi or CD27hi at division n, H0 is the initial proportion of CD62Lhi or CD27hi cells, n is the division number, and c is the loss of CD62Lhi or CD27hi proportion on each division. For KLRG1 expression, we assume that on each division some proportion of KLRG1low cells will differentiate to become KLRG1hi cells. Thus the proportion of cells KLRG1hi after n divisions (H(n)) is:
| (6) |
where L0 is the initial proportion of KLRG1low cells, n is the division number, and c is the loss of KLRG1low proportion on each division.
To estimate the number of divisions cells have undergone, we compare the net difference of the cell numbers between the initial day (C0) and at day t (C(t)) Thus, we have the following relationships:
| (7) |
| (8) |
in which n(t) is the division number.
Fitting procedures
To fit the models to our data, we used a non-linear mixed effect model with binary covariate to capture the difference between adult and neonatal CD8+ T cells. Significance was determined based on the value of this covariate (whether it was significantly different from zero), which can be calculated using the Wald test from the standard errors calculated in package nlme in R. All other parameters were treated as mixed effects (fixed effects plus random effects). Denoting φ as the parameter in the model described above, thus we have
| (9) |
in which µ is the mean global parameter for all individuals, β is the fixed covariate (for adult and neonate), and ri is the random effect associated with the i-th subject. We fitted a global model (pooled from group 1 and group 2 of our in vivo mice), and an individual model based on each unique individual.
The models were fitted with the non-linear mixed effect model R (v3.0.2) function nlme in library nlme (v3.1–113). For the decay model, the fit was weighted using varPower to account for increases in error variance with fitted values. We assumed a diagonal variance-covariance matrix for the random effect using the pdDiag option in R. To find the 95% confidence interval, we use R function intervals in library nlme. The final model was chosen using backwards elimination starting from the full model (random effect for each parameter), and gradually removing each random effect. The best model was determined by the Akaike Information Criteria (AIC).
Statistical analysis
Throughout this paper, we use Spearman correlation coefficients to test for statistically significant correlations in the sample. Correlation analysis was performed using GraphPad Prism (version 6). We also used the Wilcoxon matched pair rank test (two-sided) to test for a difference between paired samples of adult and neonatal CD8+ T cells in the same donor mouse, and to determine the effectiveness of this pairing.
Supplementary Material
Acknowledgments
This work was supported by National Institute of Health Awards R01AI105265 (to B.D.R.) and R01AI110613 (to B.D.R.) from the National Institute of Allergy and Infectious Disease. MPD is a National Health and Medical Research Council (Australia) Senior Research Fellow (1080001). VV is a National Health and Medical Research Council Career Development Fellow (1067590). We acknowledge the use of tissues procured by the National Disease Research Interchange (NDRI) with support from NIH grant 2 U42 OD011158.
Footnotes
Conflict of Interest
All authors declare no conflict of interest.
References
- 1.Butz EA, Bevan MJ. Massive expansion of antigen-specific CD8+ T cells during an acute virus infection. Immunity. 1998;8(2):167–175. doi: 10.1016/s1074-7613(00)80469-0. [DOI] [PMC free article] [PubMed] [Google Scholar]
- 2.Siegrist CA. Neonatal and early life vaccinology. Vaccine. 2001;19(25–26):3331–3346. doi: 10.1016/s0264-410x(01)00028-7. [DOI] [PubMed] [Google Scholar]
- 3.Adkins B, Leclerc C, Marshall-Clarke S. Neonatal adaptive immunity comes of age Nature reviews. Immunology. 2004;4(7):553–564. doi: 10.1038/nri1394. [DOI] [PubMed] [Google Scholar]
- 4.MacGillivray DM, Kollmann TR. The role of environmental factors in modulating immune responses in early life. Front Immunol. 2014;5:434. doi: 10.3389/fimmu.2014.00434. [DOI] [PMC free article] [PubMed] [Google Scholar]
- 5.Kollmann TR. Variation between Populations in the Innate Immune Response to Vaccine Adjuvants. Front Immunol. 2013;4:81. doi: 10.3389/fimmu.2013.00081. [DOI] [PMC free article] [PubMed] [Google Scholar]
- 6.Kollmann TR, Levy O, Montgomery RR, Goriely S. Innate immune function by Toll-like receptors: distinct responses in newborns and the elderly. Immunity. 2012;37(5):771–783. doi: 10.1016/j.immuni.2012.10.014. [DOI] [PMC free article] [PubMed] [Google Scholar]
- 7.Ruckwardt TJ, Malloy AM, Morabito KM, Graham BS. Quantitative and qualitative deficits in neonatal lung-migratory dendritic cells impact the generation of the CD8+ T cell response. PLoS pathogens. 2014;10(2):e1003934. doi: 10.1371/journal.ppat.1003934. [DOI] [PMC free article] [PubMed] [Google Scholar]
- 8.Lee HH, Hoeman CM, Hardaway JC, Guloglu FB, Ellis JS, Jain R, et al. Delayed maturation of an IL-12-producing dendritic cell subset explains the early Th2 bias in neonatal immunity. The Journal of experimental medicine. 2008;205(10):2269–2280. doi: 10.1084/jem.20071371. [DOI] [PMC free article] [PubMed] [Google Scholar]
- 9.Lieber MR. The mechanism of V(D)J recombination: a balance of diversity, specificity, and stability. Cell. 1992;70(6):873–876. doi: 10.1016/0092-8674(92)90237-7. [DOI] [PubMed] [Google Scholar]
- 10.Cabaniols JP, Fazilleau N, Casrouge A, Kourilsky P, Kanellopoulos JM. Most alpha/beta T cell receptor diversity is due to terminal deoxynucleotidyl transferase. J Exp Med. 2001;194(9):1385–1390. doi: 10.1084/jem.194.9.1385. [DOI] [PMC free article] [PubMed] [Google Scholar]
- 11.Bogue M, Candeias S, Benoist C, Mathis D. A special repertoire of alpha:beta T cells in neonatal mice. EMBO J. 1991;10(12):3647–3654. doi: 10.1002/j.1460-2075.1991.tb04931.x. [DOI] [PMC free article] [PubMed] [Google Scholar]
- 12.Feeney AJ. Junctional sequences of fetal T cell receptor beta chains have few N regions. J Exp Med. 1991;174(1):115–124. doi: 10.1084/jem.174.1.115. [DOI] [PMC free article] [PubMed] [Google Scholar]
- 13.Komori T, Okada A, Stewart V, Alt FW. Lack of N regions in antigen receptor variable region genes of TdT-deficient lymphocytes. Science. 1993;261(5125):1171–1175. doi: 10.1126/science.8356451. [DOI] [PubMed] [Google Scholar]
- 14.Garcia AM, Fadel SA, Cao S, Sarzotti M. T cell immunity in neonates. Immunol Res. 2000;22(2–3):177–190. doi: 10.1385/IR:22:2-3:177. [DOI] [PubMed] [Google Scholar]
- 15.Rudd BD, Venturi V, Davenport MP, Nikolich-Zugich J. Evolution of the antigen-specific CD8+ TCR repertoire across the life span: evidence for clonal homogenization of the old TCR repertoire. J Immunol. 2011;186(4):2056–2064. doi: 10.4049/jimmunol.1003013. [DOI] [PMC free article] [PubMed] [Google Scholar]
- 16.Rudd BD, Venturi V, Smith NL, Nzingha K, Goldberg EL, Li G, et al. Acute neonatal infections 'lock-in' a suboptimal CD8+ T cell repertoire with impaired recall responses. PLoS pathogens. 2013;9(9):e1003572. doi: 10.1371/journal.ppat.1003572. [DOI] [PMC free article] [PubMed] [Google Scholar]
- 17.Smith NL, Wissink E, Wang J, Pinello JF, Davenport MP, Grimson A, et al. Rapid proliferation and differentiation impairs the development of memory CD8+ T cells in early life. J Immunol. 2014;193(1):177–184. doi: 10.4049/jimmunol.1400553. [DOI] [PMC free article] [PubMed] [Google Scholar]
- 18.Adkins B, Williamson T, Guevara P, Bu Y. Murine neonatal lymphocytes show rapid early cell cycle entry and cell division. J Immunol. 2003;170(9):4548–4556. doi: 10.4049/jimmunol.170.9.4548. [DOI] [PubMed] [Google Scholar]
- 19.Hawkins ED, Hommel M, Turner ML, Battye FL, Markham JF, Hodgkin PD. Measuring lymphocyte proliferation, survival and differentiation using CFSE time-series data. Nat Protoc. 2007;2(9):2057–2067. doi: 10.1038/nprot.2007.297. [DOI] [PubMed] [Google Scholar]
- 20.Hawkins ED, Turner ML, Dowling MR, van Gend C, Hodgkin PD. A model of immune regulation as a consequence of randomized lymphocyte division and death times. Proc Natl Acad Sci U S A. 2007;104(12):5032–5037. doi: 10.1073/pnas.0700026104. [DOI] [PMC free article] [PubMed] [Google Scholar]
- 21.Badovinac VP, Haring JS, Harty JT. Initial T cell receptor transgenic cell precursor frequency dictates critical aspects of the CD8(+) T cell response to infection. Immunity. 2007;26(6):827–841. doi: 10.1016/j.immuni.2007.04.013. [DOI] [PMC free article] [PubMed] [Google Scholar]
- 22.Tangye SG, Avery DT, Hodgkin PD. A division-linked mechanism for the rapid generation of Ig-secreting cells from human memory B cells. J Immunol. 2003;170(1):261–269. doi: 10.4049/jimmunol.170.1.261. [DOI] [PubMed] [Google Scholar]
- 23.Hasbold J, Corcoran LM, Tarlinton DM, Tangye SG, Hodgkin PD. Evidence from the generation of immunoglobulin G-secreting cells that stochastic mechanisms regulate lymphocyte differentiation. Nat Immunol. 2004;5(1):55–63. doi: 10.1038/ni1016. [DOI] [PubMed] [Google Scholar]
- 24.Schlub TE, Badovinac VP, Sabel JT, Harty JT, Davenport MP. Predicting CD62L expression during the CD8+ T-cell response in vivo. Immunol Cell Biol. 2010;88(2):157–164. doi: 10.1038/icb.2009.80. [DOI] [PMC free article] [PubMed] [Google Scholar]
- 25.Schlub TE, Venturi V, Kedzierska K, Wellard C, Doherty PC, Turner SJ, et al. Division-linked differentiation can account for CD8+ T-cell phenotype in vivo. Eur J Immunol. 2009;39(1):67–77. doi: 10.1002/eji.200838554. [DOI] [PubMed] [Google Scholar]
- 26.De Boer RJ, Homann D, Perelson AS. Different dynamics of CD4+ and CD8+ T cell responses during and after acute lymphocytic choriomeningitis virus infection. J Immunol. 2003;171(8):3928–3935. doi: 10.4049/jimmunol.171.8.3928. [DOI] [PubMed] [Google Scholar]
- 27.Rudd BD, Venturi V, Smith NL, Nzingha K, Goldberg EL, Li G, et al. Acute neonatal infections 'lock-in' a suboptimal CD8+ T cell repertoire with impaired recall responses. PLoS Pathog. 2013;9(9):e1003572. doi: 10.1371/journal.ppat.1003572. [DOI] [PMC free article] [PubMed] [Google Scholar]
- 28.Henson SM, Akbar AN. KLRG1--more than a marker for T cell senescence. Age (Dordr) 2009;31(4):285–291. doi: 10.1007/s11357-009-9100-9. [DOI] [PMC free article] [PubMed] [Google Scholar]
- 29.Chang JT, Ciocca ML, Kinjyo I, Palanivel VR, McClurkin CE, Dejong CS, et al. Asymmetric proteasome segregation as a mechanism for unequal partitioning of the transcription factor T-bet during T lymphocyte division. Immunity. 2011;34(4):492–504. doi: 10.1016/j.immuni.2011.03.017. [DOI] [PMC free article] [PubMed] [Google Scholar]
- 30.Oliaro J, Van Ham V, Sacirbegovic F, Pasam A, Bomzon Z, Pham K, et al. Asymmetric cell division of T cells upon antigen presentation uses multiple conserved mechanisms. Journal of immunology. 2010;185(1):367–375. doi: 10.4049/jimmunol.0903627. [DOI] [PMC free article] [PubMed] [Google Scholar]
- 31.Chang JT, Palanivel VR, Kinjyo I, Schambach F, Intlekofer AM, Banerjee A, et al. Asymmetric T lymphocyte division in the initiation of adaptive immune responses. Science. 2007;315(5819):1687–1691. doi: 10.1126/science.1139393. [DOI] [PubMed] [Google Scholar]
- 32.Crouse J, Kalinke U, Oxenius A. Regulation of antiviral T cell responses by type I interferons. Nat Rev Immunol. 2015;15(4):231–242. doi: 10.1038/nri3806. [DOI] [PubMed] [Google Scholar]
- 33.Kim MT, Harty JT. Impact of Inflammatory Cytokines on Effector and Memory CD8+ T Cells. Front Immunol. 2014;5:295. doi: 10.3389/fimmu.2014.00295. [DOI] [PMC free article] [PubMed] [Google Scholar]
- 34.Li G, Ju J, Weyand CM, Goronzy JJ. Age-Associated Failure To Adjust Type I IFN Receptor Signaling Thresholds after T Cell Activation. J Immunol. 2015 doi: 10.4049/jimmunol.1402389. [DOI] [PMC free article] [PubMed] [Google Scholar]
- 35.D'Souza WN, Hedrick SM. Cutting edge: latecomer CD8 T cells are imprinted with a unique differentiation program. J Immunol. 2006;177(2):777–781. doi: 10.4049/jimmunol.177.2.777. [DOI] [PMC free article] [PubMed] [Google Scholar]
- 36.Quah BJ, Warren HS, Parish CR. Monitoring lymphocyte proliferation in vitro and in vivo with the intracellular fluorescent dye carboxyfluorescein diacetate succinimidyl ester. Nat Protoc. 2007;2(9):2049–2056. doi: 10.1038/nprot.2007.296. [DOI] [PubMed] [Google Scholar]
- 37.Gett AV, Hodgkin PD. A cellular calculus for signal integration by T cells. Nat Immunol. 2000;1(3):239–244. doi: 10.1038/79782. [DOI] [PubMed] [Google Scholar]
- 38.Hommel M, Hodgkin PD. TCR affinity promotes CD8+ T cell expansion by regulating survival. J Immunol. 2007;179(4):2250–2260. doi: 10.4049/jimmunol.179.4.2250. [DOI] [PubMed] [Google Scholar]
- 39.Marchingo JM, Kan A, Sutherland RM, Duffy KR, Wellard CJ, Belz GT, et al. T cell signaling Antigen affinity, costimulation, and cytokine inputs sum linearly to amplify T cell expansion. Science. 2014;346(6213):1123–1127. doi: 10.1126/science.1260044. [DOI] [PubMed] [Google Scholar]
- 40.Althaus CL, Ganusov VV, De Boer RJ. Dynamics of CD8+ T cell responses during acute and chronic lymphocytic choriomeningitis virus infection. J Immunol. 2007;179(5):2944–2951. doi: 10.4049/jimmunol.179.5.2944. [DOI] [PubMed] [Google Scholar]
- 41.De Boer RJ, Oprea M, Antia R, Murali-Krishna K, Ahmed R, Perelson AS. Recruitment times, proliferation, and apoptosis rates during the CD8(+) T-cell response to lymphocytic choriomeningitis virus. J Virol. 2001;75(22):10663–10669. doi: 10.1128/JVI.75.22.10663-10669.2001. [DOI] [PMC free article] [PubMed] [Google Scholar]
- 42.Blattman JN, Antia R, Sourdive DJ, Wang X, Kaech SM, Murali-Krishna K, et al. Estimating the precursor frequency of naive antigen-specific CD8 T cells. J Exp Med. 2002;195(5):657–664. doi: 10.1084/jem.20001021. [DOI] [PMC free article] [PubMed] [Google Scholar]
- 43.Badovinac VP, Messingham KA, Hamilton SE, Harty JT. Regulation of CD8+ T cells undergoing primary and secondary responses to infection in the same host. J Immunol. 2003;170(10):4933–4942. doi: 10.4049/jimmunol.170.10.4933. [DOI] [PubMed] [Google Scholar]
- 44.Wherry EJ, Teichgraber V, Becker TC, Masopust D, Kaech SM, Antia R, et al. Lineage relationship and protective immunity of memory CD8 T cell subsets. Nat Immunol. 2003;4(3):225–234. doi: 10.1038/ni889. [DOI] [PubMed] [Google Scholar]
- 45.Seedhom MO, Jellison ER, Daniels KA, Welsh RM. High frequencies of virus-specific CD8+ T-cell precursors. J Virol. 2009;83(24):12907–12916. doi: 10.1128/JVI.01722-09. [DOI] [PMC free article] [PubMed] [Google Scholar]
- 46.Hodgkin PD, Lee JH, Lyons AB. B cell differentiation and isotype switching is related to division cycle number. J Exp Med. 1996;184(1):277–281. doi: 10.1084/jem.184.1.277. [DOI] [PMC free article] [PubMed] [Google Scholar]
Associated Data
This section collects any data citations, data availability statements, or supplementary materials included in this article.