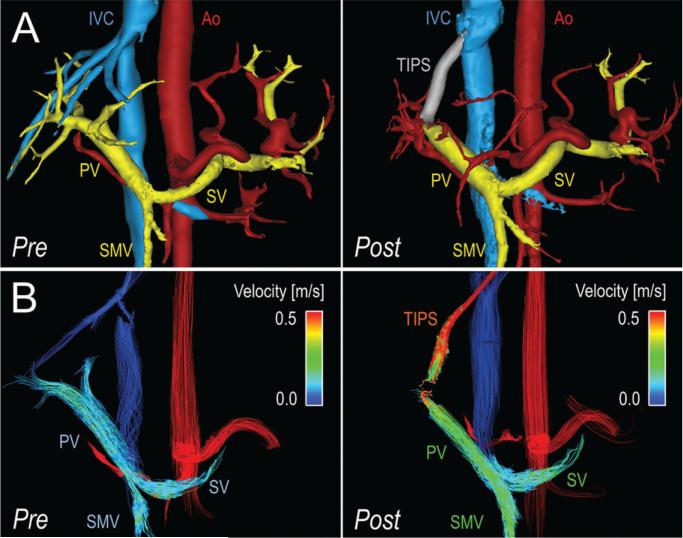
Figure 1.
Four-dimensional–flow MR imaging– based visualization and quantification of hemodynamics in the portal system before and after TIPS placement in a 54-year-old man with portal hypertension and refractory ascites. A, Segmentation of 4D-flow angiograms obtained before (pre) and 2 weeks after (post) TIPS placement show arteries (red), veins (blue), portal vasculature (yellow), and TIPS (gray). B, Velocity-coded 4D-flow MR images obtained before (pre) and 2 weeks after (post) TIPS placement show velocity distribution in the portal circulation, which is indicated by color-coded streamlines that show increased blood flow in the SMV, SV, and PV in response to TIPS placement. Note the high velocity in the TIPS, with a signal dropout at the proximal end of the TIPS due to disordered flow. In this patient (subject 6 in Table 1), TIPS placement successfully reduced ascites but induced hepatic encephalopathy. Ao = aorta, IVC = Inferior vena cava.

