

Abstract
In mouse models of Huntington’s disease (HD), striatal neuron properties are significantly altered. These alterations predict changes in striatal output regions. However, little is known about alterations in those regions. In the present study we examined changes in passive and active membrane properties of neurons in the external globus pallidus (GPe), the first relay station of the indirect pathway, in the R6/2 mouse model of juvenile HD at pre- (1 mo) and symptomatic (2 mo) stages. In GPe, two principal types of neurons can be distinguished based on firing properties and the presence (type A) or absence (type B) of Ih currents. In symptomatic animals (2 mo), cell membrane capacitance and input resistance of type A neurons were increased compared to controls. In addition, action potential after-hyperpolarization amplitude was reduced. Although the spontaneous firing rate of GPe neurons was not different between control and R6/2 mice, the number of spikes evoked by depolarizing current pulses was significantly reduced in symptomatic R6/2 animals. In addition, these changes were accompanied by altered firing patterns evidenced by increased inter-spike interval variation and increased number of bursts. Blockade of GABAA receptors facilitated bursting activity in R6/2 mice but not in control littermates. Thus, alterations in firing patterns could be caused by changes in intrinsic membrane conductances and modulated by synaptic inputs.
Keywords: Huntington’s disease, globus pallidus, mouse model, electrophysiology
Graphical abstract
In Huntington’s disease (HD) striatal neurons are lost. How this affects output structures is unknown. Here we studied alterations in the external globus pallidus (GPe), the first relay station of the indirect pathway, in the R6/2 mouse model of juvenile HD. Although the spontaneous firing rate of GPe neurons was not different between control and R6/2 mice, the firing patterns were altered as evidenced by increased inter-spike interval variation and increased number of bursts.
Introduction
A massive loss of striatal medium-sized spiny neurons (MSNs) occurs in Huntington’s disease (HD) (Vonsattel and DiFiglia, 1998). As MSNs from the dorsal striatum give rise to two distinct output pathways, direct and indirect, it can be predicted that changes in striatal neurons should alter the properties of cells in output regions, external globus pallidus (GPe) for the indirect pathway and substantia nigra pars reticulata (SNr) for the direct pathway. It is believed that MSNs of the indirect pathway are more vulnerable than MSNs giving rise to the direct pathway (Reiner et al., 1988; Albin et al., 1992). Cells in the first relay nucleus of the indirect pathway, the GPe, receive GABAergic inputs from dopamine (DA) D2 receptor- and enkephalin-containing MSNs, as well as glutamatergic projections from the thalamus and the subthalamic nucleus (STN) (Kita, 2010). Cells in the GPe, in turn, send a major GABAergic projection to the STN and a minor but significant projection to the dorsal striatum (Voorn, 2010).
Several types of neurons have been characterized in the GPe of rodents (Kita and Kitai, 1991; Cooper and Stanford, 2000; Chan et al., 2004; Bugaysen et al., 2010; Hegeman et al., 2016). The most prevalent (type A) is GABAergic, expresses parvalbumin (PV), projects to the STN, and displays delayed rectification (sag) caused by a prominent hyperpolarization-activated current (Ih). One third of neurons (type B) have no Ih and display a fast monophasic action potential (AP) after-hyperpolarization (AHP). A smaller percentage of neurons (type C), probably cholinergic, have no Ih and display prolonged biphasic AHPs (Cooper and Stanford, 2000). Based on projection patterns, GPe neurons are also classified as prototypical (projecting to STN) or arkypallidal (projecting to the striatum) (Mallet et al., 2012; Abdi et al., 2015).
In HD, the preferential loss of D2-MSN inhibitory input to GPe is hypothesized to induce a disinhibition of PV-expressing neurons that project to the STN. Reduced output from glutamatergic STN neurons would then reduce SNr output, leading to disinhibition of thalamocortical pathways and ultimately abnormal, choreic movements (Reiner et al., 1988; Albin et al., 1992). Thus, GPe lesions or inhibitory deep brain stimulation (DBS) have been used to restore the balance of basal ganglia structures to ameliorate chorea (Reiner, 2004; Temel et al., 2006; Ligot et al., 2011; Nagel et al., 2015). Although reduced volume of the GPe is a pathological sequela of MSN input loss (van den Bogaard et al., 2011; Waldvogel et al., 2015), whether or not GPe neurons are actually lost remains unknown. While some studies reported cell loss (Lange et al., 1976; Vonsattel and DiFiglia, 1998), another study found no change in cell numbers (Wakai et al., 1993).
Although in most HD models striatal cell loss is mild, MSNs undergo important morphological and electrophysiological alterations. In particular, striatal MSNs become more excitable and fire more frequently with disease progression due to reduced K+ conductances, depolarized resting membrane potentials (RMP), and increased input resistances (Levine et al., 1999; Klapstein et al., 2001; Ariano et al., 2005; Rebec et al., 2006; Cepeda et al., 2007; Miller et al., 2008). However, MSNs, in particular D2 receptor-containing, also are subjected to increased inhibitory inputs from multiple sources, which could hamper striatal output to the GPe (Cepeda et al., 2004; Cepeda et al., 2013). How changes in striatal output affect structures in the indirect or direct pathways is presently unknown. Here, we used electrophysiological and morphological tools to examine alterations of GPe neurons in the R6/2 mouse model of HD. The data obtained in the present study point to time-dependent disturbances in passive and active membrane properties of GPe neurons in HD mice.
Methods
Animals
All procedures were performed in accordance with the U.S. Public Health Service Guide for Care and Use of Laboratory Animals and were approved by the Institutional Animal Care and Use Committee at the University of California Los Angeles. Mice were obtained from our R6/2 breeding colony. Experimental mice were housed on a 12 h light-dark cycle with lights on from 7:00-19:00. Food and water were available ad libitum. Genotyping was performed using PCR of DNA obtained from tail samples, once at weaning and again following the completion of electrophysiological experiments to confirm the genotype. CAG repeat lengths for R6/2 mice were determined by Laragen Inc. (Culver City, CA) and found to be 151±2 (mean±SEM, n=19). Two groups of R6/2 mice were examined: a presymptomatic group (1 mo) and a symptomatic group (2 mo).
Electrophysiology
Mice were deeply anesthetized with isoflurane and intracardially perfused with 10 ml of ice-cold N-methyl-D-glucamine (NMDG)-based slice solution containing (in mM): 92 NMDG, 85 HCl, 20 HEPES, 2.5 KCl, 30 NaHCO3, 1.25 NaH2PO4, 10 MgSO4, 0.5 CaCl2. They were then decapitated and the brains rapidly removed and placed in the same solution. Sagittal slices (300 μm) were cut and incubated in regular artificial cerebrospinal fluid (ACSF) containing (in mM): 130 NaCl, 26 NaHCO3, 1.25 NaH2PO4, 3 KCl, 2 MgCl2, 2 CaCl2, and 10 glucose (pH 7.2-7.35, 290-310 mOsm), and oxygenated with 95% O2 - 5% CO2. Slices were allowed to recover for 30 min in warm (32°C) ACSF and then at room temperature for at least 1h before recordings. Whole-cell patch-clamp recordings were obtained in voltage or current clamp mode using a MultiClamp 700B amplifier (Molecular Devices) and pClamp (version 10.2) software. For voltage and current clamp recordings (used to determine passive and active membrane properties and firing patterns) the pipette was filled with a K-gluconate-based internal solution containing (in mM): 112.5 K-gluconate, 17.5 KCl, 10 HEPES, 5 EGTA, 4 NaCl, 0.5 CaCl2, 1 MgCl2, 5 Na2ATP, 1 GTP. Electrode access resistances were <25 MΩ. Biocytin (2%) was added for cell identification and morphology. Somatic areas were calculated from digital images of biocytin-filled neurons by manually outlining the cell body and area was estimated using ImageJ software (NIH).
Passive cell membrane properties were determined in voltage clamp mode (Vh=−70 mV) by applying a depolarizing step voltage command (10 mV) and using the membrane test function integrated in the pClamp software. This function reports cell membrane capacitance (in pF), input resistance (in MΩ) and decay time constant (in ms). Spontaneous firing was recorded in current clamp mode. Current-voltage (I-V) relationships were generated by applying 500 ms current pulses starting at −300 pA, with 50 pA increments. The RMP and AP properties of GPe neurons were measured using the Clampfit software. In addition, the threshold membrane potential for AP generation, AHP amplitude, spike adaptation and sag amplitude and ratios also were calculated. Spike frequency, inter-spike intervals, coefficients of variation (CV) and burst numbers per recording period were calculated using the threshold search method. By testing the combination of specified intervals and number of spikes in a burst we found that a 500 ms interval with 3 spikes in the burst provided the best estimate to examine the number of bursts in the spike trains. Cells were considered as spiking with bursts if in a 90 sec interval at least 2 bursts occurred.
Statistical Analyses
All values in figures and text are presented as mean±SEM. Differences between group means were assessed with Student’s t-tests and, when comparing more than two groups, with appropriately designed one- or two-way ANOVAs with Bonferroni post-hoc correction. Differences in proportions were estimated using Chi-square test. Differences were considered statistically significant if p<0.05. SigmaStat 3.5 (Systat Software, San Jose, CA) was used to perform all statistical analyses.
Results
Cell types in GPe of WT and R6/2 mice
In agreement with earlier reports (Kita and Kitai, 1991; Cooper and Stanford, 2000; Bugaysen et al., 2010) we observed two principal types of GPe cells which could be identified by distinct current-voltage (I-V) relationships (Fig. 1A, B). Typically, a population of cells (type A) displayed a pronounced time- and voltage-dependent rectification (Ih or sag) at hyperpolarized membrane potentials due to activation of hyperpolarization-activated, cyclic nucleotide-gated cation (HCN) channels. A second population of GPe cells did not have this prominent sag (type B). Eight cells (3 of 15 cells in young WT mice, 1 of 24 cells in older WT mice and 4 of 34 cells in older R6/2 mice) were characterized by the absence of sag potentials and rebound depolarizations, as well as the presence of prolonged AHPs and could correspond to the scarce type C cells, putative cholinergic interneurons (Cooper and Stanford, 2000). These cells were excluded from further analysis. The proportions of type A (58.3% in 1 mo and 56.5% in 2 mo old) and type B (41.7% in 1 mo and 43.5% in 2 mo old) cells in WT mice were almost identical at 1 mo and 2 mo (p=0.918, Chi-square test). Although more type A (66.6%) and less type B (33.3%) cells were recorded in R6/2 mice at 1 mo, the difference was not statistically significant (p=0.643, Chisquare test). In 2 mo R6/2 mice the proportions of type A and B cells were identical (50%). This indicates that, overall, we were sampling similar cell populations in WT and R6/2 mice.
Fig. 1.

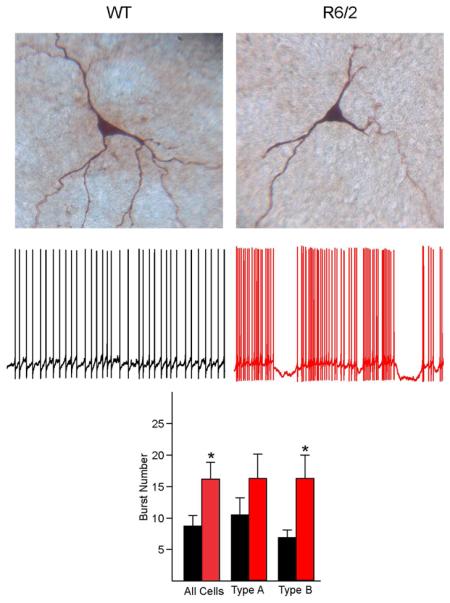
Traces show typical I-V relationships (500 ms current pulses starting at −300 pA, with 50 pA increments) of GPe neurons in WT and R6/2 mice. Based on the presence or absence of hyperpolarization-activated cation currents (Ih or sag), GPe neurons from both WT and R6/2 mice could be divided into two main groups, one (A) with prominent Ih (type A) and one (B) without prominent Ih (type B). Images on top of the traces show examples of biocytin-filled type A and type B cells in WT and R6/2 mice (2 mo). Notice decreased firing regularity in cells from R6/2 animals.
Passive membrane properties of GPe neurons
Basic membrane properties were measured in voltage clamp mode. Cell membrane capacitance (Cm), input resistance (Rm) and decay time constant (tau) were not different between WT (n=12 cells) and R6/2 mice (n=18 cells) at 1 mo (Table 1). Similarly, at 2 mo these membrane properties in R6/2 mice were not significantly different from those in WT mice when all cells (n=23 in WT and n=30 in R6/2) were pooled together, except for tau which was increased (Table 1). However, more differences emerged when the two main neuronal subtypes were separated (statistical tests used two-way ANOVAs with Bonferroni post-hoc t-tests). Type A neurons from R6/2 mice had increased Cm (n=15 and 13 respectively, p=0.032) and Rm (p=0.006) compared to type A cells in WT mice. These cells also had significantly longer tau values, consistent with increased cell capacitance. As cell capacitance reflects membrane area, to further investigate the differences found in type A cells at 2 mo we measured cell body areas from WT (n=9) and R6/2 (n=5) mice after biocytin staining. Compared to WT mice the average somatic area in R6/2 mice was significantly larger (R6/2; 216.7±8.9 μm2 vs. WT; 152.7±14.1 μm2, p=0.003, Student’s t-test), supporting changes in cell membrane capacitance. No significant differences in passive membrane properties were found in type B cells at 2 mo (n=10 WT and n=15 R6/2).
Table 1.
Intrinsic Membrane Properties of GPe Neurons from WT and R6/2 Mice
| All Cells | Type A Cells | Type B Cells | ||||
|---|---|---|---|---|---|---|
| 1 mo | WT (n=12) | R6/2 (n=18) | WT (n=7) | R6/2 (n=12) | WT (n=5) | R6/2 (n=6) |
|
| ||||||
| Cm (pF) | 35.5±4 | 35.4±5 | 30.7±5 | 32.3±5 | 42.1±6 | 41.4±10 |
| Rm (MΩ) | 274±50 | 232±24 | 358±67 | 242±31 | 157±32 | 209±33 |
| Tau (ms) | 0.51±0.1 | 0.46±0.01 | 0.35±0.08 | 0.53±0.15 | 0.69±0.16 | 0.59±0.22 |
| RMP (mV) | −56.13±1.4 | −50.35±1.5* | −54.8±1.8 | −51.41±1.9 | −58.1±2.3 | −48.2±3.5 (p=0.053) |
| AP threshold (mV) | −38.84±1.4 | −35.72±1.7 | −39.47±1.2 | −36.24±1.3 | −37.97±3.2 | −34.7±4.6 |
| AP-half width (ms) | 0.87±0.06 | 0.72±0.06 | 1.01±0.06 | 0.67±0.08** | 0.68±0.02 | 0.80±0.1 |
| AHP amplitude (mV) | −18.18±0.9 | −20.44±1.3 | −17.7±1.1 | −21.1±1.3 | −18.9±1.9 | −19.1±3.0 |
| AHP time to peak (ms) | 1.23±0.13 | 0.96±0.07 | 1.48±0.16 | 0.95±0.10** | 0.88±0.08 | 0.97±0.09 |
| Sag amplitude (mV) | 27.7±1.4 | 24.54 ± 3.7 | ||||
|
| ||||||
| 2 mo | WT (n=23) | R6/2 (n=30) | WT (n=13) | R6/2 (n=15) | WT (n=10) | R6/2 (n=15) |
|
| ||||||
| Cm (pF) | 34.3±3 | 41.9±3 | 27.4± 3 | 39.8±3* | 43.2±6 | 43.9±5 |
| Rm (MΩ) | 240±32 | 283±26 | 229±33 | 368±40** | 254±61 | 198±15 |
| Tau (ms) | 0.43±0.05 | 0.81±0.08*** | 0.32±0.04 | 0.64±0.08** | 0.58±0.07 | 0.89±0.13 (p=0.057) |
| RMP (mV) | −54.4±1.1 | −54.7±1.1 | −54.9±1.1 | −54.8±1.5 | −53.6±2.1 | −54.5±1.5 |
| AP threshold (mV) | −39.7±0.9 | −40.0±0.9 | −38.4±1.0 | −38.8± 1.4 | −41.5±1.5 | −41.1±1.2 |
| AP-half width (ms) | 0.63±0.04 | 0.70±0.05 | 0.62±0.04 | 0.78±0.07 | 0.64±0.08 | 0.62±0.05 |
| AHP amplitude (mV) | −21.7±1.0 | −19.7±0.9 | −21.9±0.9 | −17.9±1.3* | −21.4±2.0 | −21.6±1.2 |
| AHP time to peak (ms) | 0.95±0.06 | 1.07±0.08 | 0.93±0.04 | 1.19±0.10 | 0.97±0.10 | 0.95±0.10 |
| Sag amplitude (mV) | 28.8±2.6 | 23.0±3.6 | ||||
Multiple comparisons of passive and active membrane properties between type A and type B cells from WT and R6/2 mice at 1 mo and 2 mo were analyzed using two-way ANOVA with Bonferroni post-hoc t-test. Cm=cell membrane capacitance, Rm=membrane input resistance, AP=action potential, AHP=AP after-hyperpolarization.
p< 0.05,
p< 0.01,
p<0.001
Active Membrane Properties and Excitability of GPe Neurons
In 1 mo mice the RMP of GPe neurons (pooled) was more depolarized than in WTs (R6/2 n=18 and WT n=12, p<0.05). This difference was mainly due to changes in type B neurons (p=0.053, Table 1). One potential caveat with this finding is that, although the difference in RMP was statistically significant, the number of type B cells encountered at this age was relatively low (R6/2; n=6 and WT; n=5). In addition, the RMP in symptomatic R6/2 mice was not significantly different when cells were grouped together nor when separated into types A and B. Another parameter that was different in presymptomatic R6/2 mice was the half-amplitude duration of APs, which affected selectively type A neurons (p=0.002) (Table 1). However, in symptomatic animals half-amplitude duration of APs was not significantly altered. In contrast, the AHP amplitude of APs was decreased in R6/2 type A neurons compared with WTs (p=0.036). No significant differences were observed in active membrane properties in type B neurons.
Changes in Spontaneous Firing Patterns and Loss of Pacemaking Ability in R6/2 mice
First we recorded a subset of GPe neurons from 2 mo WT and R6/2 mice in cell attached mode. Consistent with previous studies, firing rates among GPe neurons vary widely (Bugaysen et al., 2010; Deister et al., 2013). In our population, the range was 1-64 Hz in WT and 1-46 Hz in R6/2 cells. The average firing rates were not significantly different between WT and symptomatic R6/2 mice (21.3±5.8 Hz, n=12 cells in WT and 16.4±3.3 Hz n=14 cells in R6/2, p=0.453, Student’s t-test,).
To examine spontaneous firing properties in relation to the two principal types of GPe neurons in R6/2 and WT mice we recorded the cells in the whole-cell configuration in current clamp mode. Most but not all of the cells were spontaneously active. In 1 mo WT mice 10/12 cells (83.3%) were spontaneously active, while in 2 mo WT mice 16/23 cells (69.6%) showed spontaneous activity. In R6/2 mice, the percent of firing neurons was identical, 83.3% (15/18 cells) at 1 mo and 83.3% (25/30 cells) at 2 mo. No significant differences in spontaneous firing rates were found in both 1 and 2 mo R6/2 mice compared to age-matched WTs when all cells were pooled nor when separated into the two types (Fig. 2B and 3B).
Fig. 2.

A. Spontaneous firing patterns of type A and type B GPe neurons in presymptomatic (1 mo) R6/2 mice and age-matched WT mice. B. Graphs illustrate average firing rates and burst numbers between WT and R6/2 mice. Compared to WTs, R6/2 mice showed a significant increase in burst numbers when both cell types were pooled. C. Coefficients of variation (CV) of inter-spike intervals also were significantly increased due to more firing irregularity of R6/2 neurons.
Fig. 3.

A. Spontaneous firing patterns of type A and type B GPe neurons in symptomatic (2 mo) R6/2 mice and age-matched WT mice. B. At 2 mo the burst numbers were increased, similar to presymptomatic animals. Spontaneous firing rates were not different. C. The average CVs were not different between WT and R62 mice. This was due to the fact that two populations of cells could be distinguished in R6/2 mice, some with low CV values and some with high CV values. Proportionately, more R6/2 neurons had high CV values. In addition, about 20% of neurons displayed membrane oscillations consisting of rhythmic depolarizations and bursts followed by hyperpolarizations. This unique firing pattern was not observed in cells from WT mice.
Both WT and R6/2 neurons displayed bursts of APs (Figs. 2A and 3A). Compared with WTs, the percent of bursting cells was reduced in 1 and 2 mo R6/2 mice. However, the difference was not statistically significant. Thus, in 1 mo R6/2 mice the percent of bursting cells made up 55.3% (8 of 15 spiking cells) compared with 70% (7 of 10 spiking cells) in WT mice (p=0.41, Chi-square test), and in 2 mo R6/2 mice bursting cells comprised 60% (15/25 spiking cells) compared with 81.3% (13/16 spiking cells) in WTs (p=0.15, Chi square). Interestingly, in bursting neurons from both 1 and 2 mo R6/2 mice the average number of bursts increased significantly compared to WT mice (p=0.04, Student’s t-test) (Fig. 2B and 3B). To further estimate the regularity of spontaneous spiking, CV of inter-spike intervals also was calculated. As expected, in the 1 mo group the mean CV of R6/2 mice was significantly higher than that of WT mice (Fig. 2B, p=0.02, Student’s t-test). In contrast, there was no difference in CV of inter-spike intervals between R6/2 and WT mice in the symptomatic group (Fig. 3C, p=0.69, Student’s t-test). However, histograms of CV from R6/2 mice revealed a clear separation of cells into two groups; one with small and another with high CV values. Taking 0.8 as the cutoff value, 27% of WT cells had high CV, whereas 54% of R6/2 cells had high CV (p=0.092, Chi square). The most parsimonious explanation is that there are two populations of cells in 2 mo R6/2 mice; a population of cells firing regularly and another population firing predominantly in bursts. Overall R6/2 neurons in both age groups displayed more bursting activity and about 10-20% of bursting neurons displayed membrane oscillations consisting of rhythmic depolarizations and bursts followed by long hyper-polarizations (Figs. 2A and 3A). This unique firing pattern was not observed in cells from WT mice.
Changes in Evoked Firing
To examine differences in GPe neuronal excitability in R6/2 and WT mice we recorded responses to a small depolarizing current step (25 pA) of relatively long duration (1500 ms). This method allows estimation of spiking properties not only in spontaneously active neurons, but also in cells with low or no spontaneous spiking. The number of APs, the firing rate and the CV of inter-spike intervals were estimated. If data were separated by cell type strong trends were found but did not reach statistical significance. However, there were age- and genotype-dependent differences in AP numbers and firing patterns in 1 and 2 mo mice when all cells were pooled (Fig. 4C, one-way ANOVA, p<0.001). Compared with 2 mo WT mice the 1 mo WT mice had a significantly higher number of APs per step duration (Fig. 4C, 1 mo WT; 30.2±4.1 vs. 2 mo WT; 17.9±2.3, p=0.02), higher firing rate (1 mo WT: 20.2±2.7 Hz vs. 2 mo WT: 12.2±1.5 Hz, p=0.02) and had more regular firing based on the values of CV of inter-spike intervals (p=0.03) (Fig. 4D). The induced firing rate in 1 mo R6/2 mice was not significantly different from that in WTs (R6/2; 19.4±1.7 Hz vs. WT; 20.2±2.7 Hz, p=0.81), nor was the regularity of spiking (CV, p=0.59). In contrast, compared to WTs the 2 mo R6/2 animals showed significantly reduced number of spikes (p=0.04), increased CV (p=0.03) due to more variable firing in type B neurons, and a strong trend for reduced firing rate (R6/2; 8.1±1.4 Hz vs. WT; 12.2±1.5 Hz, p=0.07).
Fig. 4.

GPe neurons in R6/2 and WT mice respond differently to small, prolonged depolarizing current injections. The traces show responses of GPe neurons to 25 pA depolarizing current steps of 1500 ms duration in 1 mo (A) and 2 mo (B) mice. (C) Bar graphs summarize the number of spikes per step and the CV (D) of inter-spike intervals in R6/2 mice and age-matched WTs. Asterisks above the bars indicate p<0.05.
Effects of GABAA Receptor Blockade on Spontaneous Firing
To examine the potential contribution of inhibitory inputs on firing pattern alterations in GPe neurons, we bath applied the selective GABAA receptor antagonist bicuculline (BIC, 10-20 μM) to slices from WT and R6/2 mice. In this experiment all but one of the recorded neurons (n=21) were type A (i.e., displayed prominent Ih current). BIC produced differential effects in GPe neurons. In cells from WT animals, BIC had no effect (n=4) or reduced spontaneous firing (n=7). In contrast, in cells from R6/2 mice, BIC produced no change (n=1), reduced spontaneous firing (n=4), or induced/ exacerbated bursting activity (n=5) (Fig. 5). The difference in distributions was statistically significantly (Table 2, p=0.008, Chi-square). This indicates that antagonism of GABAA receptors facilitates the occurrence of bursts specifically in GPe type A neurons from R6/2 mice. Incidentally, glutamate receptor blockers did not affect firing rates or patterns (not shown).
Fig. 5.

GPe neurons in slices from symptomatic R6/2 and WT mice respond differently to BIC (20 μM). Panels in A show the recorded cells filled with biocytin. B. Spontaneous firing of WT and R6/2 neurons during control (ACSF) conditions. C. In the WT cell BIC reduced the firing frequency of the GPe neuron. In contrast, in the cell from the R6/2 mouse BIC induced rhythmic bursts of APs.
Table 2.
Effects of BIC on Spontaneous Firing of GPe cells in WT and R6/2 Mice (2 mo)
| WT (n=12 cells) | R6/2 (n=10 cells) | |
|---|---|---|
| No Change | 4 (33.3%) | 1 (10%) |
| Hyperpolarization/Reduced Firing | 7 (58.3%) | 4 (40%) |
| Burst Enhancement | 1 (8.3%) | 5 (50%) |
Chi-square, p=0.008
Discussion
The present results reveal unique alterations of GPe neurons in the R6/2 mouse model of HD. Overall more changes were observed in type A neurons. At 1 mo, type A neurons showed reduced AP half-amplitude duration and AHP time to peak. At 2 mo, type A neurons in R6/2 mice displayed increased membrane capacitance and input resistance but reduced AHP amplitude of APs. Alterations in the firing properties of the GPe neurons were found in both 1 mo and 2 mo R6/2 mice. Although spontaneous firing rates were not significantly altered, evoked firing was decreased at 2 mo. Increases in burst number and CV of inter-spike intervals also were observed, indicating more irregularity of spontaneous firing. In addition, some cells at both ages displayed aberrant rhythmic membrane oscillations. This firing pattern was only observed in cells from R6/2 mice.
Cell capacitance was increased in type A neurons from symptomatic R6/2 animals. This change was unexpected and contrasts with findings in striatal and cortical output neurons, which display significant decreases in membrane capacitance, reflecting loss of dendritic spines and reduced somatic areas. One of the reasons for increased cell capacitance in type A cells of the symptomatic group could be that the population of type A cells may not be as homogeneous as previously thought. Recently, using (Lhx6)-Cre and (PV)-Cre mice, two populations of cells were described in GPe (Mastro et al., 2014). These cells were not distinguished by the sag at hyperpolarized potentials, but had significantly different membrane input resistance and capacitance. Interestingly, the cells were also significantly different with respect to AP half-amplitude duration and AHP amplitude, the cell parameters affected in type A neurons of symptomatic R6/2 mice. Despite increased cell membrane capacitance, Rm also was increased in type A GPe neurons. This increase has been observed in striatal and cortical projection neurons, suggesting this is a general phenomenon probably due to loss of K+ channels more than a loss of membrane area (Klapstein et al., 2001; Ariano et al., 2005).
One of the more important findings stemming from the present study is the alteration of firing patterns and the loss of pacemaking ability of GPe neurons. The cause of this disruption remains unknown but there are a number of possibilities. Reductions in AP AHP amplitude point to changes in Ca2+ activated K+ conductances. It also is possible that HCN channels, which participate in GPe cell pacemaking (Chan et al., 2004), become altered by the mutation. Although in the present study we did not find significant differences in sag ratios between WT and R6/2 type A neurons, additional studies in voltage clamp mode, which allow a better estimate of changes in current amplitude and kinetics, are necessary. Whichever the intimate mechanism of cell firing disruption, our observations warrant further studies on K+ channel dysfunction in the GPe of HD mice. Interestingly, we recently reported that the regular firing of striatal cholinergic interneurons also is disrupted in R6/2 mice (Holley et al., 2015) and this might be a more general property of basal ganglia neurons that are spontaneously active in slice preparations.
Single-unit recordings from GPe neurons in human patients with HD are scarce. In one early stage HD patient with 41 CAG repeats and chorea, spontaneous firing of GPe neurons was increased compared with a large cohort of Parkinsonian patients, an effect in line with early loss of indirect pathway MSNs (Starr et al., 2008). In HD animal models the results have been inconsistent. While ablation of the caudate nucleus leads to decreased firing rates in GP-entopeduncular nucleus (Levine et al., 1982), ibotenic or quinolinic acid lesions that better replicate neuronal loss in HD, induced increases in discharge rate and reduced CV, supporting the disinhibition hypothesis (Sachdev et al., 1989; Nakao et al., 1999). However, in transgenic HD rats, regular firing units showed decreased frequencies while those in the subthalamic nucleus displayed increased frequencies (Vlamings et al., 2012). This study, as well as ours, suggests that the classical assumption that reduced GABA output from D2 MSNs produces disinhibition of GPe neurons (Reiner et al., 1988) needs to be reconsidered, at least in rodent models (Calabresi et al., 2014). In the present study no significant differences in spontaneous firing rates were observed and, if anything, evoked firing was reduced in 2 mo R6/2 mice.
Clearly, an important caveat is that current mouse models of HD do not replicate faithfully the motor symptoms, including chorea, observed in HD patients (Levine et al., 2004). However, with disease progression, akinesia is observed in both mice and humans. Importantly, instead of an indiscriminate increase in firing, we found a change in firing patterns along with increased CV and bursting, even in the presence of BIC. This alteration is similar to that occurring in Parkinson’s disease, with a progressive decline in autonomous GPe pacemaking and the emergence of rhythmic spiking due to downregulation of HCN channels (Chan et al., 2004). This downregulation is due to alterations in both transcriptional and trafficking mechanisms (Chan et al., 2011). How these two seemingly disparate pathologies lead to similar alterations in GPe neurons remains unknown. However, it is important to indicate that, with disease progression, the levels of dopamine also are significantly reduced in HD mice (Johnson et al., 2006; Ortiz et al., 2012), which could affect discharge patterns of GPe neurons. As with animal models of Parkinson’s disease, it may be possible that viral delivery of HCN2 subunits can restore pacemaking ability and suppress rhythmic burst spiking in GPe neurons from HD mice (He et al., 2014).
Significance Statement.
Huntington’s disease (HD) is a devastating hereditary neurological disorder manifested by motor, cognitive and psychiatric disturbances. Currently there is no cure and patients succumb to the disease 10-20 years after diagnosis. The principal pathology in the brain is the loss of neurons in the striatum, a centrally located region that regulates motor behaviors. However, other areas also are affected. In this study we characterized changes in the external globus pallidus, which receives inputs from the striatum. Using a mouse model of HD we found significant alterations in intrinsic cell membrane properties and firing patterns.
Acknowledgments
This paper is dedicated to the memory of Dr. Garnik Akopian who unfortunately passed away during the course of this study. We would like to acknowledge the help of Donna Crandall for the illustrations. Support was provided by NIH grant NS41574.
Footnotes
Conflict of Interest
The authors declare they do not have competing conflicts of interest to report.
Role of Authors
All authors had full access to the data and take responsibility for the integrity and accuracy of the analyses. GA, JB, and CC performed the experiments and analyzed the data. The work was directed by MSL. All authors collaborated on writing and editing the manuscript.
References
- Abdi A, Mallet N, Mohamed FY, Sharott A, Dodson PD, Nakamura KC, Suri S, Avery SV, Larvin JT, Garas FN, Garas SN, Vinciati F, Morin S, Bezard E, Baufreton J, Magill PJ. Prototypic and arkypallidal neurons in the dopamine-intact external globus pallidus. J Neurosci. 2015;35:6667–6688. doi: 10.1523/JNEUROSCI.4662-14.2015. [DOI] [PMC free article] [PubMed] [Google Scholar]
- Albin RL, Reiner A, Anderson KD, Dure LSt, Handelin B, Balfour R, Whetsell WO, Jr., Penney JB, Young AB. Preferential loss of striato-external pallidal projection neurons in presymptomatic Huntington's disease. Ann Neurol. 1992;31:425–430. doi: 10.1002/ana.410310412. [DOI] [PubMed] [Google Scholar]
- Ariano MA, Cepeda C, Calvert CR, Flores-Hernandez J, Hernandez-Echeagaray E, Klapstein GJ, Chandler SH, Aronin N, DiFiglia M, Levine MS. Striatal potassium channel dysfunction in Huntington's disease transgenic mice. J Neurophysiol. 2005;93:2565–2574. doi: 10.1152/jn.00791.2004. [DOI] [PubMed] [Google Scholar]
- Bugaysen J, Bronfeld M, Tischler H, Bar-Gad I, Korngreen A. Electrophysiological characteristics of globus pallidus neurons. PLoS One. 2010;5:e12001. doi: 10.1371/journal.pone.0012001. [DOI] [PMC free article] [PubMed] [Google Scholar]
- Calabresi P, Picconi B, Tozzi A, Ghiglieri V, Di Filippo M. Direct and indirect pathways of basal ganglia: a critical reappraisal. Nat Neurosci. 2014;17:1022–1030. doi: 10.1038/nn.3743. [DOI] [PubMed] [Google Scholar]
- Cepeda C, Wu N, Andre VM, Cummings DM, Levine MS. The corticostriatal pathway in Huntington's disease. Prog Neurobiol. 2007;81:253–271. doi: 10.1016/j.pneurobio.2006.11.001. [DOI] [PMC free article] [PubMed] [Google Scholar]
- Cepeda C, Starling AJ, Wu N, Nguyen OK, Uzgil B, Soda T, Andre VM, Ariano MA, Levine MS. Increased GABAergic function in mouse models of Huntington's disease: reversal by BDNF. J Neurosci Res. 2004;78:855–867. doi: 10.1002/jnr.20344. [DOI] [PubMed] [Google Scholar]
- Cepeda C, Galvan L, Holley SM, Rao SP, Andre VM, Botelho EP, Chen JY, Watson JB, Deisseroth K, Levine MS. Multiple sources of striatal inhibition are differentially affected in Huntington's disease mouse models. J Neurosci. 2013;33:7393–7406. doi: 10.1523/JNEUROSCI.2137-12.2013. [DOI] [PMC free article] [PubMed] [Google Scholar]
- Chan CS, Shigemoto R, Mercer JN, Surmeier DJ. HCN2 and HCN1 channels govern the regularity of autonomous pacemaking and synaptic resetting in globus pallidus neurons. J Neurosci. 2004;24:9921–9932. doi: 10.1523/JNEUROSCI.2162-04.2004. [DOI] [PMC free article] [PubMed] [Google Scholar]
- Chan CS, Glajch KE, Gertler TS, Guzman JN, Mercer JN, Lewis AS, Goldberg AB, Tkatch T, Shigemoto R, Fleming SM, Chetkovich DM, Osten P, Kita H, Surmeier DJ. HCN channelopathy in external globus pallidus neurons in models of Parkinson's disease. Nat Neurosci. 2011;14:85–92. doi: 10.1038/nn.2692. [DOI] [PMC free article] [PubMed] [Google Scholar]
- Cooper AJ, Stanford IM. Electrophysiological and morphological characteristics of three subtypes of rat globus pallidus neurone in vitro. J Physiol. 2000;527:291–304. doi: 10.1111/j.1469-7793.2000.t01-1-00291.x. Pt 2. [DOI] [PMC free article] [PubMed] [Google Scholar]
- Deister CA, Dodla R, Barraza D, Kita H, Wilson CJ. Firing rate and pattern heterogeneity in the globus pallidus arise from a single neuronal population. J Neurophysiol. 2013;109:497–506. doi: 10.1152/jn.00677.2012. [DOI] [PMC free article] [PubMed] [Google Scholar]
- He C, Chen F, Li B, Hu Z. Neurophysiology of HCN channels: from cellular functions to multiple regulations. Prog Neurobiol. 2014;112:1–23. doi: 10.1016/j.pneurobio.2013.10.001. [DOI] [PubMed] [Google Scholar]
- Hegeman DJ, Hong ES, Hernandez VM, Chan CS. The External Globus Pallidus: Progress and Perspectives. Eur J Neurosci. 2016 doi: 10.1111/ejn.13196. [DOI] [PMC free article] [PubMed] [Google Scholar]
- Holley SM, Joshi PR, Parievsky A, Galvan L, Chen JY, Fisher YE, Huynh MN, Cepeda C, Levine MS. Enhanced GABAergic Inputs Contribute to Functional Alterations of Cholinergic Interneurons in the R6/2 Mouse Model of Huntington’s Disease. ENEURO:0008-0014. 2015 doi: 10.1523/ENEURO.0008-14.2015. [DOI] [PMC free article] [PubMed] [Google Scholar]
- Johnson MA, Rajan V, Miller CE, Wightman RM. Dopamine release is severely compromised in the R6/2 mouse model of Huntington's disease. J Neurochem. 2006;97:737–746. doi: 10.1111/j.1471-4159.2006.03762.x. [DOI] [PubMed] [Google Scholar]
- Kita H. Organization of the Globus Pallidus. In: Steiner H, Tseng KY, editors. Handbook of Basal Ganglia Structure and Function. Elsevier; 2010. pp. 233–247. [Google Scholar]
- Kita H, Kitai ST. Intracellular study of rat globus pallidus neurons: membrane properties and responses to neostriatal, subthalamic and nigral stimulation. Brain Res. 1991;564:296–305. doi: 10.1016/0006-8993(91)91466-e. [DOI] [PubMed] [Google Scholar]
- Klapstein GJ, Fisher RS, Zanjani H, Cepeda C, Jokel ES, Chesselet MF, Levine MS. Electrophysiological and Morphological Changes in Striatal Spiny Neurons in R6/2 Huntington's Disease Transgenic Mice. J Neurophysiol. 2001;86:2667–2677. doi: 10.1152/jn.2001.86.6.2667. [DOI] [PubMed] [Google Scholar]
- Lange H, Thorner G, Hopf A, Schroder KF. Morphometric studies of the neuropathological changes in choreatic diseases. J Neurol Sci. 1976;28:401–425. doi: 10.1016/0022-510x(76)90114-3. [DOI] [PubMed] [Google Scholar]
- Levine MS, Hull CD, Villablanca JR, Buchwald NA, Garcia-Rill E. Effects of caudate nuclear or frontal cortical ablation in neonatal kittens or adult cats on the spontaneous firing of forebrain neurons. Brain Res. 1982;256:129–138. doi: 10.1016/0165-3806(82)90036-0. [DOI] [PubMed] [Google Scholar]
- Levine MS, Cepeda C, Hickey MA, Fleming SM, Chesselet MF. Genetic mouse models of Huntington's and Parkinson's diseases: illuminating but imperfect. Trends Neurosci. 2004;27:691–697. doi: 10.1016/j.tins.2004.08.008. [DOI] [PubMed] [Google Scholar]
- Levine MS, Klapstein GJ, Koppel A, Gruen E, Cepeda C, Vargas ME, Jokel ES, Carpenter EM, Zanjani H, Hurst RS, Efstratiadis A, Zeitlin S, Chesselet MF. Enhanced sensitivity to N-methyl-D-aspartate receptor activation in transgenic and knockin mouse models of Huntington's disease. J Neurosci Res. 1999;58:515–532. [PubMed] [Google Scholar]
- Ligot N, Krystkowiak P, Simonin C, Goldman S, Peigneux P, Van Naemen J, Monclus M, Lacroix SF, Devos D, Dujardin K, Delmaire C, Bardinet E, Delval A, Delliaux M, Defebvre L, Yelnik J, Blond S, Destee A, De Tiege X. External globus pallidus stimulation modulates brain connectivity in Huntington's disease. J Cereb Blood Flow Metab. 2011;31:41–46. doi: 10.1038/jcbfm.2010.186. [DOI] [PMC free article] [PubMed] [Google Scholar]
- Mallet N, Micklem BR, Henny P, Brown MT, Williams C, Bolam JP, Nakamura KC, Magill PJ. Dichotomous organization of the external globus pallidus. Neuron. 2012;74:1075–1086. doi: 10.1016/j.neuron.2012.04.027. [DOI] [PMC free article] [PubMed] [Google Scholar]
- Mastro KJ, Bouchard RS, Holt HA, Gittis AH. Transgenic mouse lines subdivide external segment of the globus pallidus (GPe) neurons and reveal distinct GPe output pathways. J Neurosci. 2014;34:2087–2099. doi: 10.1523/JNEUROSCI.4646-13.2014. [DOI] [PMC free article] [PubMed] [Google Scholar]
- Miller BR, Walker AG, Shah AS, Barton SJ, Rebec GV. Dysregulated information processing by medium spiny neurons in striatum of freely behaving mouse models of Huntington's disease. J Neurophysiol. 2008;100:2205–2216. doi: 10.1152/jn.90606.2008. [DOI] [PMC free article] [PubMed] [Google Scholar]
- Nagel SJ, Machado AG, Gale JT, Lobel DA, Pandya M. Preserving cortico-striatal function: deep brain stimulation in Huntington's disease. Front Syst Neurosci. 2015;9:32. doi: 10.3389/fnsys.2015.00032. [DOI] [PMC free article] [PubMed] [Google Scholar]
- Nakao N, Ogura M, Nakai K, Itakura T. Embryonic striatal grafts restore neuronal activity of the globus pallidus in a rodent model of Huntington's disease. Neuroscience. 1999;88:469–477. doi: 10.1016/s0306-4522(98)00197-3. [DOI] [PubMed] [Google Scholar]
- Ortiz AN, Osterhaus GL, Lauderdale K, Mahoney L, Fowler SC, von Horsten S, Riess O, Johnson MA. Motor function and dopamine release measurements in transgenic Huntington's disease model rats. Brain Res. 2012;1450:148–156. doi: 10.1016/j.brainres.2012.02.042. [DOI] [PMC free article] [PubMed] [Google Scholar]
- Rebec GV, Conroy SK, Barton SJ. Hyperactive striatal neurons in symptomatic Huntington R6/2 mice: variations with behavioral state and repeated ascorbate treatment. Neuroscience. 2006;137:327–336. doi: 10.1016/j.neuroscience.2005.08.062. [DOI] [PubMed] [Google Scholar]
- Reiner A. Can lesions of GPe correct HD deficits? Exp Neurol. 2004;186:1–5. doi: 10.1016/j.expneurol.2003.11.002. [DOI] [PubMed] [Google Scholar]
- Reiner A, Albin RL, Anderson KD, D'Amato CJ, Penney JB, Young AB. Differential loss of striatal projection neurons in Huntington disease. Proc Natl Acad Sci U S A. 1988;85:5733–5737. doi: 10.1073/pnas.85.15.5733. [DOI] [PMC free article] [PubMed] [Google Scholar]
- Sachdev RN, Gilman S, Aldridge JW. Effects of excitotoxic striatal lesions on single unit activity in globus pallidus and entopeduncular nucleus of the cat. Brain Res. 1989;501:295–306. doi: 10.1016/0006-8993(89)90646-x. [DOI] [PubMed] [Google Scholar]
- Starr PA, Kang GA, Heath S, Shimamoto S, Turner RS. Pallidal neuronal discharge in Huntington's disease: support for selective loss of striatal cells originating the indirect pathway. Exp Neurol. 2008;211:227–233. doi: 10.1016/j.expneurol.2008.01.023. [DOI] [PMC free article] [PubMed] [Google Scholar]
- Temel Y, Cao C, Vlamings R, Blokland A, Ozen H, Steinbusch HW, Michelsen KA, von Horsten S, Schmitz C, Visser-Vandewalle V. Motor and cognitive improvement by deep brain stimulation in a transgenic rat model of Huntington's disease. Neurosci Lett. 2006;406:138–141. doi: 10.1016/j.neulet.2006.07.036. [DOI] [PubMed] [Google Scholar]
- van den Bogaard SJ, Dumas EM, Acharya TP, Johnson H, Langbehn DR, Scahill RI, Tabrizi SJ, van Buchem MA, van der Grond J, Roos RA, Group T-HI Early atrophy of pallidum and accumbens nucleus in Huntington's disease. J Neurol. 2011;258:412–420. doi: 10.1007/s00415-010-5768-0. [DOI] [PMC free article] [PubMed] [Google Scholar]
- Vlamings R, Benazzouz A, Chetrit J, Janssen ML, Kozan R, Visser-Vandewalle V, Steinbusch HW, von Horsten S, Temel Y. Metabolic and electrophysiological changes in the basal ganglia of transgenic Huntington's disease rats. Neurobiol Dis. 2012;48:488–494. doi: 10.1016/j.nbd.2012.07.006. [DOI] [PubMed] [Google Scholar]
- Vonsattel JP, DiFiglia M. Huntington disease. J Neuropathol Exp Neurol. 1998;57:369–384. doi: 10.1097/00005072-199805000-00001. [DOI] [PubMed] [Google Scholar]
- Voorn P. Projections from Pallidum to Striatum. In: Steiner H, Tseng KY, editors. Handbook of Basal Ganglia Structure and Function. Elsevier; 2010. pp. 249–257. [Google Scholar]
- Wakai M, Takahashi A, Hashizume Y. A histometrical study on the globus pallidus in Huntington's disease. J Neurol Sci. 1993;119:18–27. doi: 10.1016/0022-510x(93)90187-4. [DOI] [PubMed] [Google Scholar]
- Waldvogel HJ, Kim EH, Tippett LJ, Vonsattel JP, Faull RL. The Neuropathology of Huntington's Disease. Curr Top Behav Neurosci. 2015;22:33–80. doi: 10.1007/7854_2014_354. [DOI] [PubMed] [Google Scholar]