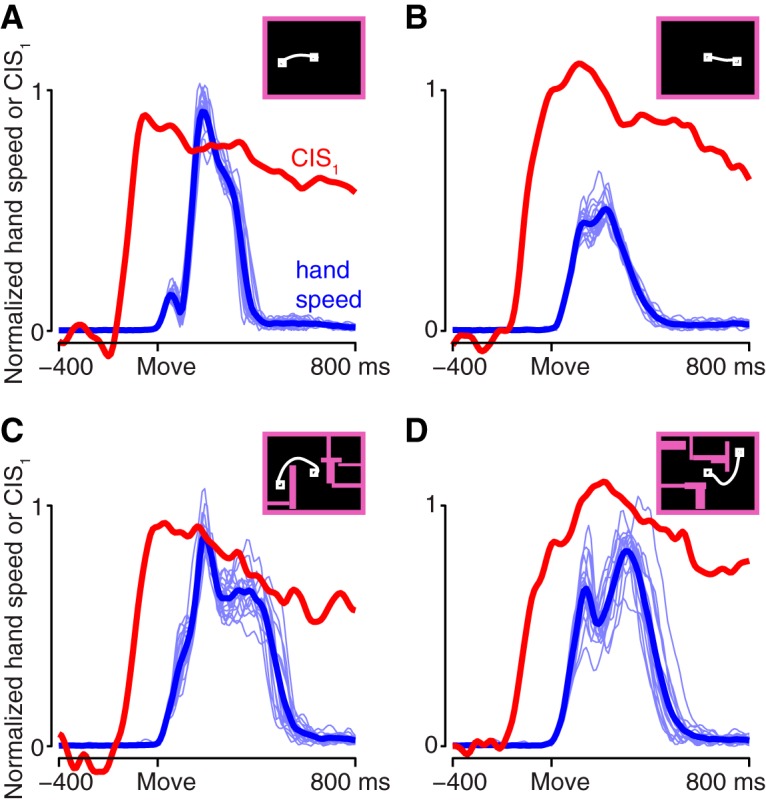
Figure 6.

Comparison of the CIS and hand speed. Hand speed (blue) and the first component of the CIS (red) are shown for four reach conditions. For hand speed, light traces show all trials; heavy trace shows mean over trials. CIS1 is the mean over trials. Insets show the maze for that condition and a prototypical reach path. A, A straight reach with a fast speed profile. Maze ID25. B, A straight reach with a slow speed profile. Maze ID7. C, A curved reach with a long speed profile. Maze ID5. D, A curved reach with an unusual speed profile. Maze ID14. The CIS was similar across all four examples, despite differences in the speed profile. Dataset NAD.
