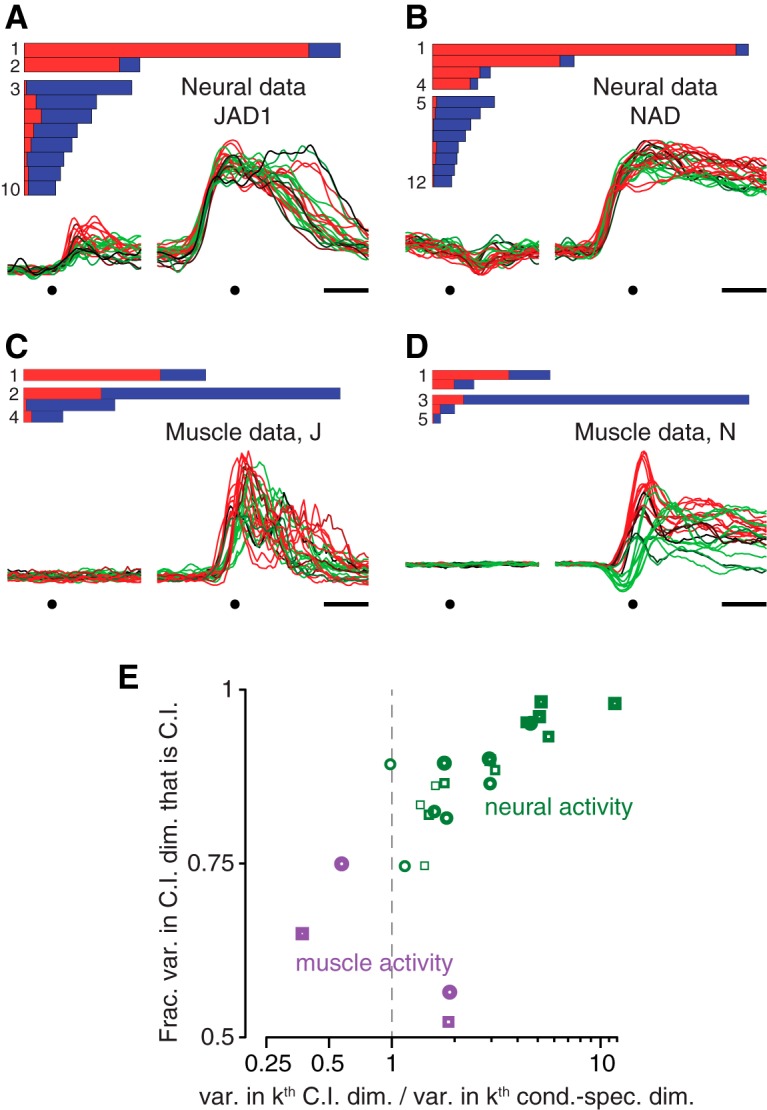
Figure 7.

Comparison of dPCA applied to neural and muscle populations. A, B, Demixing performance (bars) and the projection onto the first dimension found by dPCA (CIS1) for neural datasets JAD1 and NAD. Each trace corresponds to one condition. These panels are reproduced from Figure 3A,B for comparison with the corresponding analysis of EMG. Dots indicate target onset and movement onset. Scale bar, 200 ms. C, D, Similar analysis as in A and B, but for the muscle populations recorded for monkeys J and N. Muscle activity was recorded for the same sets of conditions as for the neural data in A and B. E, To compare the prevalence of a condition-invariant structure in the neural and muscle populations, we focused on nominally “condition-invariant” components with >50% condition-invariant variance. There were many such components for the neural populations (green) and 1–2 such components for each of the muscle populations (purple). For each such component, two measurements were taken: the fraction of the component’s variance that was condition-invariant (vertical axis) and the total variance captured. The latter was expressed in normalized terms: the variance captured by the k th nominally “condition-invariant” component divided by the total variance captured by the k th “condition-specific” component (horizontal axis). Only the neural datasets contained components that were both strongly condition-invariant (high on the vertical axis) and that captured relatively large amounts of variance (to the right on the horizontal axis). Heaviest symbols correspond to the first dimension found by dPCA for each dataset; higher-numbered dimensions are plotted as progressively lighter symbols. Dashed gray line highlights variance ratio of unity. Circles, monkey J datasets; squares, monkey N datasets.
