

Abstract
Visibility graph has established itself as a powerful tool for analyzing time series. We in this paper develop a novel multiscale limited penetrable horizontal visibility graph (MLPHVG). We use nonlinear time series from two typical complex systems, i.e., EEG signals and two-phase flow signals, to demonstrate the effectiveness of our method. Combining MLPHVG and support vector machine, we detect epileptic seizures from the EEG signals recorded from healthy subjects and epilepsy patients and the classification accuracy is 100%. In addition, we derive MLPHVGs from oil-water two-phase flow signals and find that the average clustering coefficient at different scales allows faithfully identifying and characterizing three typical oil-water flow patterns. These findings render our MLPHVG method particularly useful for analyzing nonlinear time series from the perspective of multiscale network analysis.
Uncovering complicated behavior from nonlinear time series constitutes a fundamental problem of continuing interest and it has attracted a great deal of attention from a wide variety of fields on account of its significant importance. Different methodologies have been developed to fulfill this challenging task, e.g., chaotic analysis1, fractal analysis2,3, recurrence plot4, complexity measure5, multiscale entropy6, and time-frequency representation7. In recent years, a new multidisciplinary methodology using complex network has emerged for characterizing complex systems8,9,10,11,12,13,14, especially the complex network analysis of time series, which has undergone a dramatic advance. Many efficient methods have been proposed to infer complex networks from univariate or multivariate time series15,16,17,18,19,20,21,22,23,24,25. In particular, Lacasa et al. proposed visibility graph17 and horizontal visibility graph18 which allow mapping a univariate time series into a complex network. The visibility graph theory has established itself as an efficient tool for probing the dynamics underlying real complex systems from time series26,27,28,29,30,31,32,33,34,35,36,37,38,39,40. The (horizontal) visibility graph leads to a natural graph-theoretical description of nonlinear systems with qualities in the spirit of symbolic dynamics. More recently, we extended the visibility graph to develop a limited penetrable visibility graph (LPVG)41,42 and found that LPVG presents a good anti-noise ability especially for the analysis of signals polluted by noise. Our LPVG method has been successfully applied to analyze gas-liquid flow signals42, signals from electromechanical system in process industry43, and EEG signals associated with manual acupuncture44 and Alzheimer’s disease45.
As a further study, we in this paper develop a novel multiscale limited penetrable horizontal visibility graph (MLPHVG) to analyze nonlinear time series from the perspective of multiscale and complex network analysis. In particular, we use two examples to demonstrate the validity of our method, i.e., (a) EEG signals recorded from healthy subjects and epilepsy patients; (b) experimental flow signals from oil-water two-phase flows.
The brain is one of the most complex systems. Epilepsy is a paroxysmal disorder of the brain, characterized by sudden occurrence of unprovoked seizures. The underlying mechanism of epileptic seizure is still elusive. Since the fluctuations of EEG signals are associated with the occurrence of epileptic seizures, the characterization of epileptic seizure from EEG signals becomes quite important. We apply our method to analyze two sets of EEG data recorded from numbers of healthy and epileptic subjects. We combine the support vector machine and network statistical measures including the average clustering coefficient and clustering coefficient entropy to detect epileptic seizures at different scales. We interestingly find that the network statistical measures present significant difference between healthy subjects and epilepsy patients. The classification accuracy is 100% at the scale factor 2. These results indicate that our method allows efficiently classifying and identifying EEG signals recorded from healthy subjects and epilepsy patients during epileptic seizures.
Liquid-liquid two-phase flows are widely encountered in many industrial processes. The mixture flow of immiscible oil-water can be viewed as a complex system with typical features of instability, transient and randomness. In recent years, the interest in oil-water two-phase flows has greatly increased due to the development of petroleum industry. The oil and water usually coexist during the oil-well production, and these two immiscible fluids can distribute themselves in various temporal-spatial configurations, known as flow patterns. Different flow patterns exhibit distinct local flow behaviors, how to identify and uncover the underlying dynamics of different flow patterns from experimental measurements has represented a challenge of significant importance. We carry out oil-water two-phase flow experiment to obtain the flow signals and then use our proposed method to identify and characterize different flow patterns from the experimental measurements. The results suggest that our method enables to identify distinct flow behaviors underlying three typical oil-water flow patterns. The above findings render our MLPHVG method particularly powerful for characterizing a dynamical process underlying a given nonlinear time series of time dependent complex system.
Results
MLPHVG analysis of EEG signals
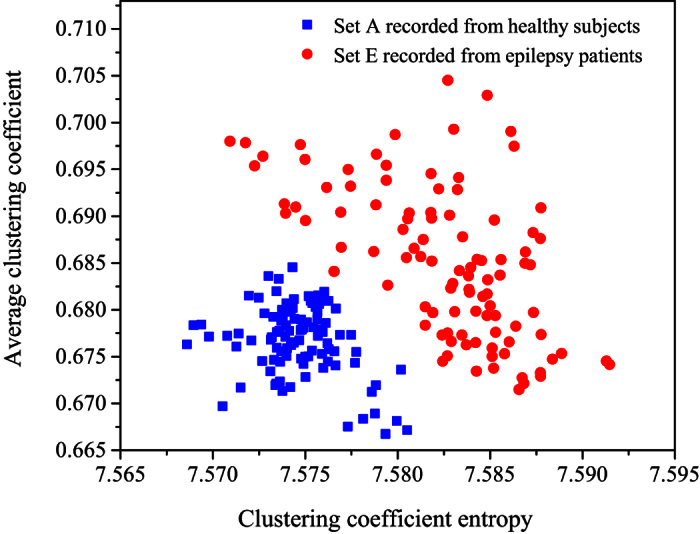
The EEG data sets analyzed in this paper are from the experiments carried out by Andrzejak et al.46. We use two EEG data sets (set A and set E) and each data set consists of 100 single-channel EEG segments of 23.6 s duration. These segments were selected and cut out from continuous multichannel EEG recordings after visual inspection for artifacts, e.g., due to muscle activity or eye movements. Set A consists of segments taken from five healthy subjects through surface electrodes using the international 10–20 electrode placement scheme. Set E from five epilepsy patients consists of segments selected from all recording sites exhibiting ictal activity during seizure activity. All EEG signals were recorded with the same 128-channel amplifier system, using an average common reference. The data were digitized at sampling rate of 173.61 Hz. Band-pass filter settings were 0.53–40 Hz. We derive 200 MLPHVGs (multiscale limited penetrable horizontal visibility graphs) corresponding to two sets of EEG signals with the limited penetrable distance being 1. Then we calculate the average clustering coefficient47 and clustering coefficient entropy24 from the derived networks. We combine the average clustering coefficient and clustering coefficient entropy to generate two-dimensional feature vectors and then employ SVM (Support Vector Machine) to realize the classification of sets A and E. In particular, we employ the leave-one-out cross-validation and 10-fold cross-validation to estimate the classified results of the features derived from MLPHVGs. The leave-one-out cross-validation48 consists of removing one sample from the dataset (set A and E), constructing the decision function on the basis only of the remaining dataset and then testing on the removed sample. In this fashion this process is repeated 200 times independently, with a different sample left out for testing every time. After 200 cross validations, we obtain the predicting labels for all samples and measure the fraction of correctly predicted samples over the total number of samples in the dataset. In addition, we employ the 10-fold cross-validation to estimate the classification accuracy. For one realization of 10-fold cross-validation, the 200 samples from sets A and E are randomly partitioned into ten equal subsets; nine subsets are used for training and one subset remains for testing. This procedure is repeated ten times so each subset serves once for validation and then we obtain predicting labels for all samples from ten subsets and a classification accuracy for one implementation of 10-fold cross-validation can be obtained by measuring the fraction of correctly predicted samples over the total number of samples in the dataset. In order to reduce bias introduced by randomly partitioning dataset in the cross-validation, we implement the 10-fold cross-validation 10 times independently and the final classification accuracy of set A and E can be estimated by taking the average of the 10 independent realizations of 10-fold cross-validation. The classification accuracy using leave-one-out cross-validation and 10-fold cross-validation at different scales are presented in Fig. 1. Notably, the classification accuracy is high over different scales and the highest value is 100% at scale 2. We in Fig. 2 show the joint distributions of the average clustering coefficient and clustering coefficient entropy for sets A and E at scale factor 2. This EEG database has been recognized as a benchmark for developing seizure detection models, and many researchers have used this database to test their proposed methods49,50,51,52,53,54,55,56. To give a few examples, Nigam et al.49 proposed a method using multistage nonlinear pre-processing filter in combination with a diagnostic artificial neural network to classify sets A and E with a classification accuracy of 97.2%. Kaya et al.50 presented a novel method based on one-dimensional local binary pattern to classify sets A and E and the classification accuracy is 99.5%. Kannathal et al.51 proposed a method based on various entropy measures and adaptive neuro-fuzzy classifier to classify sets A and E with a classification accuracy of 92.22%. Subasi52 employed wavelet feature extraction and a mixture of expert model to distinguish sets A and E and obtained a classification accuracy of 94.5%. Polat et al.53 classified sets A and E with a classification accuracy of 98.72% by using a hybrid system based on decision tree classifier and fast Fourier transform. Nicolaou et al.54 integrated the permutation entropy with the support vector machine to classify sets A and E with a classification accuracy of 93.55%. Zhu et al.55 proposed a weighted horizontal visibility graph to classify sets A and E and the classification accuracy is 100%. Zamir56 developed linear least squares-based preprocessing models to classify sets A and E with a classification accuracy of 100%. There are many published good classification results of this EEG dataset and the above are just a few of them. More results can be found in Ref. 57. Therefore, our method allows accurately classifying EEG signals recorded from healthy subjects and epilepsy patients.
Figure 1.
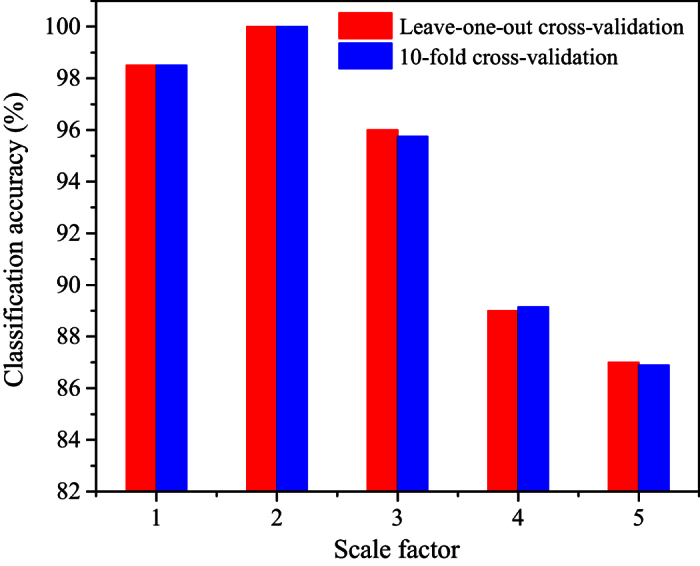
Figure 2.
MLPHVG analysis of experimental flow signals
The two-phase flow signals are from our oil-water two-phase flow experiment, which was carried out in a vertical upward 20 mm-inner-diameter plexiglass pipe at Tianjin University. The experiential media are tap-water and No. 3 white oil. These two immiscible fluids mix themselves and then flow together into the vertical testing pipe. Three oil-in-water flow patterns have been observed, i.e., oil-in-water slug flow, oil-in-water bubble flow, oil-in-water VFD flow (Very Fine Dispersed bubble flow). The conductance sensor58 is designed to capture the flow behavior and the measured flow signals are stored by data acquisition devices. The sampling rate is 4000 Hz. We use the high-speed camera to observe and define oil-water flow patterns. We infer multiscale limited penetrable horizontal visibility graphs from our experimental measurements and the limited penetrable distance is 1. Then we employ the average clustering coefficient to analyze the derived complex networks corresponding to three typical vertical oil-in-water flow patterns.
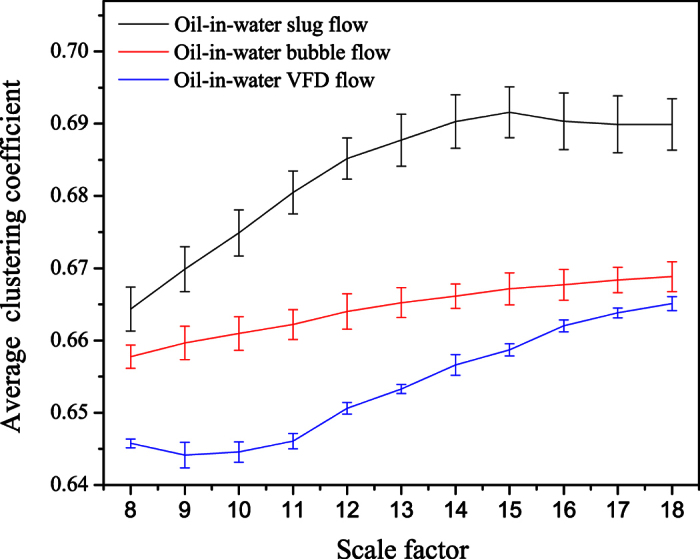
The results are shown in Fig. 3, in which each error bar is calculated from different flow conditions for the same flow pattern at the same scale factor. We can see that, the multiscale distributions of the average clustering coefficient for different flow patterns exhibit distinct features, which allows identifying three different oil-water flow patterns. For the oil-in-water slug flow, small numbers of oil droplets simultaneously follow the cap shaped oil slugs. Its flow behavior exhibits the feature of intermittent oscillation and its flow structure presents non-homogenous distribution. The flow of oil slug through the sensor will lead to a large fluctuation in the measured conductance signals. Consequently, the average clustering coefficients of oil-in-water slug flow exhibit large values at different scales, and the deviation of the average clustering coefficients calculated from different oil-in-water slug flow conditions at the same scale factor is also the largest among three flow patterns. The turbulent energy enhances with the increase of mixture flow rate, the oil slug are broken into small oil droplets consequently. That is, oil-in-water bubble flow occurs, where oil phase exists in the form of discrete droplets flowing in a water continuum. In this flow pattern, the intermittent oscillation of oil slugs gradually disappears and the non-homogenous distribution of oil phase becomes weak. The fluctuation strength of the measured conductance signals is weakened. Correspondingly, the average clustering coefficient decreases as the flow pattern changes from oil-in-water slug flow to oil-in-water bubble flow and meanwhile the deviation value also decreases. When the mixture flow rate is high, the oil droplets are dispersed into even smaller oil droplets, i.e., an onset of oil-in-water very fine dispersed bubble flow (VFD flow). The fluctuation strength of the signals from VFD flow is further weakened. The average clustering coefficient and its deviation of VFD flow are the smallest, indicating the underlying flow behavior becomes stochastic and the distribution of oil phase becomes homogenous as the flow pattern evolves from oil-in-water bubble flow to VFD flow. These interesting findings suggest that our method is capable of identifying and characterizing three typical flow patterns arising from vertical oil-water two-phase flow at different scales.
Figure 3.
Discussions
In summary, we have articulated a novel MLPHVG strategy (multiscale limited penetrable horizontal visibility graph) for analyzing nonlinear time series. The basic idea of MLPHVG is to define temporal scales in terms of coarse-grain process and then infer limited penetrable horizontal visibility graph from coarse-grained time series for each scale to construct MLPHVG. We choose nonlinear time series from two typical complex systems, i.e., EEG signals and two-phase flow signals, to demonstrate the effectiveness of our method. Combining MLPHVG and support vector machine, we detect epileptic seizure from two sets of EEG signals recorded from numbers of healthy subjects and epilepsy patients. The results suggest that our method allows a high-accurate classification of EEG signals recorded from healthy subjects and epilepsy patients during epileptic seizures. In addition, we use our method to derive multiscale complex network from oil-water two-phase flow signals and then employ multiscale network statistical measures to characterize the constructed networks. Our results indicate that the average clustering coefficient at different scales allows faithfully revealing the change of flow behavior underlying different flow patterns. Bridging multiscale analysis and limited penetrable horizontal visibility graph provides a novel methodology for characterizing a dynamical process underlying a given nonlinear time series of time dependent complex system which widely exists in science and engineering.
Methods
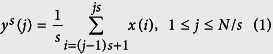
The multiscale limited penetrable horizontal visibility graph (MLPHVG) method can be implemented by the following steps: For a time series of length N, {x (i), i = 1, 2, …, N}, we first define temporal scales in terms of coarse grain process6 and get a coarse-grained time series {ys (j), j = 1, 2, …, N/s} in the following form
 |
where s represents scale factor. Next we infer limited penetrable horizontal visibility graph from the coarse-grained time series {ys (j), j = 1, 2, …, N/s}. We in Fig. 4 show a schematic diagram for demonstrating how to infer limited penetrable horizontal visibility graph from a time series. For a continuous time series of length 10, we display them in the form of vertical bars in Fig. 4(a) and regard each data point (vertical bar) as a node of a complex network. For the horizontal visibility graph (HVG)18, two nodes ys (i) and ys (j) are connected if one can draw a horizontal line joining ys (i) and ys (j) that does not intersect any intermediate data height. That is, a connection between two nodes ys (i) and ys (j) exists (black lines in Fig. 4(b)) if the following criterion is fulfilled:
Figure 4.

Example of (a) a time series (10 data values) and (b) its corresponding LPHVG with the limited penetrable distance L being 1, where every node corresponds to time series data in the same order. The horizontal visibility lines between data points define the links connecting nodes in the graph.
 |
Our limited penetrable horizontal visibility graph is a development of the HVG. In particular, if we set the limited penetrable distance to L, a connection between two nodes exists if the number of in-between nodes that block the horizontal line is no more than L. As shown in Fig. 4(a,b), the red lines are the new established connections when we infer the LPHVG on the basis of HVG with the limited penetrable distance being 1. Finally, based on the above procedure, we can obtain multiscale limited penetrable horizontal visibility graph (MLPHVG) by deriving the LPHVG from the coarse-grained time series at different scales.
Representing a time series through a multiscale limited penetrable horizontal
visibility graph, we can then explore the dynamic behaviors from multiscale analysis
and network analysis, which is quantified via network statistical measures. In
particular, we employ the average clustering coefficient ( )47, and our recently proposed clustering coefficient
entropy (EC)24 to characterize the
topological structure of inferred networks. These network statistical measures can
be calculated as follows
)47, and our recently proposed clustering coefficient
entropy (EC)24 to characterize the
topological structure of inferred networks. These network statistical measures can
be calculated as follows
 |
 |
 |
where τi,Δ denotes the number of closed triplets centered on node i, τi is the number of triplets centered on node i, N is the node number of the derived MLPHVG.
Additional Information
How to cite this article: Gao, Z.-K. et al. Multiscale limited penetrable horizontal visibility graph for analyzing nonlinear time series. Sci. Rep. 6, 35622; doi: 10.1038/srep35622 (2016).
Acknowledgments
This work was supported by National Natural Science Foundation of China under Grant No. 61473203 and the Natural Science Foundation of Tianjin, China under Grant No. 16JCYBJC18200.
Footnotes
The authors declare no competing financial interests.
Author Contributions Z.-K.G. and Q.C. devised the research project. Z.-K.G., Q.C., W.-D.D., Y.-X.Y. and S.-S.Z. conducted the experiment. Z.-K.G., Q.C. and Y.-X.Y. performed numerical simulations. Z.-K.G., Q.C., Y.-X.Y. and W.-D.D. analyzed the results and wrote the paper.
References
- Daw C. S. et al. Self-Organization and Chaos in a Fluidized Bed. Phys. Rev. Lett. 75, 2308–2311 (1995). [DOI] [PubMed] [Google Scholar]
- Peng C. K. et al. Mosaic organization of DNA nucleotides. Phys. Rev. E 49, 1685–1689 (1994). [DOI] [PubMed] [Google Scholar]
- Podobnik B. & Stanley H. E. Detrended cross-correlation analysis: A new method for analyzing two nonstationary time series. Phys. Rev. Lett. 100, 084102 (2008). [DOI] [PubMed] [Google Scholar]
- Marwan N., Romano M. C., Thiel M. & Kurths J. Recurrence Plots for the Analysis of Complex Systems. Phys. Rep. 438, 237–329 (2007). [Google Scholar]
- Lempel A. & Ziv J. On the complexity of finite sequences. IEEE Trans. Inf. Theory 22, 75–81 (1976). [Google Scholar]
- Costa M., Goldberger A. L. & Peng C. K. Multiscale entropy analysis of complex physiologic time series. Phys. Rev. Lett. 89, 068102 (2002). [DOI] [PubMed] [Google Scholar]
- Gao Z. K., Yang Y. X., Zhai L. S., Ding M. S. & Jin N. D. Characterizing slug to churn flow transition by using multivariate pseudo Wigner distribution and multivariate multiscale entropy. Chem. Eng. J. 291, 74–81 (2016). [Google Scholar]
- Liu N. R., An H. Z., Gao X. Y., Li H. J. & Hao X. Q. Breaking news dissemination in the media via propagation behavior based on complex network theory. Physica A 453, 44–54 (2016). [Google Scholar]
- Kim B., Do Y. & Lai Y. C. Emergence and scaling of synchronization in moving-agent networks with restrictive interactions. Phys. Rev. E 88, 042818 (2013). [DOI] [PubMed] [Google Scholar]
- Su R. Q., Lai Y. C., Wang X. & Do Y. Uncovering hidden nodes in complex networks in the presence of noise. Sci. Rep. 4, 3944 (2014). [DOI] [PMC free article] [PubMed] [Google Scholar]
- Huang Z. G., Dong J. Q., Huang L. & Lai Y. C. Universal flux-fluctuation law in small systems. Sci. Rep. 4, 6787 (2014). [DOI] [PMC free article] [PubMed] [Google Scholar]
- Zou W. et al. Restoration of rhythmicity in diffusively coupled dynamical networks. Nat. Commun. 6, 7709 (2015). [DOI] [PMC free article] [PubMed] [Google Scholar]
- Wang Z., Kokubo S., Jusup M. & Tanimoto J. Universal scaling for the dilemma strength in evolutionary games. Phys. Life Rev. 14, 1–30 (2015). [DOI] [PubMed] [Google Scholar]
- Gao Z. K. et al. Multi-frequency complex network from time series for uncovering oil-water flow structure. Sci. Rep. 5, 8222 (2015). [DOI] [PMC free article] [PubMed] [Google Scholar]
- Zhang J. & Small M. Complex network from pseudoperiodic time series: topology versus dynamics. Phys. Rev. Lett. 96, 238701 (2006). [DOI] [PubMed] [Google Scholar]
- Xu X. K., Zhang J. & Small M. Superfamily phenomena and motifs of networks induced from time series. P. Natl. Acad. Sci. USA 105, 19601–19605 (2008). [DOI] [PMC free article] [PubMed] [Google Scholar]
- Lacasa L., Luque B., Ballesteros F., Luque J. & Nuno J. C. From time series to complex networks: The visibility graph. P. Natl. Acad. Sci. USA 105, 4972–4975 (2008). [DOI] [PMC free article] [PubMed] [Google Scholar]
- Luque B., Lacasa L., Ballesteros F. & Luque J. Horizontal visibility graphs: exact results for random time series. Phys. Rev. E 80, 046103 (2009). [DOI] [PubMed] [Google Scholar]
- Marwan N., Donges J. F., Zou Y., Donner R. V. & Kurths J. Complex network approach for recurrence analysis of time series. Phys. Lett. A 373, 4246–4254 (2009). [Google Scholar]
- Gao Z. K. & Jin N. D. A directed weighted complex network for characterizing chaotic dynamics from time series. Nonlinear Anal.-Real 13, 947–952 (2012). [Google Scholar]
- Donges J. F., Heitzig J., Donner R. V. & Kurths J. Analytical framework for recurrence network analysis of time series. Phys. Rev. E 85, 046105 (2012). [DOI] [PubMed] [Google Scholar]
- Gao Z. K., Fang P. C., Ding M. S. & Jin N. D. Multivariate weighted complex network analysis for characterizing nonlinear dynamic behavior in two-phase flow. Exp. Therm. Fluid Sci. 60, 157–164 (2015). [Google Scholar]
- Gao Z. K. et al. Recurrence networks from multivariate signals for uncovering dynamic transitions of horizontal oil-water stratified flows. Europhys. Lett. 103, 50004 (2013). [Google Scholar]
- Gao Z. K. et al. Multiscale complex network for analyzing experimental multivariate time series. Europhys. Lett. 109, 30005 (2015). [Google Scholar]
- Huang S. P., An H. Z., Gao X. Y. & Jiang M. H. The multiscale fluctuations of the correlation between oil price and wind energy stock. Sustainability 8, 534 (2016) [Google Scholar]
- Lacasa L. & Toral R. Description of stochastic and chaotic series using visibility graphs. Phys. Rev. E 82, 036120 (2010). [DOI] [PubMed] [Google Scholar]
- Luque B., Lacasa L., Ballesteros F. J. & Robledo A. Feigenbaum graphs: a complex network perspective of chaos. PLoS One 6, e22411 (2011). [DOI] [PMC free article] [PubMed] [Google Scholar]
- Liu C., Zhou W. X. & Yuan W. K. Statistical properties of visibility graph of energy dissipation rates in three-dimensional fully developed turbulence. Physica A 389, 2675–2681 (2010). [Google Scholar]
- Gao Z. K., Du M., Hu L. D., Zhou T. T. & Jin N. D. Visibility graphs from experimental three phase flow for characterizing dynamic flow behavior. Int. J. Mod. Phys. C 23, 1250069 (2012). [Google Scholar]
- Gao X. Y. et al. Characteristics of the transmission of autoregressive sub-patterns in financial time series. Sci. Rep. 4, 6290 (2014). [DOI] [PMC free article] [PubMed] [Google Scholar]
- Ravetti M. G., Carpi L. C., Goncalves B. A., Frery A. C. & Rosso O. A. Distinguishing Noise from Chaos: Objective versus Subjective Criteria Using Horizontal Visibility Graph. PLoS One 9, e108004 (2014). [DOI] [PMC free article] [PubMed] [Google Scholar]
- Zhuang E., Small M. & Feng G. Time series analysis of the developed financial markets’ integration using visibility graphs. Physica A 410, 483–495 (2014). [Google Scholar]
- Zou Y., Donner R. V., Marwan N., Small M. & Kurths J. Long-term changes in the north-south asymmetry of solar activity: a nonlinear dynamics characterization using visibility graphs. Nonlinear Proc. Geoph. 21, 1113–1126 (2014). [Google Scholar]
- Tang J. J., Liu F., Zhang W. B., Zhang S. & Wang Y. H. Exploring dynamic property of traffic flow time series in multi-states based on complex networks: Phase space reconstruction versus visibility graph. Physica A 450, 635–648 (2016). [Google Scholar]
- Stephen M., Gu C. G. & Yang H. J. Visibility Graph Based Time Series Analysis. PLoS One 10, e0143015 (2015). [DOI] [PMC free article] [PubMed] [Google Scholar]
- Lucas L., Vincenzo N. & Vito L. Network structure of multivariate time series. Sci. Rep. 5, 15508 (2015). [DOI] [PMC free article] [PubMed] [Google Scholar]
- Zhang B., Wang J. & Fang W. Volatility behavior of visibility graph EMD financial time series from Ising interacting system. Physica A 432, 301–314 (2015). [Google Scholar]
- Bhaduri S. & Ghosh D. Electroencephalographic data analysis with visibility graph technique for quantitative assessment of brain dysfunction. Clin. EEG Neurosci. 46, 218–223 (2015). [DOI] [PubMed] [Google Scholar]
- Zhu G., Li Y. & Wen P. Analysis of alcoholic EEG signals based on horizontal visibility graph entropy. Brain Informatics 1, 19–25 (2014). [DOI] [PMC free article] [PubMed] [Google Scholar]
- Ahmadlou M., Adeli H. & Adeli A. New diagnostic EEG markers of the Alzheimer’s disease using visibility graph. J. Neural Transm. 117, 1099–1109 (2010). [DOI] [PubMed] [Google Scholar]
- Zhou T. T., Jin N. D. Gao Z. K. & Luo Y. B. Limited penetrable visibility graph for establishing complex network from time series. Acta Phys. Sin. 61, 030506 (2012). [Google Scholar]
- Gao Z. K., Hu L. D., Zhou T. T. & Jin N. D. Limited penetrable visibility graph from two-phase flow for investigating flow pattern dynamics. Acta Phys. Sin. 62, 110507 (2013). [Google Scholar]
- Wang R. X., Gao J. M., Gao Z. Y., Gao X. & Jiang H. Q. Complex network theory-based condition recognition of electromechanical system in process industry. Sci. China Technol. Sc. 59, 604–617 (2016). [Google Scholar]
- Pei X. et al. WLPVG approach to the analysis of EEG-based functional brain network under manual acupuncture, Cogn. Neurodynamics 8, 417–428 (2014). [DOI] [PMC free article] [PubMed] [Google Scholar]
- Wang J. et al. Functional brain networks in Alzheimer’s disease: EEG analysis based on limited penetrable visibility graph and phase space method. Physica A 460, 174–187 (2016). [Google Scholar]
- Andrzejak R. G. et al. Indications of nonlinear deterministic and finite-dimensional structures in time series of brain electrical activity: Dependence on recording region and brain state. Phys. Rev. E 64, 061907 (2001). [DOI] [PubMed] [Google Scholar]
- Newman M. E. J. The structure and function of complex networks. SIAM Rev. 45, 167–256 (2003). [Google Scholar]
- An S. J., Liu W. Q. & Venkatesh S. Fast cross-validation algorithms for least squares support vector machine and kernel ridge regression. Pattern Recogn. 40, 2154–2162 (2007). [Google Scholar]
- Nigam V. P. & Graupe D. A neural network based detection of epilepsy. Neurol. Res. 26, 55–60 (2004). [DOI] [PubMed] [Google Scholar]
- Kaya Y., Uyar M., Tekin R. & Yildirim S. 1D-local binary pattern based feature extraction for classification of epileptic EEG signals. Appl. Math. Comput. 243, 209–219 (2014). [Google Scholar]
- Kannathal N., Choo M. L., Acharya U. R. & Sadasivan P. K. Entropies for detection of epilepsy in EEG. J. Med. Syst. 80, 187–194 (2005). [DOI] [PubMed] [Google Scholar]
- Subasi A. EEG signal classification using wavelet feature extraction and a mixture of expert model. Expert Syst. Appl. 32, 1084–1093 (2007). [Google Scholar]
- Polat K. & Gunes S. Classification of epileptiform EEG using a hybrid system based on decision tree classifier and fast Fourier transform. Appl. Math. Comput. 187, 1017–1026 (2007). [Google Scholar]
- Nicolaou N. & Georgiou J. Detection of epileptic electroencephalogram based on Permutation Entropy and Support Vector Machines. Expert Syst. Appl. 39, 202–209 (2012). [Google Scholar]
- Zhu G. H., Li Y. & Wen P. Epileptic seizure detection in EEGs signals using a fast weighted horizontal visibility algorithm. Comput. Meth. Prog. Bio. 115, 64–75 (2014). [DOI] [PubMed] [Google Scholar]
- Zamir Z. R. Detection of epileptic seizure in EEG signals using linear least squares preprocessing. Comput. Methods Programs Biomed. 133, 95–109 (2016). [DOI] [PubMed] [Google Scholar]
- Acharya U. R., Fujita H., Sudarshan V. K., Bhat S. & Koh J. E. W. Application of entropies for automated diagnosis of epilepsy using EEG signals: A review. Knowl-Based Syst. 88, 85–96 (2015). [Google Scholar]
- Gao Z. K., Yang Y. X., Zhai L. S., Jin N. D. & Chen G. R. A four-sector conductance method for measuring and characterizing low-velocity oil-water two-phase flows. IEEE Transactions on Instrumentation and Measurement 65, 1690–1697 (2016). [Google Scholar]