ABSTRACT
Recombinant protein expression often presents a bottleneck for the production of proteins for use in many areas of animal‐cell biotechnology. Difficult‐to‐express proteins require the generation of numerous expression constructs, where popular prokaryotic screening systems often fail to identify expression of multi domain or full‐length protein constructs. Post‐translational modified mammalian proteins require an alternative host system such as insect cells using the Baculovirus Expression Vector System (BEVS). Unfortunately this is time‐, labor‐, and cost‐intensive. It is clearly desirable to find an automated and miniaturized fast multi‐sample screening method for protein expression in such systems. With this in mind, in this paper a high‐throughput initial expression screening method is described using an automated Microcultivation system in conjunction with fast plasmid based transient transfection in insect cells for the efficient generation of protein constructs. The applicability of the system is demonstrated for the difficult to express Nucleotide‐binding Oligomerization Domain‐containing protein 2 (NOD2). To enable detection of proper protein expression the rather weak plasmid based expression has been improved by a sensitive inline detection system. Here we present the functionality and application of the sensitive SplitGFP (split green fluorescent protein) detection system in insect cells. The successful expression of constructs is monitored by direct measurement of the fluorescence in the BioLector Microcultivation system. Additionally, we show that the results obtained with our plasmid‐based SplitGFP protein expression screen correlate directly to the level of soluble protein produced in BEVS. In conclusion our automated SplitGFP screen outlines a sensitive, fast and reliable method reducing the time and costs required for identifying the optimal expression construct prior to large scale protein production in baculovirus infected insect cells. Biotechnol. Bioeng. 2016;113: 1975–1983. © 2016 The Authors. Biotechnology and Bioengineering Published by Wiley Periodicals, Inc.
Keywords: SplitGFP, insect cells, protein expression screen, Biolector, high throughput screen, Hi5 cells
Introduction
The demand for production of human recombinant proteins for functional and crystallographic studies is one of the main driving forces for recent developments of new and improved biotechnological protein production systems. Especially, the presence of specific post‐translational modifications such as glycosylation are a major challenge for the generation of many recombinant proteins (Apweiler et al., 1999). However, prokaryotic hosts are often not amenable for the production of correctly processed human protein samples. Such proteins require more sophisticated eukaryotic expression systems, such as the widely used Baculovirus Expression Vector System (BEVS) (McPherson, 2008; Mirzaei et al., 2008; Nie et al., 2014). This offers numerous advantages including high yields, serum free handling, ease of scale‐up, and simplified cell growth readily adaptable to high‐density suspension culture for large‐scale expression (Jarvis, 2009; McPherson, 2008). Furthermore, the simple and homogenous paucimannose type of glycosylation adds an advantage for the production of high quality protein samples (Altmann et al., 1999) and explains the current leading role of insect cell expression systems for the generation of eukaryotic protein samples for crystallographic analysis (Protein Data Bank, August, 2015).
However, several target proteins pose a severe challenge even for BEVS because they are unable to be produced as soluble, correctly processed “full‐length” protein. For such difficult‐to‐express proteins numerous constructs with distinctive boundaries need to be generated in order to identify the best expression clones from a set of constructs that yield sufficient amount of the target protein (Bulloch and Kingston, 2014). Screening such candidates with the classic BEVS is a time‐, labor‐, and cost‐intensive (Jarvis, 2014) process as sufficient recombinant baculoviral material of adequate quality for each construct is required for analysis of the expression efficiency. Hence, screening target constructs in a plasmid based and automated miniaturized expression system, ahead of the actual generation of baculovirus and large‐scale protein production, would be preferable.
Several screening systems have already been developed mainly for other expression hosts such as E. coli (Cornvik et al., 2006; Yumerefendi et al., 2010), but also for eukaryotic systems. For example, orbitally shaken ventilated tubes (TubeSpin Reactors, TPP Techno Plastic Products) or 24‐well blocks are often applied for small scale high throughput in mammalian systems (Hacker et al., 2009) or in baculovirus infected insect cells (Brown et al., 2011; Hunt, 2005; Rieffel et al., 2014). Nevertheless, this remains a time‐intensive baculovirus based system without direct in‐line analysis of the expressed protein. A second option is the so called plasmid based transient and transactivation screening method (Radner et al., 2012). Here, the rather weak pIE1x promoter driven plasmid based expression of the target gene in insect cells is boosted by the coinfection with an “empty” baculovirus to additionally activate the late viral p10 promoter. Being a plasmid based system, transactivation avoids the time‐ and work‐intensive generation of recombinant baculovirus. Even so, expression of the target proteins cannot be directly detected during cultivation and requires downstream analysis. Thirdly, a direct fusion of full‐length GFP to membrane proteins has been described as an alternative screening method with a simple readout (Chen et al., 2013). However, while fusion to a full‐length GFP might initially result in increased solubility and expression of the target protein expression (Waldo et al., 1999), subsequent removal of the stabilizing GFP tag may lead to decreased solubility or even total insolubility of the target protein (Esposito and Chatterjee, 2006). False positive constructs may obscure better‐suited constructs whose solubility is not dependent on the fusion to GFP.
In our screening approach we aim at combining fast plasmid based transfection with a simple and sensitive inline readout system, which only minimal interferes with the expression of the target protein. Transient co‐transfection in insect cells using the SplitGFP system developed by Cabantous and coworkers (Cabantous et al., 2005b) for E. coli expression screens meets these demands. Merely one β‐strand of a specially developed GFP (Cabantous and Waldo, 2006) (splGFP11) is fused to the target protein and is able to reassemble with the co‐expressed residual part of GFP (splGFP1‐10) of the fluorescence‐competent splGFP molecule. The assembly of the splGFP11 β‐strand is essential to trigger the folding step for generation of the cyclized chromophore of splGFP (Cabantous et al., 2005b).
The SplitGFP tagging technology offers numerous benefits. Since the splGFP11 tag merely consists of 15 amino acids, it does not or only minimally interferes with the solubility or folding of the target protein (Cabantous et al., 2005a). Additionally, the SplitGFP system is functional within living cells and does not need any chemical reagents or substrates compared to other labeling systems (e.g., Luciferase (Close et al., 2012)), thus enabling time‐dependent in‐line fluorescence tracking of the target protein production (Kaddoum et al., 2010).
To further improve our screen, we employed the BioLector Microcultivation system for high‐throughput. The BioLector allows in‐line measurement of optical density and GFP fluorescence of up to 48 different cultures in parallel. Thus, we were able to compare the expression of up to 48 different constructs in one experiment by the direct SplitGFP readout.
As model target protein we have used the difficult to express Nucleotide‐binding Oligomerization Domain‐containing protein 2 (NOD2). NOD2 is a cytosolic pattern recognition receptor, which plays an important role in the human immune system. However, the production of ample soluble crystallization quality recombinant NOD2 has proved to be challenging (Mo et al., 2012). Here we describe the analysis and identification of expressible NOD2 constructs using the established SplitGFP screen in insect cells. Subsequently, a direct scale‐up of plasmid based protein expression with complete avoidance of baculovirus would be possible as described in Shen et al. (2014) for Sf9 and Hi5 cells (Shen et al., 2015). Alternatively, recombinant baculovirus can be produced and amplified for those constructs which surpass the initial SplitGFP screen. However, as our SplitGFP screen is solely based on plasmid expression, it raises the question whether successful expression constructs behave similarly in the BEVS system, as the viral infection remodels the host immensely (Jarvis and Summers, 1989). Consequently, we tested and showed the correlation of the results from our SplitGFP screen to the expression in BEVS for the selected NOD2 constructs. Thus, the in this paper established automated SplitGFP screen in insect cells is a valuable tool for fast identification of expressable protein constructs.
Materials and Methods
Vector Design
The DNA sequences of splGFP1‐10 and splGFP11 were designed according to Waldo et al. (1999) (Cabantous et al., 2005b) and synthesized by Genscript (Piscataway, NJ). The synthesized constructs as well as the vector OpIE2‐eGFP (Bleckmann et al., 2015) were digested with BamHI and AvrII and ligated following a standard protocol resulting in the OpIE2‐splGFP1‐10 vector. The OpIE2‐splGFP11‐MCS vector was constructed similarly, but an artificial spacer element inserted for the ease of cloning had to be removed afterwards by NheI digestion and religation.
All NOD2 constructs were amplified with specifically designed primers containing NotI and KpnI restriction sites from a cDNA template (HsCD00297035, DNASU Plasmid Repository (Seiler et al., 2014)). An overview of size and length of the different NOD2 constructs as well as the full‐length sequence of NOD2 is shown in the supplement (Supplement 1 and 2). After digestion with NotI and KpnI the constructs were ligated with OpIE2‐splGFP11‐6AA‐MCS or, in the case of the BEVS expression, with a modified version of pFlpBtM‐II (Meyer et al., 2013) containing an N‐terminal strep‐TEV tag following standard procedures. As with the different NOD2 constructs the vector OpIE2‐splGFP11‐mCherry was constructed using pFlpBtM‐II‐mCherry (Meyer et al., 2013) as a PCR template for PCR amplification and subsequent digestion with NotI and KpnI.
To generate vectors with a C‐terminal splGFP11 tag a synthesized TEV‐twinStrep‐ splGFP11 construct was cloned into the pFlpBtM‐II (Meyer et al., 2013) replacing the TEV‐twinStrep‐His‐SV40term region using XhoI and BclI. In a second step the NOD2 construct ND1 was cloned into the multi cloning site of pFlpBtM‐II using NcoI and XhoI. The resulting vector was used as a template to amplify NcoI‐ND1‐TEV‐twinStrep‐splGFP11‐KpnI, which was cloned into the OpIE2‐splGFP11‐MCS vector resulting in OpIE2‐ND1‐TEV‐twinStrep‐splGFP11. In the next step the TEV‐twinStrep element was replaced with a spacer element of either 6 amino acids (AA), 8 AA, 10 AA, or 12 AA containing a XhoI and a NheI restriction site. The linker elements used consist of out of the following amino acids: 6 AA = LEISAS, 8 AA = LEISASAS, 10 AA = LEISASGSAS, 12 AA = LEISASGSSGAS.
The full‐length expression vector splGFP1‐11 was assembled in two rounds of PCR using the synthetic construct of splGFP1‐10 as a template and two 3′PCR primers to add the splGFP11 coding sequence. The full‐length splGFP1‐11 PCR product was then cloned into the vector pJET1.2 (Thermo Scientific, Waltham, MA) and used as a template for a subsequent PCR reaction with primers containing BamHI and AvrII, respectively.
Either Phusion® High Fidelity DNA Polymerase (NEB) or KappaHiFi DNA Polymerase (Peqlab) were used for PCR amplification according to the manufacturer's protocol. All required restriction enzymes and buffers were purchased from NEB. An overview of the constructed and used SplitGFP expression vectors is shown in Figure 1.
Figure 1.
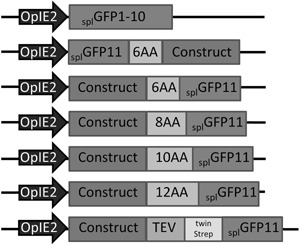
Overview of used SplitGFP expression vectors. Expression in all constructs was driven by the OpIE2 promoter (Theilmann and Stewart, 1992).
Cell Culture
BTI‐Tn‐5B1‐4 (High5™, Hi5, Invitrogen) cells and Spodoptera frugiperda (Sf21, Invitrogen) cells were cultivated at 27°C and 120 rpm in ExCell405 media (Hi5) or ExCell420 media (Sf21) respectively. Cell media were purchased from Sigma–Aldrich (St. Louis, MO). Cells were maintained in exponential growth and diluted by passaging to 0.4–0.6 × 10⁶ cells/mL every 2 or 3 days.
Transfection of the Insect Cells Using Lipofectin
Hi5 insect cells at a density of 0.4–0.6 × 10⁶ cells/mL were transfected with the respective expression plasmids using Lipofectin Transfection Reagent (Invitrogen). A DNA concentration of 2 μg per 1 × 10⁶ cells was used at a Lipofectin®: DNA ratio of 2:1. The DNA ratio of splGFP1‐10 vector and the analyzed splGFP11 tagged construct was 1:1. DNA and Lipofectin® were incubated with medium for pre‐complexing in 2.5% (v/v) of the final volume. The transfection mixture was added to the cells after 30–60 min of incubation at RT.
Cultivation in the BioLector
The BioLector Basic Microcultivation system (m2p labs) enables a direct comparison of optical cell density (OD) and green fluorescence (GFP) in up to 48 different cultures. Hence, the BioLector allows a direct assessment of the GFP signal of reassembled splGFP for the different constructs. Gain levels of the sensors were selected for measurement in the linear range. The optical density correlates directly to the cell concentration from 0.4 × 10⁶ cells/mL to 3 × 10⁶ cells/mL (Data not shown). The transfected cells were cultivated in a 48 round deep well plate (black, m2p labs) in a volume of 2 mL at 700 rpm, 27°C and 85% humidity. The measured GFP intensity was blanked against a cell culture transfected with a control plasmid solely expressing mCherry. During the experiment (80 h) the cells were not passaged.
Flow Cytometry
The Guava flow cytometer (Merck Millipore) was used to determine the transfection efficiency and to confirm the fluorescence data obtained by the BioLector. Furthermore, it was used to determine the YFP response as a control for baculoviral infection with Multibac EMBacY. The fluorescence was determined after diluting the cells 1:10 in 1× PBS.
Baculoviral Expression System (BEVS)
In order to analyze the expression of various NOD2 constructs with a N‐terminal Strep Tag (in pFlpBtM‐II as previously described) recombinant baculovirus was generated according to the Tn7 transposition based method with the EMBacY (Trowitzsch et al., 2010). To prepare a first generation of virus (Transfection supernatant, V0), 0.6 × 10⁶ Sf21 cells per well (from a suspension pre‐culture in ExCell420 media containing 5% (v/v) FCS) were seeded into 6‐well‐plates. For pre‐complexing 5 μL of the isolated recombinant bacmid and 10 μL Superfect (Qiagen #301305) were diluted in 150 μL serum free ExCell420 medium. After 10 min of incubation at RT 450 μL ExCell420 media with 5% (v/v) FCS were added to the transfection mixture and used to substitute the culture media covering the adherent cells. Finally, after 2 h of incubation at 27°C 1.5 mL of ExCell420 media with 5% (v/v) FCS were added. The virus supernatant V0 was harvested 3–5 days post transfection depending on the YFP response, as in‐line marker protein expressed from the EMBacY bacmid. One round of viral amplification in Sf21 cells followed to generate VA1. The titers of the diverse viral amplifications were determined by plaque assays to ensure a comparable quality of the different viral stocks for the different NOD2 constructs. NOD2 protein production was tested using 20 mL Hi5 cultures (1 × 10⁶ cells/mL) infected at a MOI of 2 of the respective VA1 virus stock. The course of baculoviral infection was monitored by increase in cell diameter, cell growth as well as YFP fluorescence.
SDS‐PAGE and Western Blotting
All cell extract samples were analyzed by 15% or 12.5% SDS‐PAGE. Western Blots for specific detection of strep‐tagged‐NOD2 were performed using anti‐Strep mouse monoclonal antibody (Novagen #71590) and AP‐conjugated goat anti‐mouse IgG (H + L) (Promega, Fitchburg, WI, #S372B) following standard protocols.
Results and Discussion
Automation of the SplitGFP Screen With a Microcultivation System
In a first step we had to set up the SplitGFP system and thus had to ensure the functionality of the SplitGFP (Fig. 2A) in insect cells. We measured the max. GFP fluorescence of our SplitGFP system by expression of the full‐length splGFP1‐11 in Hi5 cells in the BioLector system (Fig. 2B). To calibrate the observed fluorescence it was compared to the strong eGFP fluorescence signal. Although the full‐length splGFP1‐11 was approximately half as efficient as the eGFP, the detected fluorescence of the full‐length splGFP1‐11 provided a sensitive readout.
Figure 2.
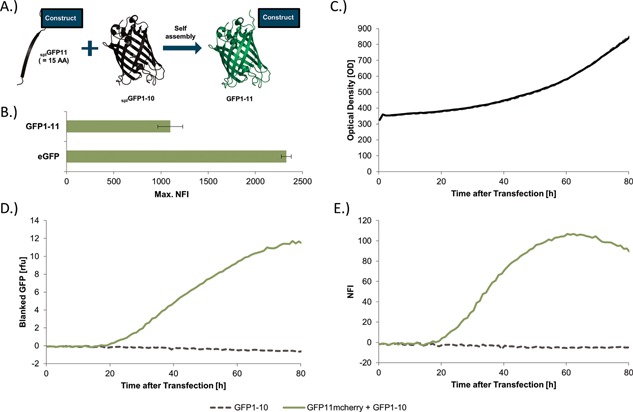
Establishment of the SplitGFP system in insect cells. (A) Schematic representation of the SplitGFP principle. One β‐strand of splGFP is fused to the protein of interest. If splGFP1‐10 is co‐expressed in the same cells, a fully active splGFP1‐11 will reassemble automatically without further interaction partners. (B) Comparison of the maximal measured fluorescence of eGFP and full‐length splGFP1‐11 in transfected Hi5 cells in the BioLector. (C) The diagram shows two Hi5 cultures, one transfected with splGFP1‐10 and the second with splGFP1‐10 and splGFP11‐mCherry. The OD for both cultures increased simultaneously. (D) In contrast, the measured GFP fluorescence only increases, when both splGFP11mCherry and splGFP1‐10 are present in the cells. Cells solely transfected with splGFP1‐10 did not show a GFP response. (E) The normalized splGFP fluorescence intensity (NFI) indicates the overall expression normalized by transfection efficacy and measured OD. The max. NFI for splGFP11mCherry was reached after 50–60 htp.
In a second step the highly expressed mCherry was used for evaluation of the reassembled splGFP1‐11 fluorescence. For this purpose mCherry N‐terminally tagged with splGFP11 was co‐expressed with splGFP1‐10 in insect cells. As a negative control insect cells were transfected only with splGFP1‐10. All cultures showed a very similar growth rate (Fig. 2C). The GFP response (Fig. 2D) resulting from reassembled splGFP of the splGFP11mCherry + splGFP1‐10 culture started to increase at 20 hpt and further increased until 80 hpt. For a higher sensitivity the BioLector gain was increased compared to Figure 2B. In contrast to the splGFP11mCherry + splGFP1‐10 culture the negative control did not show any fluorescence as expected.
To allow comparison between different BioLector runs, the measured fluorescence was normalized by the optical density (OD) and the transfection efficiency, using the following equation:
The maximum of the Normalized splGFP Fluorescence Intensity (max. NFI) was reached after 50–70 hpt (Fig. 2E) and indicated the expression yield of the target protein.
Furthermore, the SplitGFP screen was also tested in Sf21 cells, although they did not show a suitable GFP response (data not shown). This observation meets the expectation as it is probably caused by the overall lower plasmid based protein production in Sf21 cells (Bleckmann et al., 2015). In conclusion the results indicate that the SplitGFP screen is functional in Hi5 cells and expression can be monitored with the automated BioLector Multicultivation System.
Demonstration of the Suitability of the SplitGFP Screen for a Challenging Protein
In a next step the SplitGFP screen was validated with the difficult‐to‐express NOD2 target protein (Nucleotide‐binding oligomerization domain‐containing protein 2, Uniprot Q9HC29.1) also known as caspase recruitment domain‐containing protein 15 (CARD15) (Caruso et al., 2014; Philpott et al., 2014). Boundaries for 42 NOD2 constructs (Supplement) were designed after domain prediction.
These N‐terminal splGFP11 tagged NOD2 constructs were co‐expressed in Hi5 cells with splGFP1‐10 and cultivated in the BioLector for 80 h. The observed max. NFI (maximum of the Normalized Fluorescence Intensity) varied for each construct (Fig. 3). The highest splGFP signal for the NOD2 constructs was measured for the ND1 and the ND9 construct, both solely consisting of the two supposedly highly expressed Caspase activation and recruitment domains. The full length NOD2 protein (construct ND8) as well as other constructs showed a considerably lower splGFP signal, whereas others did not show any significant GFP response (construct ND26 and ND11, both constituted only of the difficult‐to‐express nucleotide‐binding domain).
Figure 3.
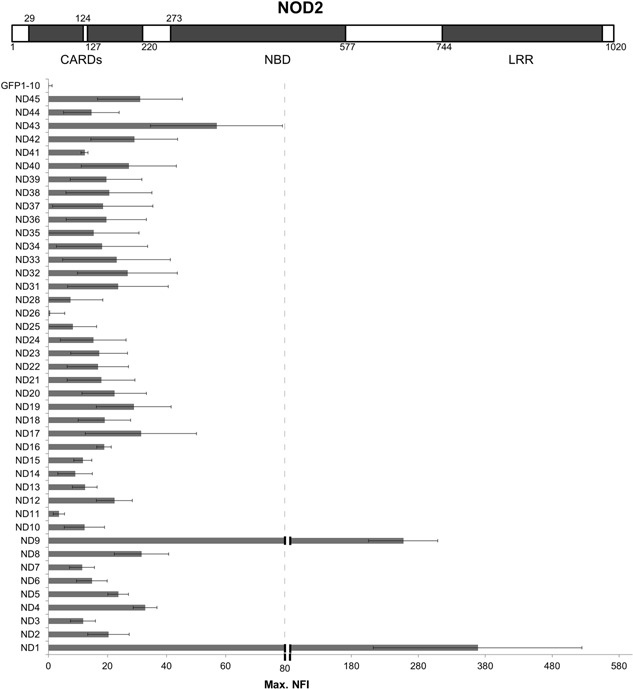
Relative NFI levels of the NOD2 constructs. A schematic representation of the NOD2 protein with predicted domain boundaries is shown. Forty‐two different NOD2 constructs with different boundaries were designed and fused to splGFP11. The SplitGFP screen in the BioLector showed the difference in expression level for each construct. The diagram below depicts the average max. NFI of at least three or more BioLector measurements.
Overall, the SplitGFP screen was clearly able to detect a whole range of different expression rates and confirmed the expected expression rates. Hence, our SplitGFP screen is able to identify the most suitable expression constructs for further production. Thus, an upscaling of the plasmid based expression of the constructs with the highest NFI signal could be directly applied for protein production and has been shown to result in adequate protein levels (Shen et al., 2014, 2015). Upscaled plasmid based expression in the absence of baculovirus might result in a higher protein quality compared to BEVS as the cell machinery is not hampered by the viral infection. Nevertheless, the preparation of high amounts of plasmid DNA would be a cost‐factor and the protein yields are lower compared to BEVS (Radner et al., 2012). Therefore, depending on the target protein and required yield, a production in BEVS might be favorable after the initial SplitGFP screen.
Correlation of the SplitGFP Signal to the Soluble Protein Expression Levels in BEVS
The results for the different NOD2 constructs clearly showed the suitability of the automated SplitGFP system for use as a fast and efficient screen for expressible proteins. However, if used as an initial screening before production in BEVS, the SplitGFP screen remains a plasmid based expression system and thus protein expression in BEVS might differ as the viral infection remodels the host cell completely. Therefore, the assumption that results obtained with the plasmid‐based SplitGFP screen can be correlated to the expression yield subsequently found with the BEVS had to be verified. Hence, nine NOD2 constructs were produced under controlled conditions in BEVS to analyze their soluble and insoluble expression rate (Fig. 4).
Figure 4.
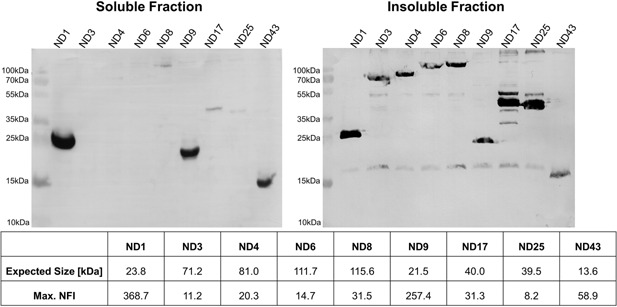
Analysis of the NOD2 expression. Western Blots for the intracellular soluble and insoluble protein fraction of the NOD2 constructs obtained with BEVS. The N‐terminal Strep tagged NOD2 constructs were produced under regulation of the p10 promoter in Hi5 cells under controlled conditions. The expression was compared with the max. NFI determined in the BioLector experiment.
The expression yields correlated well with the SplitGFP signals for the chosen constructs, with the highest Western Blot (WB) signal obtained for the three constructs that also showed the highest SplitGFP signals (ND1, ND9, ND43). The constructs with a max. NFI level of below 60 were not or only poorly visible in the WB.
Furthermore, we showed that the max. NFI only correlates with the soluble fraction but not with the insoluble protein. For example ND4, ND8, and ND17 reached a substantial but low max. NFI and showed comparable expression in the soluble fraction, whereas differences in the insoluble protein fraction were observed (Fig. 4).
Finally for a qualitative statement the yields obtained for the different NOD2 constructs by BEVS were determined after purification. After small scale purification (15 × 106 cells) only the ND1 and ND9 ( = the best constructs in SplitGFP screen) constructs showed yields that were in the measurable range of 19 μg/106 cells for ND1 and 6.5 μg/106 cells for ND9, corresponding up to ∼38 or 13 mg/L, respectively (data not shown).
In summary we showed that signal intensities (max. NFI) in our SplitGFP reflect the relative soluble expression yields that can be expected in BEVS and therefore gives a clear indication which constructs can be successfully expressed. This outcome allows an accurate choice of the optimal construct and scale of expression of the desired domains of the target protein.
Influence of the Position of the splGFP11 Tag and Spacer Length
In the data presented so far the target constructs were always N‐terminal tagged with splGFP11 with a short six amino acid spacer. To determine whether the position of the splGFP11 tag and the length of the spacer have an influence on the expression of the selected clones, C‐terminal fusion constructs for the best expressed construct ND1 were designed (Fig. 1) and tested in the BioLector. Clearly the position and length of the spacer affected the GFP response (Fig. 5). The N‐terminal splGFP11 tag outperformed all C‐terminal versions regardless of their respective spacer length. For all C‐terminal tagged constructs the measured max. NFIs were similar, although a 6 AA spacer led to a decreased sensitivity. The observed position effect is probably caused by a lower accessibility of the splGFP11 tag as protein expression should not be influenced by the length of the spacer of the C‐terminal splGFP11 tag.
Figure 5.
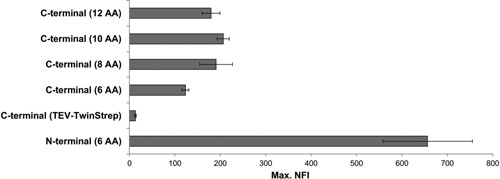
Influence of the position of the splGFP11 tag on the SplitGFP signal. The highest expressed NOD2 construct, ND1 was tagged N‐ or C‐ terminally with different spacer elements with the splGFP11 tag. The resulting SplitGFP response was measured in the BioLector. The BioLector sensitivity was slightly increased compared to the data shown in Figure 3 to accommodate the lower GFP signal of the C‐terminal tagged constructs.
Replacing the spacer element by a TEV site and a TwinStrep tag, used as spacer element between ND1 and the C‐terminal the splGFP11 tag, resulted in a substantial drop in expression (Fig. 5). Hence, other tag combinations have to be tested and evaluated to gain a better understanding of the causes leading to the reported effects on the GFP signal.
To assess the effect of N‐ or C‐terminal fusion constructs on the SplitGFP screen, nine different NOD2 N‐terminally tagged constructs were compared to their C‐terminally tagged counterparts (Fig. 6). For the C‐terminally tagged constructs, the 8 AA spacer element was chosen to obtain the best possible GFP response without unnecessarily enlarging the tag. Even though all C‐terminally tagged constructs resulted in a lower GFP signal compared to the signal for N‐terminally tagged constructs the ranking of expression was similar, confirming the suitability of the C‐terminal splGFP11 tag. A slight variation in the ranking was only observed for the weakly expressed constructs with a very low total GFP response.
Figure 6.
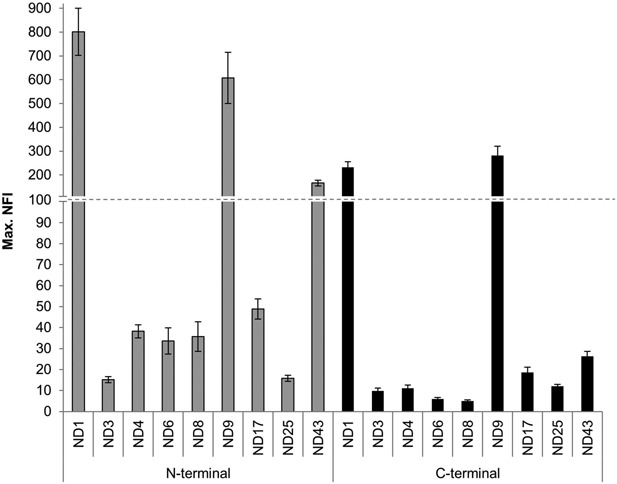
Comparison of the GFP response of nine different C‐ and N‐terminal splGFP11 tagged NOD2 constructs. The BioLector sensitivity was slightly increased compared to the data shown in Figure 3 to accommodate the lower GFP signal of the C‐terminal tagged constructs.
As the expression with either N‐ or C‐terminal tags may influence the GFP fluorescence in the SplitGFP screen due to steric hindrance of the assembly of the SplitGFP, optimally both versions should be tested. In the case of NOD2 both N‐ and C‐terminal splGFP11 have shown adequate signals for expressible constructs.
Conclusion
Our plasmid‐based SplitGFP system in insect cells represents a distinct improvement in expression screening, as it eliminates the need to test numerous constructs in the time and work consuming BEVS. To allow automation, the screen was established for the BioLector Microcultivation system. This method is able to test expression of up to 48 different constructs in one experiment lasting only 80 h. The expression is directly monitored in‐line by the fluorescence of SplitGFP and can be evaluated by the normalized max. NFI levels. Subsequently, the selected constructs, which passed the expression threshold in the initial SplitGFP screen, could be directly used for upscaled plasmid based expression. Alternatively, BEVS could be used to scale up expression, as the results from the SplitGFP screen correlate well with the yields obtained in BEVS. Moreover, we also demonstrated the suitability of both the N‐ and the C‐terminal splGFP11 tag.
In conclusion, our automated plasmid‐based SplitGFP screen in insect cells is a valuable fast method to identify constructs, which allow the expression of soluble recombinant protein by a simple assay.
We thank Dorina Schäckermann, Anke Samuels, Jan Manicke, Jaqueline Franke, Nadine Konisch and Daniela Gebauer for their excellent technical support during the experiments. Additionally, we thank Johannes Spehr and Margitta Schürig for advice during writing. Finally, we gratefully thank Victor Wray for his helpful suggestions and proof‐reading the manuscript. This work was supported by the Helmholtz Protein Sample Production Facility and by Instruct, part of the European Strategy Forum on Research Infrastructures (ESFRI).
Supporting information
Additional supporting information may be found in the online version of this article at the publisher's web‐site.
Supporting Information.
References
- Altmann F, Staudacher E, Wilson IB, März L. 1999. Insect cells as hosts for the expression of recombinant glycoproteins. Glycoconj J 16:109–123. [DOI] [PubMed] [Google Scholar]
- Apweiler R, Hermjakob H, Sharon N. 1999. On the frequency of protein glycosylation, as deduced from analysis of the SWISS‐PROT database. Biochim Biophys Acta 1473:4–8. [DOI] [PubMed] [Google Scholar]
- Bleckmann M, Fritz MH‐Y, Bhuju S, Jarek M, Schürig M, Geffers R, Benes V, Besir H, van den Heuvel J. 2015. Genomic analysis and isolation of RNA polymerase II dependent promoters from spodoptera frugiperda. PLoS ONE 10:e0132898. [DOI] [PMC free article] [PubMed] [Google Scholar]
- Brown WC, DelProposto J, Rubin JR, Lamiman K, Carless J, Smith JL. 2011. New ligation‐independent cloning vectors compatible with a high‐throughput platform for parallel construct expression evaluation using baculovirus‐infected insect cells. Protein Expr Purif 77:34–45. [DOI] [PMC free article] [PubMed] [Google Scholar]
- Bulloch EMM, Kingston RL. 2014. Identifying protein domains by global analysis of soluble fragment data. Anal Biochem 465:53–62. [DOI] [PubMed] [Google Scholar]
- Cabantous S, Pédelacq J‐D, Mark BL, Naranjo C, Terwilliger TC, Waldo GS. 2005a. Recent advances in GFP folding reporter and split‐GFP solubility reporter technologies. Application to improving the folding and solubility of recalcitrant proteins from Mycobacterium tuberculosis. J Struct Funct Genomics 6:113–119. [DOI] [PubMed] [Google Scholar]
- Cabantous S, Terwilliger TC, Waldo GS. 2005b. Protein tagging and detection with engineered self‐assembling fragments of green fluorescent protein. Nat Biotechnol 23:102–107. [DOI] [PubMed] [Google Scholar]
- Cabantous S, Waldo GS. 2006. In vivo and in vitro protein solubility assays using split GFP. Nat Methods 3:845–854. [DOI] [PubMed] [Google Scholar]
- Caruso R, Warner N, Inohara N, Núñez G. 2014. NOD1 and NOD2: Signaling, host defense, and inflammatory disease. Immunity 41:898–908. [DOI] [PMC free article] [PubMed] [Google Scholar]
- Chen H, Shaffer PL, Huang X, Rose PE. 2013. Rapid screening of membrane protein expression in transiently transfected insect cells. Protein Expr Purif 88:134–142. [DOI] [PubMed] [Google Scholar]
- Close D, Xu T, Smartt A, Rogers A, Crossley R, Price S, Ripp S, Sayler G. 2012. The evolution of the bacterial luciferase gene cassette (lux) as a real‐time bioreporter. Sensors 12:732–752. [DOI] [PMC free article] [PubMed] [Google Scholar]
- Cornvik T, Dahlroth S‐L, Magnusdottir A, Flodin S, Engvall B, Lieu V, Ekberg M, Nordlund P. 2006. An efficient and generic strategy for producing soluble human proteins and domains in E. coli by screening construct libraries. Proteins 65:266–273. [DOI] [PubMed] [Google Scholar]
- Esposito D, Chatterjee DK. 2006. Enhancement of soluble protein expression through the use of fusion tags. Curr Opin Biotechnol 17:353–358. [DOI] [PubMed] [Google Scholar]
- Hacker DL, De Jesus M, Wurm FM. 2009. 25 years of recombinant proteins from reactor‐grown cells—Where do we go from here? Biotechnol Adv 27:1023–1027. [DOI] [PubMed] [Google Scholar]
- Hunt I. 2005. From gene to protein: A review of new and enabling technologies for multi‐parallel protein expression. Protein Expr Purif 40:1–22. [DOI] [PubMed] [Google Scholar]
- Jarvis DL, Summers MD. 1989. Glycosylation and secretion of human tissue plasminogen activator in recombinant baculovirus‐infected insect cells. Mol Cell Biol 9:214–223. [DOI] [PMC free article] [PubMed] [Google Scholar]
- Jarvis DL. 2009. Baculovirus‐insect cell expression systems. Methods Enzymol 463:191–222. [DOI] [PubMed] [Google Scholar]
- Jarvis DL. 2014. Recombinant protein expression in baculovirus‐infected insect cells. Methods Enzymol 536:149–163. [DOI] [PMC free article] [PubMed] [Google Scholar]
- Kaddoum L, Magdeleine E, Waldo GS, Joly E, Cabantous S. 2010. One‐step split GFP staining for sensitive protein detection and localization in mammalian cells. Bio Techniques 49:727–728, 730, 732 passim. [DOI] [PubMed] [Google Scholar]
- McPherson CE. 2008. Development of a novel recombinant influenza vaccine in insect cells. Biol J Int Assoc Biol Stand 36:350–353. [DOI] [PubMed] [Google Scholar]
- Meyer S, Lorenz C, Baser B, Wördehoff M, Jäger V, van den Heuvel J. 2013. Multi‐host expression system for recombinant production of challenging proteins. PLoS ONE 8:e68674. [DOI] [PMC free article] [PubMed] [Google Scholar]
- Mirzaei M, Jardin B, Elias CB, Prakash S. 2008. Expression and production of human interleukin‐7 in insect cells using baculovirus expression vector system (BEVS). Appl Biochem Biotechnol 151:93–103. [DOI] [PubMed] [Google Scholar]
- Mo J, Boyle JP, Howard CB, Monie TP, Davis BK, Duncan JA. 2012. Pathogen sensing by nucleotide‐binding oligomerization domain‐containing protein 2 (NOD2) is mediated by direct binding to muramyl dipeptide and ATP. J Biol Chem 287:23057–23067. [DOI] [PMC free article] [PubMed] [Google Scholar]
- Nie Y, Bellon‐Echeverria I, Trowitzsch S, Bieniossek C, Berger I. 2014. Multiprotein complex production in insect cells by using polyproteins. Methods Mol Biol Clifton NJ 1091:131–141. [DOI] [PMC free article] [PubMed] [Google Scholar]
- Philpott DJ, Sorbara MT, Robertson SJ, Croitoru K, Girardin SE. 2014. NOD proteins: Regulators of inflammation in health and disease. Nat Rev Immunol 14:9–23. [DOI] [PubMed] [Google Scholar]
- Radner S, Celie PHN, Fuchs K, Sieghart W, Sixma TK, Stornaiuolo M. 2012. Transient transfection coupled to baculovirus infection for rapid protein expression screening in insect cells. J Struct Biol 179:46–55. [DOI] [PubMed] [Google Scholar]
- Rieffel S, Roest S, Klopp J, Carnal S, Marti S, Gerhartz B, Shrestha B. 2014. Insect cell culture in reagent bottles. MethodsX 1:155–161. [DOI] [PMC free article] [PubMed] [Google Scholar]
- Seiler CY, Park JG, Sharma A, Hunter P, Surapaneni P, Sedillo C, Field J, Algar R, Price A, Steel J, Throop A, Fiacco M, LaBaer J. 2014. DNASU plasmid and PSI:Biology‐Materials repositories: Resources to accelerate biological research. Nucleic Acids Res 42:D1253–D1260. [DOI] [PMC free article] [PubMed] [Google Scholar]
- Shen X, Hacker DL, Baldi L, Wurm FM. 2014. Virus‐free transient protein production in Sf9 cells. J Biotechnol 171:61–70. [DOI] [PubMed] [Google Scholar]
- Shen X, Pitol AK, Bachmann V, Hacker DL, Baldi L, Wurm FM. 2015. A simple plasmid‐based transient gene expression method using High Five cells. J Biotechnol 216:67–75. [DOI] [PubMed] [Google Scholar]
- Theilmann DA, Stewart S. 1992. Molecular analysis of the trans‐activating IE‐2 gene of Orgyia pseudotsugata multicapsid nuclear polyhedrosis virus. Virology 187:84–96. [DOI] [PubMed] [Google Scholar]
- Trowitzsch S, Bieniossek C, Nie Y, Garzoni F, Berger I. 2010. New baculovirus expression tools for recombinant protein complex production. J Struct Biol 172:45–54. [DOI] [PubMed] [Google Scholar]
- Waldo GS, Standish BM, Berendzen J, Terwilliger TC. 1999. Rapid protein‐folding assay using green fluorescent protein. Nat Biotechnol 17:691–695. [DOI] [PubMed] [Google Scholar]
- Yumerefendi H, Tarendeau F, Mas PJ, Hart DJ. 2010. ESPRIT: An automated, library‐based method for mapping and soluble expression of protein domains from challenging targets. J Struct Biol 172:66–74. [DOI] [PubMed] [Google Scholar]
Associated Data
This section collects any data citations, data availability statements, or supplementary materials included in this article.
Supplementary Materials
Additional supporting information may be found in the online version of this article at the publisher's web‐site.
Supporting Information.


