

Summary
Objective
Medical weight loss could change sweet taste threshold and preferences. The decrease in sweet taste preferences may, in turn, help in the maintenance of weight loss. This study examined the association between sweet taste preferences at baseline and weight change during a medical weight management programme and the impact of diet‐induced weight loss on sweet taste preferences.
Methods
Adult patients with body mass index ≥32 kg m−2 were recruited from a medical weight management clinic. Sweet taste preference was assessed using a forced‐choice, paired‐comparison tracking method before and after a very‐low‐calorie diet (VLCD).
Results
Twenty participants were included in the analysis: mean age was 53.1 (standard deviation [SD]: 11.4) years, and 14 were female. The mean body mass index was 41.4 (SD: 7.5) kg m−2. The median preferred sucrose concentration before VLCD was 0.45 M. Following VLCD, mean change in weight was −13.3 (SD: 6.6) kg, and percentage weight change was −11.3% (SD: 5.9%). Based on mixed models with and without adjustment for demographic factors, diabetes status and smoking history, preferred sucrose concentration at baseline did not predict change in longer‐term body weight. The change of preferred sucrose concentration following 12 weeks of VLCD was not significant (P‐value 0.95).
Conclusions
Change in weight during and after VLCD was not associated with sweet taste preferences at baseline. After diet‐induced weight loss, sweet taste preferences did not change.
Keywords: Obesity, sweet taste, taste preference, very‐low‐calorie diet
Introduction
Obesity is frequently managed by caloric restriction. In 2004, more than 200,000 Americans used very‐low‐calorie diets (VLCDs) to lose weight 1. However, like any weight loss programme that does not incorporate long‐term lifestyle modifications, people who lose weight with VLCD usually start to regain weight within a year and often regain their lost weight completely over 5 years 2. By examining and understanding a priori the bio‐behavioural factors that predispose an individual to weight loss failure is critical to developing and implementing more tailored and personalized treatment options to increase the likelihood of successful weight loss and weight loss maintenance.
In this study, we hypothesized that patients who had lower sweet taste preferences would have greater weight loss during and after VLCD. In humans, evidence on sweet taste preference assessed by a sensory test and the choice of sweet food is limited 3, 4, 5, and no studies have evaluated sweet taste preference and weight change prospectively. Therefore, as the first aim, this study assessed the association between sweet taste preferences at baseline and weight change during an intensive medical weight management programme employing VLCD.
It has also been postulated that sweet taste preference is lower following weight loss, although currently available evidence does not entirely support this hypothesis 6, 7. A study of 47 overweight women showed no change in pleasantness of sweet taste after medical weight management, which yielded an average weight loss of 35 lb 6. A study of 20 people who underwent a 10‐week medical weight management programme (weight reduction of ~10 lb) and 12 who underwent a 6‐week protein‐sparing modified fast regimen (weight reduction of 24 lb) did not show a change in hedonic ratings of sucrose solutions 7. Contrary to what has been observed with medical weight loss, some studies 6, 8, but not all 9, have shown reductions of hedonic responses to sweet taste after bariatric surgery, i.e. jejunoileostomy 6, 8 or Roux‐en‐Y gastric bypass surgery 9. As reviewed by Miras et al., patients who underwent surgery ‘no longer enjoyed’, ‘were not interested in’ or ‘lost their taste for’ sweet or fatty foods 10. It is thought that both medical and surgical weight loss have common mechanisms to alter the sweet taste preferences through weight loss. And, if, in fact, medical weight loss decreases sweet taste preferences, it may help in the maintenance of long‐term weight loss maintenance. Therefore, as a second aim, this study examined sweet taste preferences before and after an intensive medical weight loss intervention.
Methods and procedures
Study setting and study subjects
The study was conducted with the University of Michigan Weight Management Program (WMP). The primary goal of the WMP is to identify strategies that result in cost‐effective, long‐term weight loss for overweight and obese adults. Details of the WMP have been described elsewhere 11. Briefly, men and non‐pregnant women aged 18 years or older with body mass index (BMI) ≥32 kg m−2 with a comorbid health condition or ≥35 kg m−2 irrespective of additional risk factors were invited to enrol in the weight management programme. The programme is a 2‐year intensive, multicomponent weight management programme that incorporates aggressive caloric restriction employing VLCD with total meal replacement (HMR®, Boston, MA, USA) of ~800 kcal d−1 over 12 weeks to promote 15% weight loss 12. Patients may opt in to participate in a comprehensive research component performed at baseline, after 15% weight loss and at the end of the 2‐year programme consisting of a metabolic testing (resting energy expenditure by indirect calorimetry, VO2 max, body composition by dual energy X‐ray absorptiometry (DXA), metabolomics, lipomics and DNA storage) and questionnaires asking about health‐related quality of life and mood. The initial intensive dietary intervention is followed by low‐calorie diet employing conventional foodstuffs and increased physical activity with regular monthly follow‐up to promote lasting behavioural change. Specifically, participants are transitioned from VLCD to a partial meal replacement plan, which they followed for 2 weeks. The partial meal replacement plan provides 1,000–1,200 kcal d−1 and consists of three meal replacement products and one 400‐kcal conventional food meal with explicitly defined portion sizes. Over the next 2 weeks, participants are transitioned to a conventional food‐based meal plan with an appropriate caloric intake to promote weight stability. Energy needs were calculated using the Mifflin–St Jeor equation from the Nutrition Care Manual website 13 or based on resting energy expenditure. Twenty participants from the WMP who were about to start VLCD were recruited for this study. The study protocol was reviewed and approved by the Institutional Review Board at the University of Michigan, and all participants provided written informed consent.
Research visits
Each participant attended two research visits (Figure 1). The first research visit (visit 1) was scheduled up to 28 d before the first day of VLCD, and the second research visit (visit 2) was scheduled within 45 d after the last day of VLCD. The first and last days of VLCD were determined through participants' clinic records. The research visits were scheduled in the morning, and participants were asked to fast after midnight and not to brush their teeth or chew gum within 1 h of their appointment time. The research visits were also scheduled so that the participants did not have any febrile illnesses or acute oral or nasal diseases or have any dental procedures within 36 h before the research visits. Visit 1 involved a questionnaire regarding demographic information, and both visits 1 and 2 included assessment of medical history, medication use and smoking status. After completing the questionnaires at visits 1 and 2, the participants underwent sweet taste preference procedures.
Figure 1.
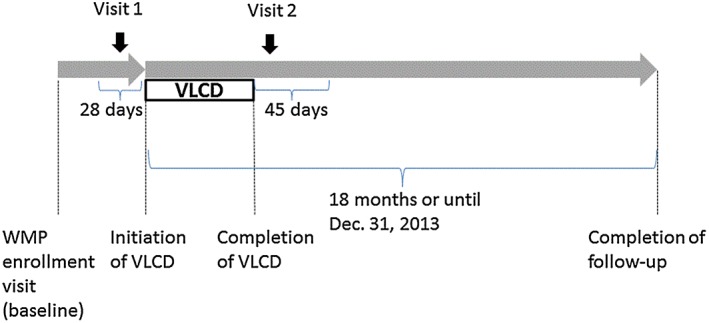
Study design. VLCD, very‐low‐calorie diet; WMP, weight management programme.
Assessment of sweet taste preference
Sweet taste preference was evaluated using a forced‐choice, paired‐comparison tracking method 14. Ten sucrose concentrations – 0.043, 0.066, 0.097, 0.144, 0.212, 0.310, 0.450, 0.645, 0.905 and 1.239 M equivalent sucrose (prepared as 1.5%, 2.3%, 3.4%, 5.1%, 7.6%, 11.4%, 17.1%, 25.6%, 38.4% and 57.7% weight‐to‐solvent volume) – were used for this study 15, 16. The solutions were prepared fresh for each participant using food grade sucrose (American Sugar Refining, Inc. Baltimore, MD, USA) and distilled drinking water (Absopure, Plymouth, MI, USA). In this procedure, participants were asked to taste in their whole mouth without swallowing a pair of 5 mL solutions that differed in sucrose concentration. After 5 s of tasting one solution, the participants were asked to spit the solution into a basin and rinse their mouths with distilled water before tasting another solution. The participants were asked which solution was preferred, and the response was recorded.
Each research visit had two series of taste tests. The first pair of each series included the two middle range concentrations (0.144 and 0.450 M). The second pair was 0.043 and 0.144 M for participants who chose 0.144 M in the first pair and 0.450 and 1.239 M for participants who chose 0.450 M in the first pair. The next pair and the pairs thereafter were the preferred concentration that the participant chose from the previous pair and (i) one step lower concentration if the participant chose the lower concentration in the previous pair or (ii) one step higher concentration if the participant chose the higher concentration in the previous pair. This pattern continued until a series was concluded. A series was concluded when the participant (i) chose the same preferred concentration consecutively as the higher and lower concentrations of the pairs or (ii) chose the lowest (0.043 M) or highest (1.239 M) concentration as their preferred concentrations twice consecutively. If the series did not conclude at the 12th pair, it ended without determining the most preferred sucrose concentration. The second series was performed after a 3‐min break after the first series. The order of the solutions was randomized within a pair by a computer programme to offset the potential bias associated with a uniform order of presentation and minimize potential carry‐over effects 16. The time interval of 30–60 s between pairs was maintained. The most preferred sucrose concentration was defined as the geometric mean of the most preferred sucrose concentration at each series, which was the concentration chosen at the last two pairs of the series.
Anthropometric measurements
Data on baseline height and weight were collected at the WMP enrollment visit; data on weight were collected via medical records for 18 months from initiation of the VLCD or until December 2013, whichever came first. All WMP patients were weighed on a calibrated scale (Scale‐Tronix Model 6002, White Plains, NY, USA), and height was measured using a wall‐mounted stadiometer (Easy‐Glide Bearing Stadiometer, Perspective Enterprises, Portage, MI, USA). Percent change in body weight was calculated based on the difference of body weight from the baseline.
Statistical analyses
First, characteristics of study subjects were described, and preferred sucrose concentrations were compared by characteristics. Wilcoxon's rank tests were used because the distribution of preferred sucrose concentrations was not normal.
Second, to examine the association between preferred sucrose concentrations at visit 1 and body‐weight change after VLCD, mixed models were used to account for the repeated measurements of body weight within a subject. The outcome variable was the percentage change in body weight from baseline. The initial model included preferred sucrose concentration, weeks elapsed from baseline and an interaction term between the preferred sucrose concentration and week. Because different rates of weight change would be expected during VLCD treatment (for approximately 12 weeks) and after VLCD treatment, piecewise regression modelling method was used with a knot at 12 weeks. The models included a random effect of participants accounting for a correlated error due to repeated measurements over time assuming a compound symmetry covariance structure. As in the initial unadjusted model, we constructed two multivariate models. Multivariate model 1 included fixed variables for age, sex and race, and multivariate model 2 also included fixed variables for education, smoking and diabetes status in addition to the variables included in the unadjusted model.
Lastly, preferred sucrose concentrations were compared before and after VLCD using Wilcoxon's signed rank tests. All statistical analyses used sas® version 9.3 (SAS Institute Inc., Cary, NC, USA). The type I error was set at 0.05.
Results
Table 1 shows the characteristics of the 20 study participants in the analyses. The mean age was 53.1 (standard deviation [SD]: 11.4) years, and 14 participants were female. Six participants were African–American, and 14 were Caucasians. Mean BMI was 41.4 kg m−2 (SD: 7.5 kg m−2). Among the 20 participants initially recruited, two participants' preferred sucrose concentration was assessed only once at visit 1 because of errors while conducting the taste tests. If the preferred sucrose concentrations were measured only once, the geographic means of the two series of taste tests were substituted with the preferred sucrose concentration assessed only once. The Spearman's correlation coefficients between the two repeated measurements of most preferred sucrose concentration were 0.90 and 0.88 at visits 1 and 2, respectively. Also, two participants in the analysis did not initiate VLCD within 28 d from visit 1 taste assessment as anticipated (31 and 37 d from visit 1 to the initiation of VLCD), and one participant in the analysis had BMI at the baseline (29.4 kg m−2) that was slightly less than in the intended range to enrol in the WMP. When analyses excluding these participants (total four, accounting for overlap) were repeated, the result of the analyses was essentially unchanged.
Table 1.
Characteristics of study participants stratified by taste preference at visit 1
| Characteristics | Frequency | Median preferred sucrose concentration (range) | P‐value** |
|---|---|---|---|
| Overall | 20 | 0.45 (0.07, 1.24) | |
| Age (year) | 0.81 | ||
| 18–40 | 4 | 0.45 (0.08, 1.24) | |
| ≥40 | 16 | 0.41 (0.07, 1.24) | |
| Sex | 0.73 | ||
| Female | 14 | 0.45 (0.07, 1.24) | |
| Male | 6 | 0.46 (0.10, 0.91) | |
| Race | 0.03 | ||
| African–American | 6 | 0.68 (0.45, 1.24) | |
| Caucasian | 14 | 0.14 (0.07, 0.91) | |
| Education | 0.83 | ||
| Less than bachelor | 6 | 0.51 (0.08, 0.91) | |
| Bachelor or above | 14 | 0.45 (0.07, 1.24) | |
| Smoking | 0.83 | ||
| Never | 14 | 0.45 (0.07, 1.24) | |
| Past/current | 6 | 0.33 (0.08, 0.91) | |
| Diabetes mellitus | 0.37 | ||
| No | 12 | 0.45 (0.08, 1.24) | |
| Yes | 8 | 0.41 (0.07, 0.91) | |
| BMI (kg m−2)* | 0.16 | ||
| <40 | 10 | 0.26 (0.07, 0.91) | |
| ≥40 | 10 | 0.49 (0.08, 1.24) |
Body weight and BMI were measured at the weight management programme enrollment visit.
P‐values were based on Wilcoxon's rank tests.
BMI, body mass index.
At visit 1, when taste testing was conducted at a median of 6.5 (range 1 to 37) d from the initiation of VLCD, the median preferred sucrose concentration was 0.45 M. The range was 0.07–1.24 M. The distribution was not normal (P‐value 0.01 by a Shapiro–Wilk test) and was skewed to the right. The preferred sucrose concentration was significantly higher in African–American patients (median 0.68 M) than in Caucasian patients (median 0.14) (P‐value 0.03). The preferred sucrose concentrations were not different by other socio‐demographic or medical conditions (Table 1).
Table 2 presents the effects of preferred sucrose concentration at visit 1 and immediately following VLCD (visit 2) on body‐weight change (%) over the 18‐month course of the WMP (including the period of VLCD and the maintenance) estimated by mixed models. Based on the unadjusted mixed model, preferred sucrose concentration at visit 1 did not predict change in body weight over time. Body weight decreased by 0.811% (standard error [SE]: 0.094%) per week (P‐value <0.01) during the period of VLCD (until 12 weeks) and became stable with a non‐significant increase of 0.003% (SE: 0.018%) per week (P‐value 0.86) during the maintenance phase (week 12 and thereafter up to 18 months). Body‐weight change did not differ based on the preferred sucrose concentration both during the period of VLCD and during the maintenance phase. The decrease in body weight was greater by 0.031% (SE: 0.016%) per week for every 0.1 M increment in preferred sucrose concentration at visit 1 (P‐value 0.05) during the period of VLCD. During the maintenance phase (12 weeks and thereafter), the increase was greater by 0.003% (SE: 0.016%) per week for every 0.1 M increment in preferred sucrose concentration (P‐value 0.84). These differences in body‐weight change by preferred sucrose concentration were not statistically significant. The results were essentially unchanged after adjusting for basic demographic factors, diabetes status and smoking history. Figure 2 is a graphical presentation of the association between the preferred sucrose concentration at visit 1 and body‐weight change over the course of the study.
Table 2.
Body‐weight change (%) per week during the weight management programme associated with preferred sucrose concentration
| Body‐weight change (%) | Unadjusted | Further adjusted for age, sex and race | Further adjusted for education, smoking and diabetes | ||||
|---|---|---|---|---|---|---|---|
| Coefficient (SE) | P‐value | Coefficient (SE) | P‐value | Coefficient (SE) | P‐value | ||
| 0.1 M higher preferred sucrose concentration | 0.165 (0.169) | 0.34 | −0.052 (0.323) | 0.87 | −0.031 (0.327) | 0.93 | |
| Until 12 weeks | Per week | −0.811 (0.094) | <0.01 | −0.812 (0.105) | <0.01 | −0.807 (0.105) | <0.01 |
| Per week for 0.1 M higher preferred sucrose concentration | −0.031 (0.016) | 0.05 | −0.031 (0.017) | 0.06 | −0.032 (0.017) | 0.06 | |
| At 12 weeks and thereafter | Per week | 0.003 (0.018) | 0.86 | 0.005 (0.018) | 0.77 | 0.005 (0.019) | 0.77 |
| Per week for 0.1 M higher preferred sucrose concentration | 0.003 (0.016) | 0.84 | 0.005 (0.016) | 0.75 | 0.005 (0.016) | 0.76 | |
SE, standard error.
Figure 2.
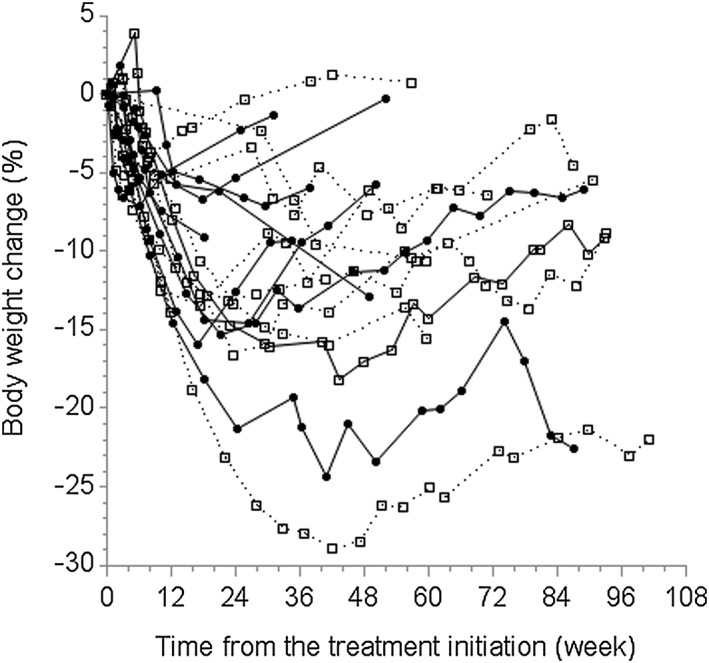
Change in body weight (%) based on the sweet taste preference at visit 1. Open squares with dotted lines represent participants with the most preferred sucrose concentration lower than the median (N = 9). Closed circles with solid lines represent participants with the most preferred sucrose concentration higher than the median (N = 11).
Repeated taste testing was performed after VLCD was conducted for 12 of the 16 participants who were followed to the end of VLCD. The duration of VLCD was 17.8 weeks (SD: 5.3 weeks) as many participants in the programme extended the period of VLCD. Following VLCD, mean (SD) change in weight was −13.3 kg (6.6 kg), percentage weight change was −11.3% (5.9%) and change in BMI was −4.7 kg m−2 (2.4 kg m−2). Visit 2 occurred within a median of 20.5 d (range: 3–44 d) from the end of VLCD. Figure 3 presents each participant's preferred sucrose concentration before and after VLCD. Using Wilcoxon's signed rank test, accounting for non‐normal distribution of preferred sucrose concentrations, the change in preferred sucrose concentration before and after VLCD was not significant (P‐value 0.95).
Figure 3.
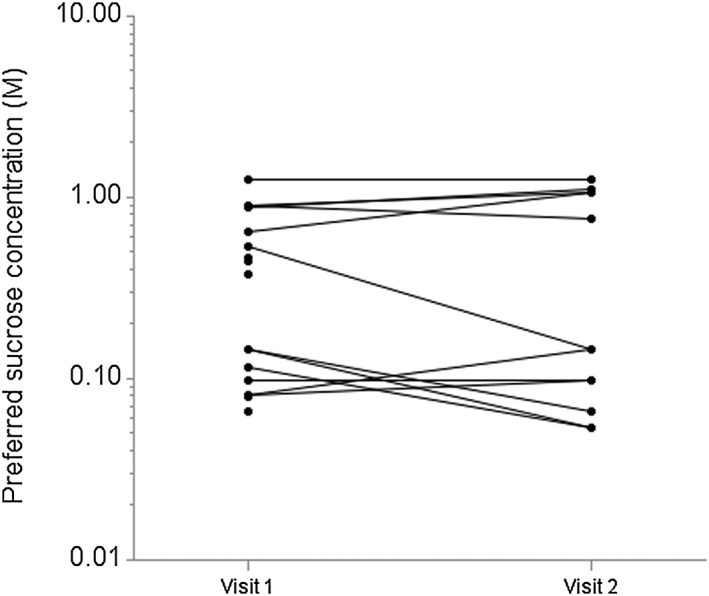
Change in sweet taste preference after very‐low‐calorie diet (VLCD). Overlapped observations are presented using jittering for the preferred sucrose concentration up to ±5%.
Discussion
In this study, there was no association between sweet taste preferences at visit 1 and weight change during or for up to 18 months after initiation of VLCD. There was also no significant change in sweet taste preferences following an intensive medical weight management intervention.
It was initially hypothesized that preference for lower levels of sweetness might be associated with greater weight loss at 12 weeks and greater weight loss maintenance after VLCD for 18 months through a reduced consumption of sweet foods. The findings from this study did not support this hypothesis. However, the direction of the change in percent body weight suggested that people who like sweet taste lose more weight with VLCD, which may be in part due to sweetness associated with the meal replacement shakes.
It was also initially thought that intensive medical weight management would change sweet taste preferences, but the findings in this study did not support this hypothesis. The findings from previous studies had similar outcomes 6, 7. The information from this study suggests that the change in taste preference among bariatric surgery patients 6, 8 is not due to subsequent changes in body weight but rather to other mechanisms. The information is also useful to learn how robust taste preference is after 12 weeks of VLCD and significant weight loss. In children 17 and adults 18, frequent exposure to certain tastes is known to induce preference to the tastes. The repeated exposure to liquid meal replacements, which are known to be sweet, might have offset the potential decrease in sweet taste liking.
To our knowledge, this is the first study to assess the association between sweet taste preferences and weight regain during and after VLCD. It is also one of the few studies 6, 7 to assess the change in sweet taste preferences during and after VLCD. Larger and more detailed investigations are required, including caloric intake specifically from sweet foods. Additionally, separate evaluation of liking and wanting 19 of sweet taste might be important when considering the link to actual dietary intake.
Even though this study did not investigate sweet taste detection/recognition thresholds, there are a few publications that suggest that medical and surgical weight loss might decrease sweet taste thresholds in humans. One study has shown that sweet taste detection threshold decreased after a medical weight loss programme 20. With regard to surgical weight loss, two studies showed that sweet taste detection or recognition thresholds decreased after Roux‐en‐Y gastric bypass surgeries 9, 21, although another study did not find the same change 22. Decreased sweet taste detection or recognition threshold may lead to increased sweet taste intensity, which may result in a heightened pleasantness of sweet taste. In this study, we did not measure sweet taste intensity. Future research is warranted to elucidate the relationships among threshold, suprathreshold intensity and pleasantness of taste.
Apart from the results of the main analyses of this study, significant differences in sweet taste preference between two racial groups were observed: African–American participants had higher preferred sucrose concentrations than Caucasian participants. Although this is consistent with previous reports 23, 24, confirmatory studies using representative population‐based samples are warranted to test the racial differences in sweet taste preferences.
A major limitation of this study is its small sample size. Previous studies on this topic tended to be small except for two with sample sizes of approximately 50 6, 7. It is possible that the current study was underpowered for the changes in sweet taste preference after medical weight loss management and prediction of the longer‐term change in weight during and after VLCD by sweet taste preference. In addition, the relatively low rate of the follow‐up reduced the actual statistical power. Although it is not common to administer VLCD for more than a few months, it is also possible that 12 weeks of exposure to VLCD might have been insufficient to alter sweet taste liking. In addition to a small sample size, this study did not collect information on adherence to VLCD systematically, although all patients received counselling on their adherence as a part of weight loss programme and participants lost a substantial amount of weight. Therefore, the findings might have to be interpreted as an effect of medical weight loss intervention rather a specific effect of VLCD. Future studies with larger sample sizes and more complete follow‐up are needed.
In conclusion, sweet taste preference at baseline did not predict longer‐term change in weight during or after VLCD, and sweet taste preferences did not change immediately after VLCD. Given the complexity of the potential mechanisms by which weight loss can modify taste perception and preference, future studies with greater sample size, more comprehensive data collection on dietary habits and different dietary interventions are warranted.
Conflict of Interest Statement
The authors declare no conflict of interest.
Acknowledgements
K. A. designed the research; K. A. and L. A. conducted the research, and K. A. and M. K. analysed the data; K. A., M. K., A. R. and W. H. H. wrote the paper; and K. A. had primary responsibility for the final content. C. F. was responsible for the collection of anthropometric data and nutrition education and counselling of participants. All authors read and approved the final manuscript.
This study was supported by the American Diabetes Association 7‐10‐MERCK‐03 (W. H. H. and K. A.) and the Stefan S. Fajans GlaxoSmithKline Professorship in Diabetes (W. H. H. and L. A.). This work utilized Core Services of the University of Michigan Nutrition and Obesity Research Center (P30DK089503), the Michigan Diabetes Research and Training Center (P60DK020572), the Michigan Center for Diabetes Translational Research (P30DK092926) and the Michigan Institute of Clinical and Health Research (UL1RR024986) by the National Institutes of Health. The authors thank Ms Rujuta Umaji for her assistance during data collection. We thank editor(s) of Sibia Proofreading for proofreading this manuscript.
Asao, K. , Rothberg, A. E. , Arcori, L. , Kaur, M. , Fowler, C. E. , and Herman, W. H. (2016) Sweet taste preferences before and after an intensive medical weight loss intervention. Obesity Science & Practice, 2: 189–195. doi: 10.1002/osp4.33.
References
- 1. Tsai A, Wadden T. The evolution of very‐low‐calorie diets: an update and meta‐analysis. Obesity 2006; 14: 1283–1293. [DOI] [PubMed] [Google Scholar]
- 2. National Task Force on the Prevention and Treatment of Obesity, National Institutes of Health . Very low‐calorie diets. JAMA 1993; 270: 967–974. [PubMed] [Google Scholar]
- 3. Lanfer A, Knof K, Barba G, et al Taste preferences in association with dietary habits and weight status in European children: results from the IDEFICS study. Int J Obes (Lond) 2012; 36: 27–34. [DOI] [PubMed] [Google Scholar]
- 4. Tepper BJ, Hartfiel LM, Schneider SH. Sweet taste and diet in type II diabetes. Physiol Behav 1996; 60: 13–18. [DOI] [PubMed] [Google Scholar]
- 5. Mattes RD, Mela DJ. Relationships between and among selected measures of sweet‐taste preference and dietary intake. Chem Senses 1986; 11: 523–539. [Google Scholar]
- 6. Rodin J, Moskowitz HR, Bray GA. Relationship between obesity, weight loss, and taste responsiveness. Physiol Behav 1976; 17: 591–597. [DOI] [PubMed] [Google Scholar]
- 7. Johnson W, Keane T, Bonar J, Downey C. Hedonic ratings of sucrose solutions – effects of body‐weight, weight‐loss and dietary restriction. Addict Behav 1979; 4: 231–236. [DOI] [PubMed] [Google Scholar]
- 8. Bray GA. Intestinal bypass surgery for obesity decreases food intake and taste preferences. Am J Clin Nutr 1976; 29: 779–783. [DOI] [PubMed] [Google Scholar]
- 9. Bueter M, Miras AD, Chichger H, et al Alterations of sucrose preference after Roux‐en‐Y gastric bypass. Physiol Behav 2011; 104: 709–721. [DOI] [PubMed] [Google Scholar]
- 10. Miras A, le Roux C. Bariatric surgery and taste: novel mechanisms of weight loss. Curr Opin Gastroenterol 2010; 26: 140–145. [DOI] [PubMed] [Google Scholar]
- 11. Rothberg AE, McEwen LN, Fraser T, Burant CF, Herman WH. The impact of a managed care obesity intervention on clinical outcomes and costs: a prospective observational study. Obesity (Silver Spring, Md) 2013: 2157–2162. [DOI] [PMC free article] [PubMed] [Google Scholar]
- 12. Anderson JW, Reynolds LR, Bush HM, Rinsky JL, Washnock C. Effect of a behavioral/nutritional intervention program on weight loss in obese adults: a randomized controlled trial. Postgrad Med 2011; 123: 205–213. [DOI] [PubMed] [Google Scholar]
- 13. Academy of Nutrition and Dietetics . Nutrition Care Manual [01/05/2016]. Available from: https://www.nutritioncaremanual.org/. [DOI] [PubMed]
- 14. Mennella JA, Lukasewycz LD, Griffith JW, Beauchamp GK. Evaluation of the Monell forced‐choice, paired‐comparison tracking procedure for determining sweet taste preferences across the lifespan. Chem Senses 2011; 36: 345–355. [DOI] [PMC free article] [PubMed] [Google Scholar]
- 15. Handbook CRC. Concentrative properties of aqueous solutions: density, refractive index freezing point depression, and viscosity In: Haynes W. M. “Mickey”. (ed). CRC Handbook of Chemistry and Physics. CRC Press/Taylor and Frances: Boca Raton, FL, 2012. [Google Scholar]
- 16. Asao K, Luo W, Herman WH. Reproducibility of the measurement of sweet taste preferences. Appetite 2012; 59: 927–932. [DOI] [PMC free article] [PubMed] [Google Scholar]
- 17. Birch LL, Marlin DW. I don't like it; I never tried it: effects of exposure on two‐year‐old children's food preferences. Appetite 1982; 3: 353–360. [DOI] [PubMed] [Google Scholar]
- 18. Pliner P. The effects of mere exposure on liking for edible substances. Appetite 1982; 3: 283–290. [DOI] [PubMed] [Google Scholar]
- 19. Berridge KC, Robinson TE, Aldridge JW. Dissecting components of reward: ‘liking’, ‘wanting’, and learning. Curr Opin Pharmacol 2009; 9: 65–73. [DOI] [PMC free article] [PubMed] [Google Scholar]
- 20. Umabiki M, Tsuzaki K, Kotani K, et al The improvement of sweet taste sensitivity with decrease in serum leptin levels during weight loss in obese females. Tohoku J Exp Med 2010; 220: 267–271. [DOI] [PubMed] [Google Scholar]
- 21. Burge J, Schaumburg J, Choban P, Disilvestro R, Flancbaum L. Changes in patients taste acuity after Roux‐en‐Y gastric bypass for clinically severe obesity. J Am Diet Assoc 1995; 95: 666–670. [DOI] [PubMed] [Google Scholar]
- 22. Scruggs DM, Buffington C, Cowan GS. Taste acuity of the morbidly obese before and after gastric bypass surgery. Obes Surg 1994; 4: 24–28. [DOI] [PubMed] [Google Scholar]
- 23. Greene LS, Desor JA, Maller O. Heredity and experience: their relative importance in the development of taste preference in man. J Comp Physiol Psychol 1975; 89: 279–284. [DOI] [PubMed] [Google Scholar]
- 24. Desor JA, Greene LS, Maller O. Preferences for sweet and salty in 9‐ to 15‐year‐old and adult humans. Science 1975; 190: 686–687. [DOI] [PubMed] [Google Scholar]