

Summary
Background
Although the serum adiponectin level is inversely correlated to body mass index and closely associated with obesity and related diseases, neither the impact of weight loss on the adiponectin level nor other factors that might influence the adiponectin level during weight loss intervention are well documented.
Objective
The objective of the study is to assess the change in the serum adiponectin level during weight loss intervention and to determine if sleep parameters affect the serum adiponectin level.
Methods
Ninety women with overweight or obesity aged 25 to 65 years completed a 7‐month cognitive behavioural therapy based weight loss intervention that included dieting, exercise and stress management. Serum adiponectin level, body fat percent, symptoms of depression and anxiety and objective sleep parameters, assessed by actigraphy, were measured at baseline and at the end of the intervention.
Results
The serum adiponectin level was significantly increased after the weight loss intervention (P < 0.001). In a multiple regression analysis, the change of the adiponectin level was positively associated with the magnitude of body fat loss (β = −0.317, P < 0.001) and an increase of sleep minutes (β = 0.210, P = 0.043).
Conclusion
An increase in objective sleep duration was related to a significantly increased serum adiponectin level independently of the change of body fat during the weight loss intervention.
Keywords: Actigraphy, adiponectin, obesity, sleep duration
Introduction
Obesity is a risk factor for a number of diseases, including cardiovascular disease, diabetes mellitus, sleep disorders and several cancers, and is associated with an increased risk of morbidity and reduced life expectancy 1. Although the biological mechanisms that mediate the association of obesity and chronic diseases are not fully understood, alternation in hormone signalling, especially insulin, sex steroids and adipokine pathways, may play an important role 2, 3.
Adiponectin is an adipokine that is secreted by adipocyte cells. It is an insulin‐sensitizing, anti‐angiogenic, anti‐inflammatory hormone that plays an important role in energy homoeostasis and lipid and glucose metabolism 4, 5. A low serum adiponectin level has been reported to be associated with a variety of diseases, including type 2 diabetes 6, 7, metabolic syndrome 8, 9, cardiovascular disease 10, sleep apnoea syndrome 11, 12, cancer 13 and depression 14, 15. Furthermore, the circulating adiponectin level is inversely related to body weight, especially visceral fat accumulation.
However, neither the impact of weight loss on the adiponectin level 8, 16 nor factors that influence the adiponectin level during weight loss intervention are known. Some studies have demonstrated an increase in the adiponectin level 17, 18. In contrast, others found no such change 19 after weight loss intervention for obesity. In addition, the results are inconsistent about whether or not the magnitude of weight loss and the changes in the adiponectin level are associated 17, 18, 19, 20, 21.
Sleep restriction 22 and obstructive sleep apnoea (OSA) 11, 23 have been reported to alter the adiponectin level. Both short sleep duration 24, 25 and poor sleep quality 26 have been associated with obesity, and we recently reported that baseline objective sleep quality was predictive of the magnitude of weight loss in our cognitive behavioural therapy (CBT) weight loss programme 27. However, to our knowledge, no previous studies have assessed the impact of sleep on a change in the adiponectin level during weight loss intervention.
In the present study, we assessed the change in the serum adiponectin level during the 7‐month weight loss phase of our CBT for obesity. We also evaluated clinical variables, including objective sleep parameters, that might influence the adiponectin level during weight loss intervention. We hypothesized that the greater the magnitude of fat loss, the larger would be the degree of increase in the serum adiponectin level. Furthermore, we also hypothesized that improvement of sleep would be associates with an increase in the serum adiponectin level.
Methods
Study design
This investigation was a part of a randomized controlled study consisting of a two‐phase trial that examined two strategies for maintaining weight loss. The weight loss phase provided an intensive programme of CBT that lasted 7 months. Participants who lost at least 5% of their initial body weight during the weight loss phase were eligible for a 3‐month programme of weight maintenance. In this phase, the participants were randomized to one of two weight loss maintenance interventions, with follow‐up for 2 years after the end of treatment. All of the participants provided informed consent, and the Institutional Review Board of Kyushu University Hospital approved the study protocol.
Eligibility
All of the participants were women aged 20 to 65 years with a BMI of 25 kg m−2 or higher. They were able to understand and complete self‐report questionnaires written in Japanese without assistance and had no physical impairment that would preclude simple exercise. Those who met the following criteria were excluded from the study: weight loss of more than 5 kg during the previous 6 months, current diagnosis of bulimia nervosa, past history of anorexia nervosa, current pregnancy or breastfeeding, planning to become pregnant within the next 24 months, taking any form of medication that would affect body weight, suffering from any health disorder affecting body weight, receiving nasal continuous positive airway pressure (nCPAP) therapy for sleep apnoea syndrome, receiving current treatment for a psychiatric disorder or planning to move within the next 10 months.
Recruitment and entry
We recruited participants through the local newspaper, the university website, posters in the university hospital or hospitals near the university, and a television programme. Those who were interested and potentially eligible were scheduled for an information session to learn more about the study. At the information session, the principal investigator provided the details of the study and answered questions from the participants. Those who met the eligibility criteria were enrolled in the study. After informed consent was obtained, we collected demographic, lifestyle and health history data.
Weight loss intervention
Cooper et al. originally developed the cognitive CBT programme for persons with obesity 28. The characteristics of their treatment programme are as follows: (i) because it was designed to encourage the acquisition and practice of weight maintenance skills, these differ from those required to lose weight; it consisted of a weight loss phase and a weight maintenance phase; (ii) in addition to the guidance on diet and physical activity, it adopted the training of stress management skills; (iii) it helped people accept and value more modest change in weight and acceptance in the latter part of the weight loss phase and prepared a programme to prevent regaining the weight that the patients lost in the weight maintenance phase. We modified it for use in a group therapy programme 29 that included the clinical guidelines on obesity of the US National Institutes of Health 30, Look Action for Health in Diabetes 31 and the Diabetes Prevention Program (DPP) as a framework 32. A sleep education programme was also added. Our treatment programme was conducted in small groups of approximately 10 participants. It consisted of 38 group sessions, each lasing 90 min, and five individual sessions over a 44‐week period. The sessions were conducted once a week for the first 34 consecutive sessions, with the remaining four sessions held once every two weeks.
Two doctors and two certified nutritionists were involved in the treatment as the healthcare providers. The participants were instructed to keep a daily food diary to track their consumption of all food and drinks and were advised to reduce their dietary intake by 500 calories per day from their caloric intake at the beginning of therapy. The nutritionists checked the nutritional balance of each participant's diet by examining the diary and advised the participants about the importance of eating vegetables and reducing the consumption of fat and sweets. On and after the seventh week, the participants were also instructed to wear a pedometer and to record their daily number of steps in an activity box on that day's recording sheet. They were advised to increase their level of physical exercise to a moderate intensity, such as walking 8,000–10,000 steps per day. In the sleep education session, we explained about the close relationship between sleep and obesity and introduced the CBT for insomnia 33. On and after seventh week, we asked them to keep their sleep duration in an activity box on the daily recording sheet. In the stress management sessions, we introduced problem‐solving techniques, cognitive reframing and assertion training 28.
Anthropometric and body composition measurements
Height and weight were measured at baseline by our staff. The participants weighed themselves once a week, on the morning of their session. The percent of body fat was measured at baseline and at the end of the weight loss phase using a dual energy X‐ray absorptiometry system (QDA4500A: HOLOGIC, Bedford MA).
Symptoms of depression and anxiety
Symptoms of depression and anxiety were assessed at baseline and at the end of the weight loss phase. Depressive symptoms were measured with the Japanese version of the Center for Epidemiologic Studies‐Depression Scale (CES‐D)34. The CES‐D is a 20‐item, self‐report questionnaire. The scores range from 0 to 60, with a higher score indicating the presence of depressive symptoms 35. Anxiety symptoms were measured with the Japanese version of the State‐Trait Anxiety Inventory (STAI). The STAI is a self‐report questionnaire consisting of two scales, the state and trait forms (STAI‐1 assesses state‐anxiety and STAI‐2 assesses trait‐anxiety). Each scale consists of 20 items that indicate the presence or absence of anxiety symptoms 36.
Sleep parameters
Actigraphy (Micro‐mini RC, Ambulatory Monitoring, Inc., Ardsley, NY, USA) was used to obtain objective sleep parameters. The participants were instructed to wear an actigraph, on the non‐dominant wrist, continuously over a period of 5–7 consecutive days and nights, both at baseline and at the end of weight loss phase. It was set for 1‐min epochs, in zero‐crossing mode. The data retrieved from the actigraphy were downloaded to a personal computer using the automatic actigraphy interface unit and were analysed and scored using Action W‐2 version 2.4.20 software (Ambulatory Monitoring, Inc., Ardsley, NY, USA) to calculate the sleep parameters. We used two parameters of the data obtained: sleep minutes (total minutes scored as sleep) and sleep efficiency (100 × sleep minutes/duration from the first 20‐min block of sleep to the last 20‐min block). All actigraphy‐based measurements were averaged over the total number of nights.
Sleep apnoea was evaluated with a subscale of the Japanese version of the Pittsburg Sleep Quality Index (PSQI) 37, a self‐reported questionnaire that assesses sleep quality and disturbances over the preceding month 38. Question 10b from the apnoea subscale was used for statistical analysis.
Measurement of adiponectin
Blood samples were taken from the antecubital vein in the morning (10:00–12:00 am), at baseline and at the end of the weight loss phase. The separated serum samples were stored at −80 °C until measurement. The serum adiponectin level was analysed by LA (BM‐9030, JEOL, Ltd., Japan; intraassay coefficient of variation 1.09% and interassay coefficient of variation 1.60%).
Statistical analysis
Changes in clinical data between the baseline and the end of the weight loss phase were evaluated with the paired t‐test. Simple regression was used to examine the association of the Δadiponectin level with other clinical variables. A direct method multiple regression analysis was used to clarify which variables were predictive of a change in the adiponectin level. Significant and near significant variables that were previously obtained by the univariate analysis (baseline body fat percent, baseline adiponectin level, ∆body fat percent, ∆sleep minutes and ∆CES‐D score), age and baseline sleep minutes were entered in the multiple regression model as independent variables with the ∆adiponectin level as a dependent variable. The Δ is calculated using the following equation: Δ = values at the end of the weight loss phase minus the baseline values. All of the continuous variables are expressed as the mean ± SD. All statistical analyses were performed with the JMP pro 9.0 software package (SAS Institute Inc., Cary, North Carolina, USA). A value of P < 0.05 was considered to be significant.
Results
Recruitment and baseline characteristics
A total of 230 people were screened, and 119 were enrolled in the weight loss programme (Figure 1), with 90 (75.6%) completing the weight loss phase. Their baseline characteristics are presented in Table 1. The mean age and BMI were 47.9 (25 to 65) years and 31.1 (25.1 to 46.0) kg m−2 respectively.
Figure 1.
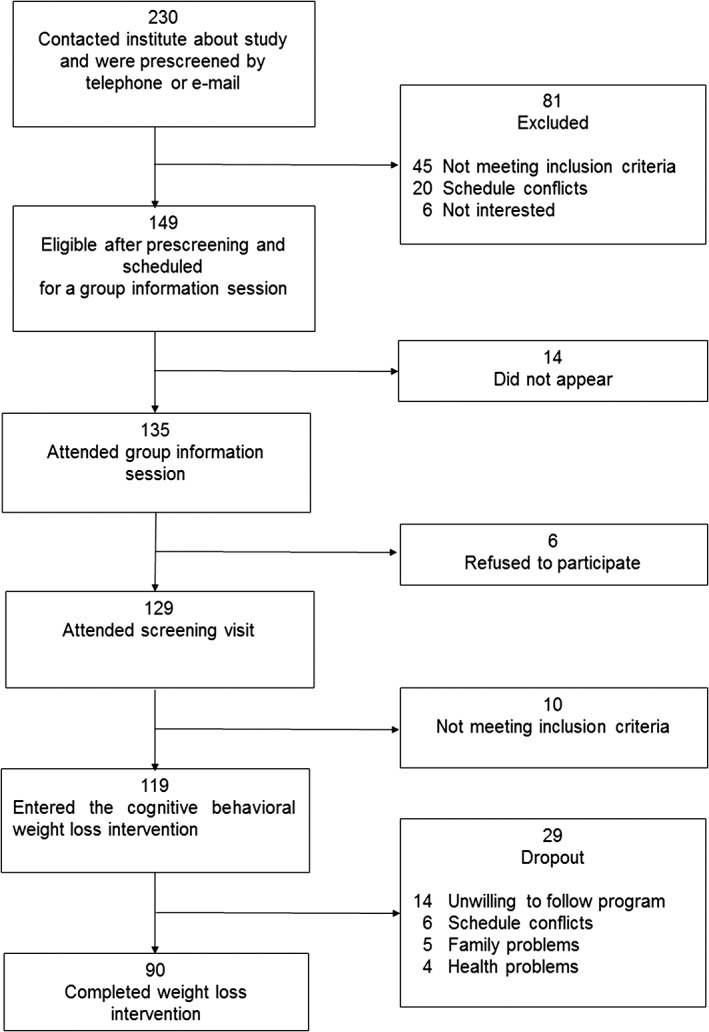
Flow diagram of the study regimen.
Table 1.
Demographic and clinical data
| Characteristic | At baseline | At the end of weight loss phase | P valuea |
|---|---|---|---|
| Sociodemographics | |||
| Age | 47.9 ± 12 | ||
| Smoking status – smoker, n (%) | 13 (14.4%) | ||
| Clinical | |||
| BMI (kg m−2) | 31.1 ± 4.7 | 26.9 ± 4.6 | <0.001 |
| Body weight (kg) | 77.6 ± 12 | 66.1 ± 12 | <0.001 |
| Waist (cm) | 98.6 ± 11 | 86.9 ± 12 | <0.001 |
| Hip (cm) | 107.2 ± 9.9 | 97.1 ± 9.7 | <0.001 |
| Body fat (%) | 37.6 ± 3.8 | 32.9 ± 5.1 | <0.001 |
| Sleep‐related parameters | |||
| Sleep minutes (min)a | 331.7 ± 66.9 | 345.2 ± 68.7 | 0.07 |
| Sleep efficiency (%)a | 92.9 ± 5.1 | 94.3 ± 4.9 | 0.009 |
| PSQI apnoea subscale | 0.3 ± 0.9 | 0.2 ± 0.6 | 0.005 |
| Psychological | |||
| Depression (CES‐D) | 11.4 ± 6.8 | 13.2 ± 10.1 | 0.057 |
| Anxiety (STAI‐state) | 41.1 ± 9.3 | 42.2 ± 10.7 | 0.33 |
| Anxiety (STAI‐trait) | 44.1 ± 11.9 | 45 ± 11.3 | 0.42 |
| Adiponecin (µg mL−1) | 9.8 ± 6.0 | 11.2 ± 6.1 | <0.0001 |
Evaluated with the paired t‐test.
Values are expressed as the means ± SD or n (%) of 90 participants. BMI: body mass index. PSQI: Pittsburg Sleep Quality Index. CES‐D: Center for Epidemiologic Studies‐Depression Scale. STAI: State‐Trait Anxiety Inventory.
Kinetics of body weight
Changes in the clinical data between baseline and the end of the weight loss phase are presented in Table 1. The mean values for weight loss and reduction of body fat were 10.3 ± 4.8 kg and 4.8 ± 3.2% respectively. All participants who completed the weight loss phase lost more than 5% of their initial body weight, with 65 (72%) losing 10% or more.
Relation between change in the adiponectin level and other clinical variables
As shown in Table 1, the adiponectin level and sleep efficiency were significantly increased and the PSQI apnoea subscale significantly decreased at the end of the weight loss phase. The sleep minutes did not significantly change, although there was a tendency towards an increase after the weight loss intervention. Simple regression analysis (Table 2) demonstrated that the ∆adiponectin level was significantly associated with both the adiponectin level and percent body fat at baseline, the ∆body fat (%)and ∆CES‐D and that there was a weak association with ∆sleep minutes. In the multiple regression analysis, ∆adiponectin was significantly associated with ∆sleep minutes (β = 0.210, P = 0.043) and ∆body fat (%) (β = −0.317, P < 0.001) after adjustment for age, baseline body fat (%), baseline adiponectin level, baseline sleep minutes and ∆CES‐D
Table 2.
Simple and multiple regression analysis of the ∆adiponectin level and clinical variables
| Simple regression | Multiple regressiona | |||
|---|---|---|---|---|
| Independent variables | β | P | β | P |
| Age | 0.13 | ns | 0.190 | 0.045 |
| Smoking status | 0.027 | ns | ni | ni |
| Baseline body fat (%) | −0.392 | <0.001 | −0.308 | 0.0014 |
| Baseline adiponectin level | −0.250 | 0.019 | −0.203 | 0.033 |
| Sleep minutes | 0.069 | ns | 0.881 | ns |
| ∆Body fat (%) | −0.310 | 0.004 | −0.317 | <0.001 |
| ∆Sleep minutes | 0.180 | 0.086 | 0.210 | 0.043 |
| ∆Sleep efficiency | 0.169 | ns | ni | ni |
| ∆PSQI apnoea subscale | −0.043 | ns | ni | ni |
| ∆CES‐D | −0.284 | 0.007 | −0.125 | ns |
| ∆STAI‐state | −0.066 | ns | ni | ni |
| ∆STAI‐ trait | −0.106 | ns | ni | ni |
β: standard regression coefficients. ns: not significant. ni: not inserted.
∆ = values at the end of weight loss phase minus values at baseline.
Age, baseline body fat (%), baseline sleep minutes, baseline adiponectin level, ∆body fat(%), ∆sleep minutes and ∆CES‐D were entered as independent variables in a direct multiple regression model with the ∆adiponectin level as the dependent variable. Adjusted R 2 = 0.308, F = 7.15, P < 0.0001
BMI: body mass index. PSQI: Pittsburg Sleep Quality Index. CES‐D: Center for Epidemiologic Studies‐ Depression Scale. STAI: State‐ Trait Anxiety Inventory.
Discussion
In the current study, the serum level of adiponectin was significantly increased after 7 months of weight loss intervention. As we hypothesized, the increase in the adiponectin level was associated with the magnitude of body fat loss and an increase of sleep minutes.
The effects of long‐term weight loss intervention on the adiponectin level have not yet to be clearly established. Summer et al. reported that the adiponectin level increased with a low‐carbohydrate, but not a low‐fat, diet with no correlation between weight loss and the increase in adiponectin concentration 18. Abbenhardt et al. evaluated the change in adiponectin level in a randomized controlled study that compared the effect of a 12‐month weight loss intervention with diet, exercise or diet plus exercise 17. The results showed that the adiponectin concentration increased in both the diet and diet plus exercise groups, but not in the exercise only group. They also showed that the degree of weight loss was inversely associated with the concentration of adiponectin. The results of our study were similar to those of the DPP 39, which included a lifestyle group that prescribed a reduced calorie weight‐loss programme and increased physical activity, that showed an increase in adiponectin after one year in their lifestyle (diet plus exercise) group. Our diet intervention was partly based on the DPP lifestyle intervention. Overall, our data and the data from other studies suggest that weight loss and/or reduction in body fat might be triggers for an increase in adiponectin concentration. The mechanisms involved in this paradoxical increase of the serum adiponectin level in spite of a decrease of the body fat volume during a weight loss programme remain unclear. However, William et al. recently demonstrated that bone marrow adipose tissue, not white adipose tissue, increases during caloric restriction 40. They identified marrow adipose tissue as an endocrine organ that contributes significantly to increased serum adiponectin during caloric restriction.
Furthermore, one of the most important findings of the present study was that an increase in sleep minutes was significantly associated with an increase in the adiponectin level, even after adjustment for changes in the percentage of body fat. There are some points to be considered in interpreting these results because the objective sleep duration of our participants at baseline was 330 min, which was quite short, and increased by only 14 min at study end. Recent studies reported that both the objective and subjective sleep durations of Japanese women are the shortest among the Organization for Economic Co‐operation and Development countries 41, 42. Also, previous studies that revealed a close relation between obesity and short sleep duration 24, 43. Therefore, it is understandable that the objective sleep duration of our participants with obesity before and after treatment was much shorter than the Japanese norm. Moreover, even though the increase in sleep minutes after weight loss is small, it might be responsible for the increase in the adiponectin level of patients with obesity who have short sleep duration.
Conflicting results have been published about the relation between sleep duration and the adiponectin level. The Wisconsin Sleep Cohort Study, a population‐based study of sleep disorders, demonstrated no association between the serum adiponectin level and sleep minutes assessed by nighttime polysomnography and a sleep diary 44. In contrast, Simpson et al. showed that sleep restriction (five nights of sleep restricted to 4 h per night) resulted in a decrease in the plasma adiponectin level of Caucasian women 22. Our findings support their results that an increase in sleep minutes through weight loss intervention is associated with an increase in the adiponectin level. In contrast, Robertson et al. reported that 3 weeks of mild sleep restriction (habitual bedtime minus 1.5 h) had no effect on the plasma adiponectin level of young normal‐weight men 45. No consistent conclusions have been reported about the relation between sleep minutes and the adiponectin level. Further study will be necessary to clarify the relation and mechanisms related to the association.
Both sleep quantity and sleep quality are often poor among patients with obesity. OSA is a sleep related breathing disorder that aggravates sleep quality. It is characterized by recurrent episodes of obstruction of the upper airway, which leads to sleep fragmentation and symptoms of excessive daytime sleepiness. Although we did not evaluate OSA objectively and the ∆PSQI apnoea subscale was not associated with the ∆adiponectin level in the present study, OSA has been associated with the adiponectin level in previous studies. Mutairi et al. demonstrated that adiponectin decreased significantly with increasing severity of OSA among 147 patients with suspected OSA and concluded that adiponectin is an independent marker of disease severity 23. Yoshikawa et al. reported that the plasma adiponectin level was inversely correlated with the apnoea hypopnea index and %time in SpO2 < 90%, but not with the BMI of 22 patients with OSA 11. They also revealed that the plasma adiponectin level was increased after long‐term nCPAP treatment (3 months) of 10 patients. Furthermore, recent studies have demonstrated that mRNA degradation of adiponectin is accelerated under hypoxia compared with normoxia 12, 46. The studies mentioned previously suggest that hypoxic stress caused by sleep apnoea leads to adipocyte dysfunction and a decrease in the secretion of adiponectin among patients with OSA. The improvement of OSA because of weight loss might mediate the association with a change of sleep minutes and adiponectin. However, in the present study we did not find an association between change in the PSQI apnoea score and change of the adiponectin level. In addition, we did not find any association between change in adiponectin and change in sleep efficiency, which has been reported to be worsened in patients with OSA. This may be partly explained by the fact that sleep efficiency was relatively high from the beginning of the present study; therefore, the magnitude of the increase in sleep efficiency was small, although the change was significant. This might have affected the result that the change in sleep efficiency was not associated with the change in adiponectin level.
Our CBT‐based weight loss programme included a session about sleep education, with the participants receiving information about the relation between sleep and obesity. Our results showed that improving sleep duration may be rather important for increasing the adiponectin level. Considering the fact that the sleep minutes of our participants were much shorter than the national norm, even after the intervention, more intensive intervention for increasing sleep duration may be needed. In addition, it may be helpful to evaluate the possibility of OSA before weight loss intervention and, if necessary, to do nCPAP therapy to reduce the risk of obesity‐related diseases.
A strength of our study is that the magnitude of weight loss and body fat reduction was relatively large, which provided a strong test of the relation between the changes in adiponectin and sleep minutes. However, it should be noted that the present study has several limitations. First, our sample size is relatively small and we cannot apply our results to men with obesity or people of other races/ethnicities because all of the participants were Japanese women. Second, we cannot exclude the possibility that variables other than those we examined, such as OSA, may have affected our results. Finally, the dropout rate was relatively high, which may have contributed to selection bias.
In summary, an increase in sleep minutes was associated with an increase in the serum adiponectin level, even after adjustment for confounding factors. It will be important to develop strategies to improve the sleep duration of people participating in weight loss intervention, which reduces the risk of obesity‐related diseases.
Conflict of Interest Statement
The authors declare no conflict of interest.
Funding
This study was supported by a Research Grant (23‐3) for Nervous and Mental Disorders from the Ministry of Health, Labour and Welfare of Japan and a Grant‐in‐Aid for Scientific Research (25460902) from the Japan Society for the Promotion of Science.
Acknowledgement
The authors thank Junko Sakaguchi and Akemi Kugimaru, national registered nutritionists, for nutritional guidance. We also thank Junji Kishimoto, PhD, for his contribution to the statistical analysis and Ayako Tomihisa and Miyuki Ito for their assistance with the collection and recording of the data in the registers.
Sawamoto, R. , Nozaki, T. , Furukawa, T. , Tanahashi, T. , Morita, C. , Hata, T. , Nakashima, M. , Komaki, G. , and Sudo, N. (2016) A change in objective sleep duration is associated with a change in the serum adiponectin level of women with overweight or obesity undergoing weight loss intervention. Obesity Science & Practice, 2: 180–188. doi: 10.1002/osp4.32.
References
- 1. Poirier P, Eckel RH. Obesity and cardiovascular disease. Curr Atheroscler Rep 2002; 4: 448–453. [DOI] [PubMed] [Google Scholar]
- 2. Renehan AG, Tyson M, Egger M, et al. Body‐mass index and incidence of cancer: a systematic review and meta‐analysis of prospective observational studies. Lancet 2008; 371: 569–578. [DOI] [PubMed] [Google Scholar]
- 3. Van Gaal LF, Mertens IL, De Block CE. Mechanisms linking obesity with cardiovascular disease. Nature 2006; 444: 875–880. [DOI] [PubMed] [Google Scholar]
- 4. Havel PJ. Control of energy homeostasis and insulin action by adipocyte hormones: leptin, acylation stimulating protein, and adiponectin. Curr Opin Lipidol 2002; 13: 51–59. [DOI] [PubMed] [Google Scholar]
- 5. Maeda N, Shimomura I, Kishida K, et al. Diet‐induced insulin resistance in mice lacking adiponectin/ACRP30. Nat Med 2002; 8: 731–737. [DOI] [PubMed] [Google Scholar]
- 6. Silha JV, Krsek M, Skrha JV, et al. Plasma resistin, adiponectin and leptin levels in lean and obese subjects: correlations with insulin resistance. Eur J Endocrinol 2003; 149: 331–335. [DOI] [PubMed] [Google Scholar]
- 7. Sheng T, Yang K. Adiponectin and its association with insulin resistance and type 2 diabetes. J Genet Genomics 2008; 35: 321–326. [DOI] [PubMed] [Google Scholar]
- 8. Okamoto Y, Kihara S, Funahashi T, et al. Adiponectin: a key adipocytokine in metabolic syndrome. Clin Sci (Lond) 2006; 110: 267–278. [DOI] [PubMed] [Google Scholar]
- 9. Ryo M, Nakamura T, Kihara S, et al. Adiponectin as a biomarker of the metabolic syndrome. Circ J 2004; 68: 975–981. [DOI] [PubMed] [Google Scholar]
- 10. Swarbrick MM, Havel PJ. Physiological, pharmacological, and nutritional regulation of circulating adiponectin concentrations in humans. Metab Syndr Relat Disord 2008; 6: 87–102. [DOI] [PMC free article] [PubMed] [Google Scholar]
- 11. Yoshikawa M, Yamauchi M, Fujita Y, et al. The impact of obstructive sleep apnea and nasal CPAP on circulating adiponectin levels. Lung 2014; 192: 289–295. [DOI] [PubMed] [Google Scholar]
- 12. Nakagawa Y, Kishida K, Kihara S, et al. Nocturnal reduction in circulating adiponectin concentrations related to hypoxic stress in severe obstructive sleep apnea‐hypopnea syndrome. Am J Physiol Endocrinol Metab 2008; 294: E778‐E784. [DOI] [PubMed] [Google Scholar]
- 13. Kelesidis I, Kelesidis T, Mantzoros CS. Adiponectin and cancer: a systematic review. Br J Cancer 2006; 94: 1221–1225. [DOI] [PMC free article] [PubMed] [Google Scholar]
- 14. Diniz BS, Teixeira AL, Campos AC, et al. Reduced serum levels of adiponectin in elderly patients with major depression. J Psychiatr Res 2012; 46: 1081–1085. [DOI] [PubMed] [Google Scholar]
- 15. Liu J, Guo M, Zhang D, et al. Adiponectin is critical in determining susceptibility to depressive behaviors and has antidepressant‐like activity. Proc Natl Acad Sci U S A 2012; 109: 12248–12253. [DOI] [PMC free article] [PubMed] [Google Scholar]
- 16. Vendrell J, Broch M, Vilarrasa N, et al. Resistin, adiponectin, ghrelin, leptin, and proinflammatory cytokines: relationships in obesity. Obes Res 2004; 12: 962–971. [DOI] [PubMed] [Google Scholar]
- 17. Abbenhardt C, McTiernan A, Alfano CM, et al. Effects of individual and combined dietary weight loss and exercise interventions in postmenopausal women on adiponectin and leptin levels. J Intern Med 2013; 274: 163–175. [DOI] [PMC free article] [PubMed] [Google Scholar]
- 18. Summer SS, Brehm BJ, Benoit SC, et al. Adiponectin changes in relation to the macronutrient composition of a weight‐loss diet. Obesity (Silver Spring) 12011; 19: 2198–2204. [DOI] [PubMed] [Google Scholar]
- 19. Ryan AS, Nicklas BJ, Berman DM, et al. Adiponectin levels do not change with moderate dietary induced weight loss and exercise in obese postmenopausal women. Int J Obes Relat Metab Disord 2003; 27: 1066–1071. [DOI] [PubMed] [Google Scholar]
- 20. Silva FM, de Almeida JC, Feoli AM. Effect of diet on adiponectin levels in blood. Nutr Rev 2011; 69: 599–612. [DOI] [PubMed] [Google Scholar]
- 21. Christiansen T, Paulsen SK, Bruun JM, et al. Diet‐induced weight loss and exercise alone and in combination enhance the expression of adiponectin receptors in adipose tissue and skeletal muscle, but only diet‐induced weight loss enhanced circulating adiponectin. J Clin Endocrinol Metab 2010; 95: 911–919. [DOI] [PubMed] [Google Scholar]
- 22. Simpson NS, Banks S, Arroyo S, et al. Effects of sleep restriction on adiponectin levels in healthy men and women. Physiol Behav 2010; 101: 693–698. [DOI] [PMC free article] [PubMed] [Google Scholar]
- 23. Al Mutairi S, Mojiminiyi OA, Al Alawi A, et al. Study of leptin and adiponectin as disease markers in subjects with obstructive sleep apnea. Dis Markers 2014; 2014: 706314. [DOI] [PMC free article] [PubMed] [Google Scholar]
- 24. Cappuccio FP, Taggart FM, Kandala NB, et al. Meta‐analysis of short sleep duration and obesity in children and adults. Sleep 2008; 31: 619–626. [DOI] [PMC free article] [PubMed] [Google Scholar]
- 25. Lauderdale DS, Knutson KL, Rathouz PJ, et al. Cross‐sectional and longitudinal associations between objectively measured sleep duration and body mass index: the CARDIA Sleep Study. Am J Epidemiol 2009; 170: 805–813. [DOI] [PMC free article] [PubMed] [Google Scholar]
- 26. van den Berg JF, Knvistingh Neven A, Tulen JH, et al. Actigraphic sleep duration and fragmentation are related to obesity in the elderly: the Rotterdam Study. Int J Obes (Lond) 2008; 32: 1083–1090. [DOI] [PubMed] [Google Scholar]
- 27. Sawamoto R, Nozaki T, Furukawa T, et al. Higher sleep fragmentation predicts a lower magnitude of weight loss in overweight and obese women participating in a weight‐loss intervention. Nutr Diabetes 2014; 4: e144. [DOI] [PMC free article] [PubMed] [Google Scholar]
- 28. Cooper Z, Fairburn C, Hawker D. Cognitive–behavioral treatment of obesity; a clinician's Guide 2003. Guilford Press: New York, NY, 2003. [Google Scholar]
- 29. Nozaki T, Sawamoto R, Furuwaka T, et al. Group based cognitive behavioral therapy for obesity. Jap J Psychosom Intern Med 2013; 17:220–225 (in Japanese). [PubMed] [Google Scholar]
- 30. Anonymous clinical guidelines on the identification, evaluation, and treatment of overweight and obesity in adults‐‐the evidence report. National Institutes of Health. Obes Res 1998; 6 Suppl 2: 51S‐209S. [PubMed] [Google Scholar]
- 31. Look AHEAD Research Group and Wing RR . Long‐term effects of a lifestyle intervention on weight and cardiovascular risk factors in individuals with type 2 diabetes mellitus: four‐year results of the Look AHEAD trial. Arch Intern Med 2010; 170: 1566–1575. [DOI] [PMC free article] [PubMed] [Google Scholar]
- 32. Diabetes Prevention Program (DPP) Research Group . The Diabetes Prevention Program (DPP): description of lifestyle intervention. Diabetes Care 2002; 25: 2165–2171. [DOI] [PMC free article] [PubMed] [Google Scholar]
- 33. Morgenthaler T, Kramer M, Alessi C, et al. Practice parameters for the psychological and behavioral treatment of insomnia: an update. An American Academy of Sleep Medicine Report. Sleep 2006; 29: 1415–1419. [PubMed] [Google Scholar]
- 34. Shima S, Shikano T, Kitamura T, et al. New self‐rated scale for depression. Jap J Clin Psychiat 1985; 27: 717–723 (in Japanese). [Google Scholar]
- 35. Radloff L. The CES‐D Scale: a self‐report depression scale for research in the general population. Applied Psychological Measurement 1997; 1: 385–401. [Google Scholar]
- 36. Spielberger CR, Gorsuch RL, Lushene R, et al. Manual for the state‐trait anxiety inventory (STAI). Consulting Psychologists Press: Palo Alto, CA, 1983. [Google Scholar]
- 37. Doi Y, Minowa M, Uchiyama M, et al. Development of the Japanese version of the Pittsburgh Sleep Quality Index. Jap J Psychiatry Treat 1998; 13: 755–763. [Google Scholar]
- 38. Buysse DJ, Reynolds CF III, Monk TH, et al. The Pittsburgh Sleep Quality Index: a new instrument for psychiatric practice and research. Psychiatry Res 1989; 28: 193–213. [DOI] [PubMed] [Google Scholar]
- 39. Mather KJ, Funahashi T, Matsuzawa Y, et al. Adiponectin, change in adiponectin, and progression to diabetes in the Diabetes Prevention Program. Diabetes 2008; 57: 980–986. [DOI] [PMC free article] [PubMed] [Google Scholar]
- 40. Cawthorn WP, Scheller EL, Learman BS, et al. Bone marrow adipose tissue is an endocrine organ that contributes to increased circulating adiponectin during caloric restriction. Cell Metab 2014; 20: 368–375. [DOI] [PMC free article] [PubMed] [Google Scholar]
- 41. Sato M, Yasuhara Y, Tanioka T, et al. Measuring quality of sleep and autonomic nervous function in healthy Japanese women. Neuropsychiatr Dis Treat 2014; 10: 89–96. [DOI] [PMC free article] [PubMed] [Google Scholar]
- 42. The 2011 Survey on time and leisure activities. Ministry of Internal Affairs and communications, Japan. URL http://www.stat.go.jp/data/shakai/2011/h23kekka.htm (accessed 3 December 2015).
- 43. Zimberg IZ, Damaso A, Del Re M, et al. Short sleep duration and obesity: mechanisms and future perspectives. Cell Biochem Funct 2012; 30: 524–529. [DOI] [PubMed] [Google Scholar]
- 44. Taheri S, Lin L, Austin D, et al. Short sleep duration is associated with reduced leptin, elevated ghrelin, and increased body mass index. PLoS Med 2004; 1: e62. [DOI] [PMC free article] [PubMed] [Google Scholar]
- 45. Robertson MD, Russell‐Jones D, Umpleby AM, et al. Effects of three weeks of mild sleep restriction implemented in the home environment on multiple metabolic and endocrine markers in healthy young men. Metabolism 2013; 62: 204–211. [DOI] [PubMed] [Google Scholar]
- 46. Hosogai N, Fukuhara A, Oshima K, et al. Adipose tissue hypoxia in obesity and its impact on adipocytokine dysregulation. Diabetes 2007; 56: 901–911. [DOI] [PubMed] [Google Scholar]