Abstract
The processes of analysing qualitative data, particularly the stage between coding and publication, are often vague and/or poorly explained within addiction science and research more broadly. A simple but rigorous and transparent technique for analysing qualitative textual data, developed within the field of addiction, is described. The technique, iterative categorization (IC), is suitable for use with inductive and deductive codes and can support a range of common analytical approaches, e.g. thematic analysis, Framework, constant comparison, analytical induction, content analysis, conversational analysis, discourse analysis, interpretative phenomenological analysis and narrative analysis. Once the data have been coded, the only software required is a standard word processing package. Worked examples are provided.
Keywords: Coding, inductive analysis, iterative categorization, qualitative data analysis, qualitative research, research methods
Introduction
The field of addiction has consistently provided qualitative researchers with a lucrative arena in which to apply and develop their methods 1. Despite this, addiction science is dominated by biomedical and psychological approaches 2, with qualitative research accounting for a minority of addiction journal output (7% of papers published in top‐ranked journals in 2009) 3. In addition, the proportion of qualitative research published in any given addiction journal seems to be inversely proportional to that journal's Impact Factor (i.e. fewer papers in higher‐ranked journals) 3. Such findings suggest a problem with qualitative addiction publishing that has been linked to both the epistemology of qualitative methods (specifically, the lack of credibility afforded to interpretative approaches to knowledge) and addiction journal practices (inflexible policies on article structure and length and the use of reviewers without appropriate qualitative expertise) 3, 4.
This paper describes a simple but rigorous and transparent technique for analysing qualitative textual data in order to achieve three aims: (i) to offer practical assistance to addiction researchers struggling to analyse their own qualitative data; (ii) to provide insights into qualitative data analysis that may increase its legitimacy within addiction science; and (iii) to assist those tasked with reviewing or making editorial decisions on qualitative journal submissions. While the paper is written primarily for those who are new to qualitative addiction research or who are mystified, sceptical or confused by the processes of qualitative data analysis, there is likely to be interest from qualitative researchers more generally. The technique, Iterative Categorization (IC), has not been published previously sui generis. None the less, it has been used to train new addiction researchers and to write many qualitative addiction papers, including two published in Addiction 5, 6.
IC is not a stand‐alone method of analysing qualitative data; it is rather a systematic technique for managing analysis that is compatible with, and can support, existing common analytical approaches, e.g. thematic analysis, Framework, constant comparison, analytical induction, content analysis, conversational analysis, discourse analysis, interpretative phenomenological analysis and narrative analysis. It achieves this by enabling researchers to code and analyse their data by topic, event, story, verbal interaction, signifier, feeling, idea, category, theme, concept or theory, etc. IC can be used with textual data that have been coded deductively (based on the researcher's pre‐existing hunches or theories about issues likely to be important within the data) and inductively (based on issues emerging as important from the data themselves). The value of IC is that it offers researchers a set of standardized procedures to guide them through analysis to publication, leaving a clear audit trail. The audit trail demonstrates how they have arrived at their findings, and provides a route back to the raw data for further clarifications, elaborations and confirming/disconfirming evidence.
Why is qualitative data analysis often poorly explained?
Textbooks and methodological papers describing qualitative methods report that qualitative data analysis is a ‘highly personal activity’, involving ‘creativity’ and ‘inspiration’ 7, 8, 9. The analytical approach used within any study will relate to the research aim(s), nature and amount of data collected, time and resources available, and analytical skills, epistemological position and interests of the researcher 4, 8, 10. There are no firm rules about the volume of data needed for meaningful interpretation 9. Furthermore, there is no rigid separation between data collection and analysis, as early hunches and preliminary interpretations can be used to inform, adapt or revise later data‐gathering 11. In short, qualitative data analysis is less standardized than statistical analysis 9.
Recently, published qualitative studies have begun to include longer Methods sections. Despite this, the additional explanation provided focuses commonly upon how the data were coded and ‘managed’, not on the intellectual processes involved in ‘generating findings’ 8. In fact, published accounts of qualitative data analysis are often limited to explaining that categories, themes and concepts were generated through iterative coding, with team members discussing and/or independently verifying the findings. Sometimes, relatively esoteric approaches to the analysis of a particular data set are described more fully, although these are not necessarily replicable in other studies. Increased transparency is to be welcomed and has probably been prompted by the emergence of checklists and guidelines for writing up qualitative research [e.g. Critical Appraisal Skills Programme (CASP) 12, Consolidated Criteria for Reporting Qualitative Research (COREQ) 13, Relevance, Appropriateness and Transparency (RATS) 14]. None the less, the information provided in most published reports is still insufficient to guide novice qualitative researchers in undertaking their own analyses or to allay the fears of sceptical reviewers and readers who believe that qualitative findings are overly reliant upon intuition 9.
What is already known about qualitative data analysis
While qualitative data analysis is characterized by creativity and inspiration, it still needs to be systematic and rigorous 15. Qualitative data (in the form of interview or focus group transcriptions, documentary materials, and fieldnotes) tend to be unstructured, so the researcher must begin by imposing some order on them 16. To this end, any audio recordings should be transcribed, ideally verbatim and to a level of detail required by the particular project and method. For example, ‘naturalized transcription’ might be used to capture every utterance (including time gaps, drawn out syllables or emphasis) in discourse or conversation analysis while ‘denaturalized transcription’ (which focuses on informational content) might be preferable for thematic analysis, content analysis or Framework 17.
All transcriptions and other textual material should next be read and re‐read to ensure familiarization with their content. An accepted analytical method (thematic analysis, Framework, constant comparison, analytical induction, content analysis, conversational analysis, discourse analysis, interpretative phenomenological analysis and narrative analysis, etc.) can then be deployed. Although there are differences between, and often within, these methods in terms of their purpose and even their philosophical, ontological and epistemological orientations, they tend to be underpinned by several common processes. These include: coding; identifying important phrases, patterns, and themes; isolating emergent patterns, commonalities and differences; explaining consistencies; and relating any consistencies to a formalized body of knowledge 18.
As indicated above, coding (also known as indexing) is the most clearly (and easily) explained of these core processes and is undertaken increasingly using software such as NVivo 19, MAXqda 20 or Atlas.ti. 21. There are also basic coding programs that can be downloaded freely from the internet, such as QDA Miner Lite 22, CAT 23 or Aquad 24. Coding involves reviewing all data line‐by‐line, identifying key issues or themes (codes) and then attaching segments of text (either original text or summarized notes) to those codes. New codes are added as additional themes or issues emerge in the data, often creating a hierarchical ‘tree’ of codes. Some authors recommend coding initially into multiple exploratory ‘open’ codes, then collapsing these into fewer more focused codes, and then merging the more focused codes into a small number of broader conceptual codes 25, 26. Others suggest beginning with broader descriptive codes and then breaking these down into smaller coding units to make comparisons across the data 27.
While coding involves a degree of conceptual thinking, the main analytical work occurs after coding and is executed less transparently using software. Indeed, it is at this more analytical stage that the novice may become confused or the sceptic impatient. How, exactly, does one identify patterns, commonalities and differences in the coded data systematically and then begin to explain these? According to Miles & Huberman, analysis is underpinned by three concurrent activities: (i) data reduction (simplifying, abstracting and transforming raw data); (ii) data display (organizing the information by assembling it into matrices, graphs, networks or charts); and (iii) conclusion drawing/verification (interpreting the data and testing provisional conclusions for their plausibility) 18. Ritchie & Lewis not dissimilarly refer to (i) ‘charting’ (creating charts by, for example, using code labels as column headings and case/participant identifiers as row headings so that participants’ responses to every code can be summarized in matrix form) and (ii) ‘mapping and interpreting the data’ (looking for patterns, associations, concepts and explanations within the matrix) 8.
In practice, it can be helpful to simplify qualitative data analysis into just two core stages: (i) description and (ii) interpretation. Qualitative data first need to be described (the quasi‐equivalent of running frequencies on quantitative data). This is because the researcher requires a basic understanding of the nature and range of topics and themes within the data before they can begin to interpret them—that is, look for patterns, categories or explanations and relate them to a broader body of knowledge (the quasi‐equivalent of inferential statistics). Simplifying (or ‘reducing’) the raw data and then displaying them in matrices or charts (not dissimilar to a spread sheet) facilitates both description and interpretation by allowing the researcher to be systematic and comprehensive in comparing the data both across and within codes. This effectively permits them to explore similarities and differences between topics and themes and between cases/participants. Findings can then be related to published literature, theory, policies and practices.
Iterative categorization
IC has its origins in a study of non‐fatal overdose conducted by the current author in 1997–99 28, 29, 30, 31. This involved 200 qualitative interviews transcribed verbatim (‘denaturalized transcription’) by professional transcribers plus observational data. Findings needed to be disseminated in a range of formats to different audiences, including policymakers, addiction service providers, police and opiate users. Data were being analysed using the Framework method and, to this end, the author was trialling a then relatively new qualitative software program (WinmaxPro, now MAXQDA). This program became an invaluable tool for organizing and sorting the data by both deductive and inductive codes, but offered little assistance with the main analytical work. After reflection, the author determined that the best strategy was to export the data for each code into its own Microsoft Word document and then review this line‐by‐line, summarizing and organizing the findings iteratively under emergent headings and subheadings.
Because each file of coded data was lengthy (including verbatim data extracts from up to 200 participants), the screen was split within Word so that the headings and subheadings at the top of the page and the raw coded data at the bottom of the page could be managed. As participants comprised distinct subgroups (those who had/had not overdosed, males/females, methadone patients/non‐methadone patients, etc.), the summarized data were labelled under the new headings and subheadings so that it was easy to see who had made which comments. Because the author had conducted the interviews personally, listened to the interviews, coded the data and now summarized the findings, she felt confident in her ability to link the ‘decontextualized’ short summaries under each heading back to the original interviews and observations.
Over the years, the author has modified and adapted this technique in response to the demands of different addiction‐related qualitative studies, with different aims and objectives, using different study designs and analytical approaches, and working alongside researchers from different disciplines and with different levels of qualitative research experience. In consequence, IC has its roots in pragmatism and other researchers are duly encouraged to select, adapt or develop aspects of the process according to what works best to improve understanding within any given study 32, 33. IC, however, assumes that: (i) the study for which the data are being analysed has clear aims and objectives (or an appropriate research question) and (ii) any interview or observation guides used for data generation were informed by both those aims/objectives and the relevant literature.
Recommended approach to coding
To facilitate clear progression from the study aims/objectives to the study conclusions, it is best if coding begins with deductive codes derived from any structured or semi‐structured instruments used for data generation. This is because analysis and write‐up of these deductive codes should feed back into the original study aim or question. Specifically, if one has taken the time to ask about a particular issue since it seemed important to the study aim, it is illogical to disregard that issue when coding the data prior to analysis. Deductive codes can then be supplemented by more inductive (‘in vivo’) codes derived more creatively from emergent topics in the data. Analysis of the inductive codes can be particularly valuable in complementing, expanding, qualifying or even contradicting the initial hypotheses or assumptions of the researcher.
In terms of whether it is preferable to move from focused codes to broad codes or from broad codes to more focused codes, IC favours a relatively uncomplicated coding process based on fairly substantive codes grouped under general headings. As above, these codes should resemble closely the topics and prompts used in any data collection instrument (and it can even be helpful to number the codes so that they are consistent with the data collection instrument) (Fig. 1 shows a very simple coding frame used in a study exploring the barriers injectors face when accessing treatment 34, 35). While this may seem prescriptive or basic, there are dangers in having an elaborate, unstructured coding tree, particularly if this involves a large number of very small codes. Most obviously, researchers can become confused and start to code inconsistently, so potentially undermining the integrity of their later analyses.
Figure 1.
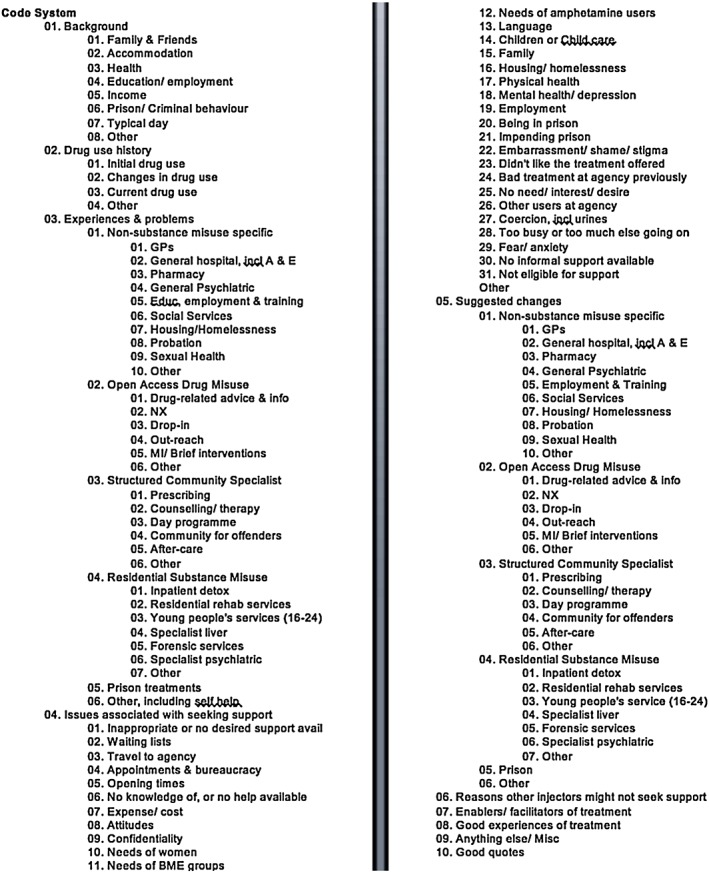
Basic coding frame
The researcher using IC is encouraged to think of coding primarily as a means of systematically ordering and sorting their data. As part of this process, each document to be coded needs a meaningful identifier. For example, a study involving interviews with people from three geographical locations: C, L and K might have files labelled C1; C2; C3; L1; L2: L3; K1; K2; K3, etc. where ‘1’, ‘2’, ‘3’, etc. denote the participant number. If gender seems likely to be of analytical relevance, the file identifiers might also include ‘f’ denoting ‘female’ and ‘m’ denoting ‘male’. If each participant was interviewed twice, identifiers might be extended further to include ‘a’ for first interview and ‘b’ for the second interview (e.g. C1fa, C1fb). Essentially, a creative but clear labelling system should be developed for each study. The researcher should next code the data comprehensively (i.e. so that no original data remain uncoded), coding segments of text to multiple codes as appropriate (i.e. if a single statement contains information relevant to more than one code, then it should be coded to all relevant codes). Unless there are only limited data, this is accomplished most easily using specialist qualitative software.
Preparing for analysis
A number of qualitative computer packages now have inbuilt features for creating matrices (or grids/charts) that facilitate both data reduction and data display. These matrices permit data to be summarized and then reviewed both across and within cases. It is also possible to create document ‘attributes’ so that data relating to participants with particular characteristics can be isolated and examined separately. Although helpful, the researcher still needs to scroll up and down or across the matrix (or export or print off the matrix or aspects of the matrix) in order to appreciate and then interpret what is going on within the whole dataset. Furthermore, the process of moving from the matrix to writing up the findings cannot be executed or explained by using the available specialist software alone. IC bridges this gap, demystifying the ‘black box’ of analysis without requiring the matrix function.
In IC, raw (unsummarized) data from the coding stage are exported from the qualitative software into a standard word processing package, such as Microsoft Word. Data from each exported code should be labelled as a ‘coding’ file (e.g. data from a code focusing on factors that facilitate or enable treatment entry might be labelled ‘enablers coding’) (Fig. 2). Because the raw data will have been coded into fairly broad codes, many of which will resemble topics or questions raised by the researcher at the data generation stage, these coding files will probably be long—potentially 100–200 pages. This is not, however, a problem; the length of the coding files simply reflects the fact that the data still retain valuable contextual material. In an ideal world, an electronic coding file would be created for every study code and then analysed sequentially. In the real world, the researcher may have a good sense of codes that contain data of limited interest and codes that contain very fertile data. In which case, prioritizing the coding files to be exported and analysed may be justified.
Figure 2.
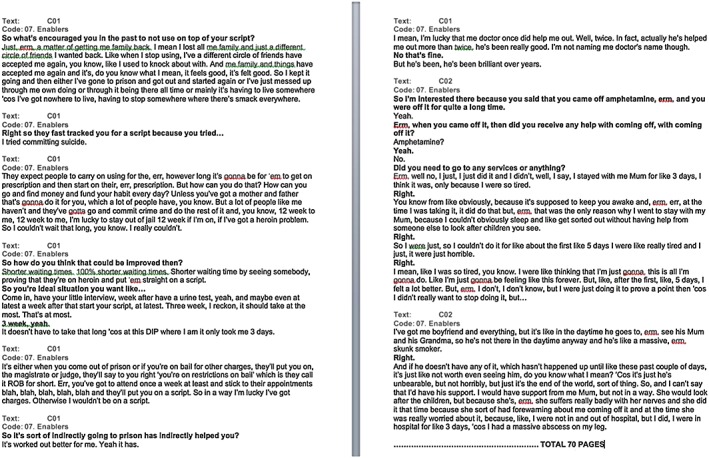
Extract of coded data
Descriptive analyses
Exported coding files should be duplicated with the duplicate file renamed as an analysis file, e.g. ‘enablers analysis’. Each coding file should be stored electronically with its partner analysis file, but from this point the coding file will be a reference document only and the analyses will be undertaken using the analysis file. Each analysis file should next be skim‐read, with the researcher spontaneously noting down topics and themes, perhaps also generating mind maps to show how issues seem to interconnect. This relatively creative process should assist the researcher in further prioritizing codes for analysis, identifying duplication, complementarity and contradiction between codes, and assessing the probable nature and range of findings. Notes and diagrams should then be set aside so that more systematic inductive line‐by‐line analyses can begin.
At this point, the first analysis file should be opened and the font and formatting edited so that as much text as possible can be read on a single computer screen: in this regard, it is best to convert the file to small fount with single line‐spacing. The file should also be given a clear heading. The cursor can next be placed near the top of the page on the line after the heading and the return key pressed repeatedly so that there is approximately half a page of blank space between the heading and the coding extracts. The ‘split screen’ function should then be used just below the file heading, so that the top half of the screen is blank and the bottom half shows the file heading and coding extracts (Fig. 3).
Figure 3.
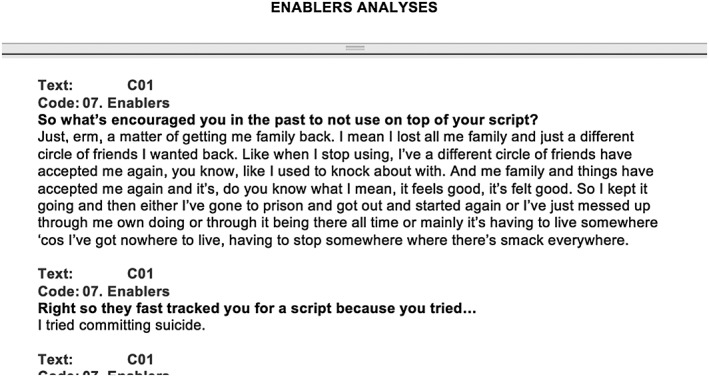
Split screen ready for analyses
The researcher can now read the first coding extract in the bottom of the screen and summarize the key points made in the top half. This might be one simple point or several points. Each point should be written on a new line with the identifier of the data source included in brackets at the end of each point (Fig. 4). The coded data extract that has been summarized at the top of the screen can now be deleted from the bottom of the screen and the researcher can move to the next coded extract repeating the process. When a point already noted in the top half of the screen recurs in another coding extract in the bottom half of the screen, the identifier of the second source can be added to the brackets, separated from the first source by a semi‐colon. If there is a slight difference or subtle nuance that distinguishes the point made in the second source from the first source, this can be included within the brackets after the semi‐colon.
Figure 4.
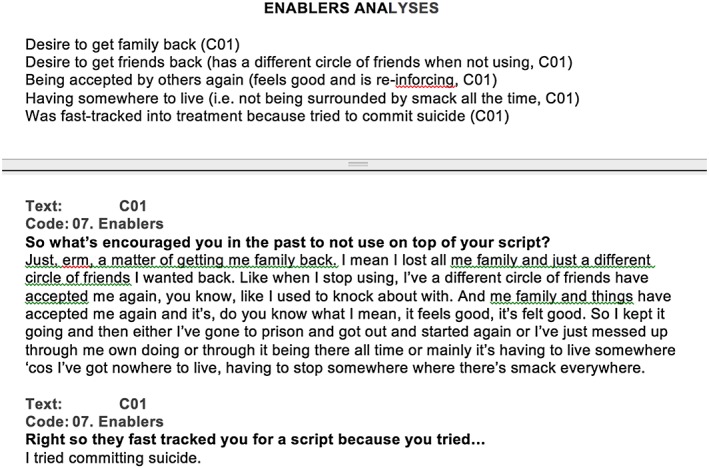
Initial line‐by‐line analyses
The researcher works their way down the coding extracts in the bottom half of the screen and deletes each extract once it has been summarized in the top half of the screen. After every 10–15 coding extracts have been summarized, the researcher should review and rationalize the list of points in the top half of the screen, grouping any similar points together. Before long, it will become evident that some points have been made by many participants and the qualifiers within the brackets will start to display complex commonalities and differences (Fig. 5). If, in undertaking this process, the researcher identifies any particularly apt quotations, these should be summarized like other coded data, but left in the bottom half of the screen rather than deleted. Once the researcher reaches the end of the coding extracts, all the data will have been systematically reduced with the qualifiers and identifiers within the brackets, providing a strong connection back to the original source (and context), and the quotations offering useful illustrative material.
Figure 5.
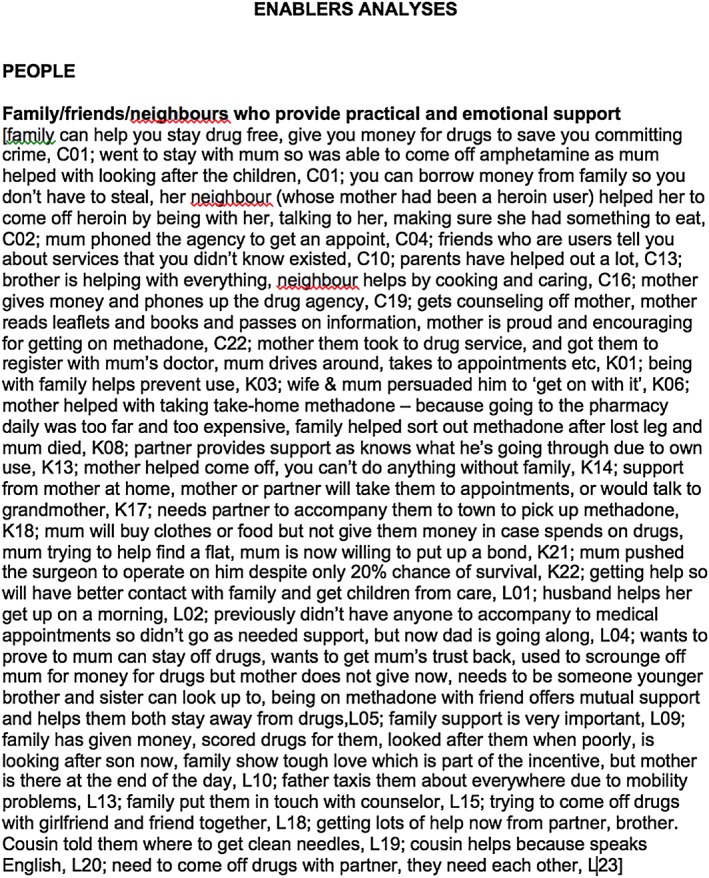
Example of analytical complexity
Next, the researcher should review, rationalize and re‐group all the points one further time to ensure some logical order or emerging narrative—usually with the most often‐discussed points at the top of the list and the least frequent or more unusual points at the bottom (Fig. 6; Supporting information, File S1, provides for a longer worked example). This can be a creative process, as the researcher may want to construct new headings or subheadings, potentially of a more abstract or conceptual nature. To complete the analysis file, the researcher should then summarize quickly and spontaneously initial thoughts on the findings in a few paragraphs of text at the top of the file or intersperse these between sections of the analysis (see Supporting information, File S2). As the process of writing while contemplating the meaning of a display of data can inspire further analyses 8, 36, the researcher will now be suitably primed for more interpretive work.
Figure 6.
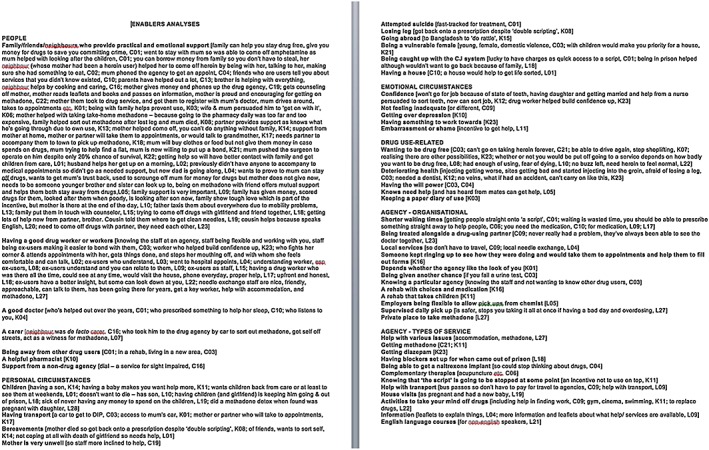
Grouped and re‐ordered analyses
Interpretive analyses
In the second stage of the analysis, the aim is to identify patterns, associations, concepts and explanations within the data and to ascertain how the findings complement or contradict previously published literature, theories, policies or practices. It is not always necessary, or indeed possible, to accomplish all these goals with every analysis file or in every study. For example, someone analysing data from a study that seeks to evaluate an intervention and has practitioners and commissioners as the intended audience may not need to engage with complex macro theories. Equally, a researcher working within one discipline may legitimately explore their findings in relation to other work within their own or a cognate discipline rather than unrelated disciplines. Thus, a sociologist may prefer to explore how their findings relate to some aspect of ‘social’ rather than ‘psychological’ theory. The key point is that the analyst must find a way of moving beyond a simple description of their own data so that their findings are transferable (i.e. have meaning) to other contexts 37.
To begin, each completed analysis file should be read and re‐read. Specifically, the researcher needs to consider: (a) which points or issues or themes recur within (and potentially across) the analyses files; (b) whether and, if so, how these points or issues or themes can be categorized into higher order concepts, constructs or typologies beyond those already identified in the earlier descriptive stage; and (c) the extent to which points or issues or themes apply to pre‐identified subsets of the data/study participants. Assuming the coded source documents had clear identifiers and the number of cases/participants is not too large, it should be easy to see (from the analysis file) whether one particular group of individuals (e.g. men or women) made the same point or points repeatedly or if particular points were relevant to just first or second interviews, etc. Care must, however, be taken not to over‐quantify this process, as the aim is to look for clear patterns in the data, not statistical differences.
Similarly, the researcher can next test other more speculative hunches or theories they have about the data, including those based on their knowledge of the existing literature or policy or practice. They may also return to their notes and mind maps produced at the start of the descriptive stage for inspiration. For example, previous research might have suggested that a particular experience is common among injectors with resident children. If so, they can check which participants made the point in question and then back‐check the characteristics of those participants using the original source documents or any participant attributes created in the qualitative software program at the coding stage. A researcher working within a particular theoretical tradition or branch of a discipline can also explore how their data are consistent with, add to, or contradict common assumptions in that field. Similarly, findings from a study of a particular intervention or service can be related to other similar interventions or services and thence to broader policymaking and service commissioning processes to support, oppose or suggest changes to current practice.
All findings (positive or negative) should be written up more formally and saved as a separate summary file (Fig. 7; Supporting information, File S3). Alternatively, they can be added to the final analysis file and then saved as a separate summary file. The researcher can also include quotations in the summary file and use highlighting or other formatting to distinguish what participants actually reported from their own interpretations of the findings (Supporting information, File S4).
Figure 7.
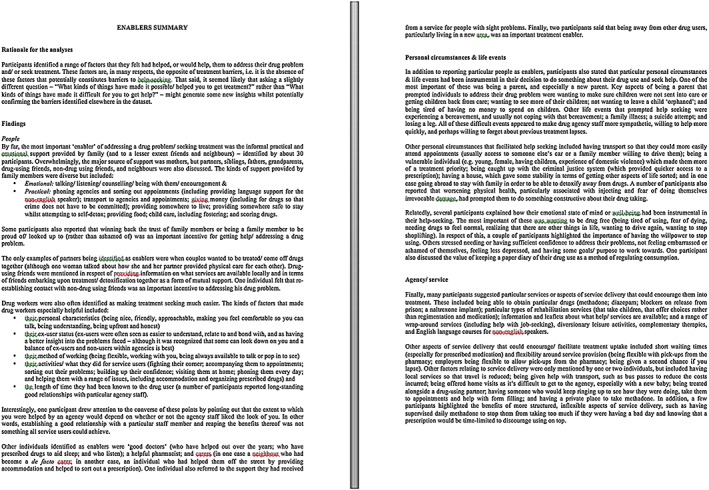
Summarized analyses
Writing up the findings
Summary documents can often be linked together to form the basis of a study report. This is because the analyses (if executed as suggested) should map back onto the codes, which should map back to any interview guide, which was devised with the original study aims and objectives in mind. Thus, there is a clear forward and backwards trajectory from the study starting point to its conclusion. Further, after completing the IC stages, the researcher will have a very good idea of which aspects of the data will make for interesting research papers and one or more analysis files can then be used to structure a journal article. For example, Figs 6 and 7 form the basis of Neale et al., 2007 34 and Supporting information, Files S1–S4 form the basis of Neale et al., 2012 5 and Neale & Strang, 2015 6. Using both the summary files and the more detailed analyses files, the researcher can thus write up themes, identify any new concepts or categories and document and endeavour to account for any patterns or associations in the data. Illustrative quotations can be selected from the analysis or summary document or the researcher can return to the earlier coding file for additional original text.
A further note on using computer software
In principle, the entire IC process could be carried out without using any specialist qualitative software. Microsoft Word, Excel and Access can, with time and patience, be used to code and analyse qualitative data 38. Indeed, it is not so long since all qualitative data were coded and analysed by hand. Alternatively, it could be argued that it is preferable to execute all IC stages using a single specialist software program, as this would facilitate data management, reduce the chances of file corruption or human error when dealing with multiple files, support team working more effectively by providing simultaneous access to the data by multiple users, and retain a stronger link between summarized data and their source (context).
The degree to which a researcher engages with the latest software is, in practice, a matter of personal preference. Coding using specialist software tends to be much quicker than by Word or hand. Meanwhile, Word files containing coded data are more portable and accessible than data coded in specialist software, and this can help to engage team members who may not use any qualitative software or who may prefer a different program. Equally, there are risks when team members analyse the same data file simultaneously in case they override each other; yet it is easy for them to each analyse a different Word file simultaneously. Lastly, specialist software may be able to link summarized data back to their source (context) with a single mouse click. However, the value of this facility actually depends upon the extent to which the analyst has intimate knowledge of the data and when, where, how and why they were generated. No computer program can substitute for this.
Strengths and weaknesses of IC
IC is a rigorous and transparent technique for managing the analysis of qualitative data. It is particularly suitable for novice qualitative researchers who may welcome a set of standardized steps to follow when trying to make sense of their data, but it can also reassure sceptical journal editors, reviewers or readers who question the rigour of qualitative analyses 9, 39. Furthermore, a lone researcher can use IC to demonstrate the validity and potential repeatability of their methods. IC is compatible with, and can support, most common analytical approaches, and is underpinned by concurrent data reduction, data display and conclusion‐drawing/verification18. The technique generates a clear audit trail with the analyses always linked back to the raw data (so that the original words of the study participants are never lost) and projecting forwards (so that the findings move beyond simple local description demonstrating relevance to the wider world).
More negatively, IC is a time‐consuming process, with a single code often taking many hours to analyse. That said, all qualitative analyses take time if executed thoroughly. Similarly, the quality of the analyses undertaken cannot be divorced from the skills and experience of the analyst, including the extent to which they understand the topic and relevant literature and have been involved in the study design and data generation. IC is intended for textual data (rather than images or film) and assumes that the study is guided by clear a clear aim and objectives or research question. As such, it is less suited to studies using a more unstructured approach, e.g. Grounded Theory. Ideally, all the data should have been generated and coded before the main analysis begins, although this is not essential. Experienced analysts may baulk at the degree of structure involved in IC, but they are not the primary intended audience. Furthermore, there is scope for creativity within the structure outlined, particularly at the interpretative stage.
In IC, data are coded typically using qualitative software and then the codings are exported into a word‐processing package for line‐by‐line analysis. While continuing advances in qualitative software design may make the reliance or a word‐processing package appear antiquated, this is offset by two factors: (i) understanding the core principles of rigorous analysis is a prerequisite to using any specialist software that merely facilitates the process; and (ii) IC is intended to be a pragmatic analytical technique and others are therefore at liberty to develop and adapt it for use within specialist software if they wish. Ultimately, however, the challenge is for qualitative software designers to develop an accessible program that enables researchers to progress more transparently through the black box that still separates their sophisticated online coding trees, grids and charted summaries from written publications.
Declaration of interests
J.N. is part‐funded by the National Institute for Health Research (NIHR) Biomedical Research Centre for Mental Health at South London and Maudsley NHS Foundation Trust and King's College London. The views expressed are those of the author and not necessarily those of the NHS, the NIHR or the Department of Health.
Supporting information
Supplementary File 1 Analyses from: Neale J., Strang J. Naloxone – does over‐antagonism matter? Evidence of iatrogenic harm after emergency treatment of heroin/opioid overdose. Addiction 2015; 110, 1644‐1652.
Supplementary File 2 Analyses from: Neale J., Nettleton S., Pickering L., Fischer J. Eating patterns amongst heroin users: a qualitative study with implications for nutritional interventions. Addiction 2012; 107: 635‐41.
Supplementary File 3 Summary from: Neale J., Nettleton S., Pickering L., Fischer J. Eating patterns amongst heroin users: a qualitative study with implications for nutritional interventions. Addiction 2012; 107: 635‐41.
Supplementary File 4 Summary from: Neale J., Strang J. Naloxone – does over‐antagonism matter? Evidence of iatrogenic harm after emergency treatment of heroin/opioid overdose. Addiction 2015; 110, 1644‐1652.
Supporting info item
Supporting info item
Supporting info item
Supporting info item
Acknowledgement
Open access for this article was funded by King's College London.
Neale, J. (2016) Iterative categorization (IC): a systematic technique for analysing qualitative data. Addiction, 111: 1096–1106. doi: 10.1111/add.13314.
References
- 1. Fountain J., Griffiths P. Synthesis of qualitative research on drug use in the European Union: report on an EMCDDA project. European Monitoring Centre for Drugs and Drug Addiction. Eur Addict Res 1990; 5: 4–20. [DOI] [PubMed] [Google Scholar]
- 2. Miller P. G., Strang J., Miller P. M. Introduction In: Miller P. G., Strang J., Miller P. M., editors. Addiction Research Methods. Oxford: Wiley‐Blackwell; 2010, pp. 1–8. [Google Scholar]
- 3. Rhodes T., Stimson G. V., Moore D., Bourgois P. Qualitative social research in addictions publishing: creating an enabling journal environment. Int J Drug Policy 2010; 21: 441–4. [DOI] [PMC free article] [PubMed] [Google Scholar]
- 4. Neale J., Allen D., Coombes L. Qualitative research methods within the addictions. Addiction 2005; 100: 1584–93. [DOI] [PubMed] [Google Scholar]
- 5. Neale J., Nettleton S., Pickering L., Fischer J. Eating patterns amongst heroin users: a qualitative study with implications for nutritional interventions. Addiction 2012; 107: 635–41. [DOI] [PubMed] [Google Scholar]
- 6. Neale J., Strang J. Naloxone—does over‐antagonism matter? Evidence of iatrogenic harm after emergency treatment of heroin/opioid overdose. Addiction 2015; 110: 1644–52. [DOI] [PubMed] [Google Scholar]
- 7. Jones S. The analysis of depth interviews In: Walker R., editor. Applied Qualitative Research. Aldershot: Gower; 1985, pp. 56–70. [Google Scholar]
- 8. Ritchie J., Lewis J. Qualitative Research Practice: A Guide for Social Science Students and Researchers. London: Sage; 2003. [Google Scholar]
- 9. Stenius K., Mäkelä K., Miovsky M., Gabrhelik R. How to write publishable qualitative research In: Babor T. F., Stenius K., Savva S., O’Reilly J., editors. Publishing Addiction Science: A Guide for the Perplexed, 2nd edn. Hockley, Essex: Multi‐Science Publishing Company Ltd, UK; 2008, pp. 82–96. [Google Scholar]
- 10. Mason J. Qualitative Researching. London: Sage; 1996. [Google Scholar]
- 11. Northcote J., Moore D. Understanding contexts: methods and analysis in ethnographic research on drugs In: Miller P. G., Strang J., Miller P. M.,., editors. Addiction Research Methods. Oxford: Wiley‐Blackwell; 2010, pp. 287–98. [Google Scholar]
- 12. Critical Appraisal Skills Programme (CASP) . Qualitative research checklist 31.05.13. 2013. Available at: http://media.wix.com/ugd/dded87_29c5b002d99342f788c6ac670e49f274.pdf (accessed 13 August 2015).
- 13. Tong A., Sainsbury P., Craig J. Consolidated criteria for reporting qualitative research (COREQ): a 32‐item checklist for interviews and focus groups. Int J Qual Health Care 2007; 19: 349–57. [DOI] [PubMed] [Google Scholar]
- 14. Clark J. P. How to peer review a qualitative manuscript In: Godlee F., Jefferson T., editors. Peer Review in Health Sciences, 2nd edn. London: BMJ Books; 2003, pp. 219–35. [Google Scholar]
- 15. Coombes L., Allen D., Humphrey D., Neale J. In‐depth interviews In: Neale J.,., editor. Research Methods for Health and Social Care. Basingstoke: Palgrave; 2009, pp. 195–210. [Google Scholar]
- 16. Morton‐Williams J. Making qualitative research work—aspects of administration In: Walker R.,., editor. Applied Qualitative Research. Aldershot: Gower; 1985, pp. 27–42. [Google Scholar]
- 17. Oliver D. G., Serovich J. M., Mason T. L. Constraints and opportunities with interview transcription: towards reflection in qualitative research. Social Forces 2005; 84: 1273–89. [DOI] [PMC free article] [PubMed] [Google Scholar]
- 18. Miles M. B., Huberman A. M. Qualitative Data Analysis: An Expanded Source Book, 2nd edn London: Sage; 1994. [Google Scholar]
- 19. NVivo qualitative data analysis software. QSR International Pty Ltd, Version 10; VIC., Australia: QSR International Pty Ltd; 2012.
- 20. MAXQDA software for qualitative data analysis. Berlin, Germany: VERBI Software—Consult‐ Sozialforschung GmbH; 1989–2015. [Google Scholar]
- 21. Scientific Software Development (Germany) . Scientific Software Development's ATLAS.ti. The Knowledge Workbench: Short Use Manual. Berlin, Germany: Scientific Software Development; 1997. [Google Scholar]
- 22. QDA Miner Lite (Freeware) . Montreal, Quebec, Canada: Provalis Research; 2012.
- 23. Coding Analysis Toolkit CAT. Qualitative Data Analysis Program (QDAP). Pittsburgh, PA: University of Pittsburgh; 2007. [Google Scholar]
- 24. Aquad (Freeware) . Version 7. Tübingen, Germany: Günter L. Huber; 2015.
- 25. Charmaz K. Constructing Grounded Theory: A Practical Guide Through Qualitative Analysis. Los Angeles: Sage; 2006. [Google Scholar]
- 26. Corbin J., Strauss A. Basics of Qualitative Research: Techniques and Procedures for Developing Grounded Theory, 3rd edn Thousand Oaks: Sage; 2007. [Google Scholar]
- 27. Rhodes T., Coomber R. Qualitative methods and theory in addictions research In: Miller P. G., Strang J., Miller P. M., editors. Addiction Research Methods. Oxford: Wiley‐Blackwell; 2010, pp. 59–78. [Google Scholar]
- 28. Neale J. Experiences of illicit drug overdose: an ethnographic study of emergency hospital attendances. Contemp Drug Probl 1999; 26: 505–30. [Google Scholar]
- 29. Neale J. Suicidal intent in non‐fatal illicit drug overdose. Addiction 2000; 95: 85–93. [DOI] [PubMed] [Google Scholar]
- 30. Neale J. Methadone, methadone treatment and non‐fatal overdose. Drug Alcohol Depend 2000; 58: 117–24. [DOI] [PubMed] [Google Scholar]
- 31. Neale J. Drug Users in Society. Basingstoke: Palgrave; 2002. [Google Scholar]
- 32. Creswell J. W. Research Design: Quantitative, Qualitative, and Mixed Methods Approaches, 2nd edn Thousand Oaks, CA: Sage; 2003. [Google Scholar]
- 33. Menand L., editor. Pragmatism: A Reader. London: Vintage Books; 1997. [Google Scholar]
- 34. Neale J., Sheard L., Tompkins C. Factors that help injecting drug users to access and benefit from services: a qualitative study. Subst Abuse Treat Prev Policy 2007; 2: 31. [DOI] [PMC free article] [PubMed] [Google Scholar]
- 35. Neale J., Godfrey C., Parrott S., Sheard L., Tompkins C. Barriers to the effective treatment of injecting drug users In: MacGregor S.,., editor. Responding to Drugs Misuse: Research and Policy Priorities in Health and Social Care. London: Routledge; 2009, pp. 86–98. [Google Scholar]
- 36. Lofland J., Lofland L. H. Analyzing Social Settings: A Guide to Qualitative Observation and Analysis, 2nd edn Belmont, CA: Wadsworth; 1984. [Google Scholar]
- 37. Neale J., Hunt G., Lankenau S., Mayock P., Miller P., Sheridan J., et al. Addiction journal is committed to publishing qualitative research. Addiction 2013; 108: 447–9. [DOI] [PubMed] [Google Scholar]
- 38. Hahn C. Doing Qualitative Research Using Your Computer: A Practical Guide. Los Angeles: Sage Publications; 2008. [Google Scholar]
- 39. Green J., Thorogood N. Qualitative Methods for Health Research. London: Sage; 2004. [Google Scholar]
Associated Data
This section collects any data citations, data availability statements, or supplementary materials included in this article.
Supplementary Materials
Supplementary File 1 Analyses from: Neale J., Strang J. Naloxone – does over‐antagonism matter? Evidence of iatrogenic harm after emergency treatment of heroin/opioid overdose. Addiction 2015; 110, 1644‐1652.
Supplementary File 2 Analyses from: Neale J., Nettleton S., Pickering L., Fischer J. Eating patterns amongst heroin users: a qualitative study with implications for nutritional interventions. Addiction 2012; 107: 635‐41.
Supplementary File 3 Summary from: Neale J., Nettleton S., Pickering L., Fischer J. Eating patterns amongst heroin users: a qualitative study with implications for nutritional interventions. Addiction 2012; 107: 635‐41.
Supplementary File 4 Summary from: Neale J., Strang J. Naloxone – does over‐antagonism matter? Evidence of iatrogenic harm after emergency treatment of heroin/opioid overdose. Addiction 2015; 110, 1644‐1652.
Supporting info item
Supporting info item
Supporting info item
Supporting info item


