

Abstract
Circulating tumor cells (CTCs) were introduced as biomarkers more than 10 years ago, but capture of viable CTCs at high purity from peripheral blood of cancer patients is still a major technical challenge. Here, we report a novel microfluidic platform designed for marker independent capture of CTCs. The Parsortix™ cell separation system provides size and deformability‐based enrichment with automated staining for cell identification, and subsequent recovery (harvesting) of cells from the device. Using the Parsortix™ system, average cell capture inside the device ranged between 42% and 70%. Subsequent harvest of cells from the device ranged between 54% and 69% of cells captured. Most importantly, 99% of the isolated tumor cells were viable after processing in spiking experiments as well as after harvesting from patient samples and still functional for downstream molecular analysis as demonstrated by mRNA characterization and array‐based comparative genomic hybridization. Analyzing clinical blood samples from metastatic (n = 20) and nonmetastatic (n = 6) cancer patients in parallel with CellSearch® system, we found that there was no statistically significant difference between the quantitative behavior of the two systems in this set of twenty six paired separations. In conclusion, the epitope independent Parsortix™ system enables the isolation of viable CTCs at a very high purity. Using this system, viable tumor cells are easily accessible and ready for molecular and functional analysis. The system's ability for enumeration and molecular characterization of EpCAM‐negative CTCs will help to broaden research into the mechanisms of cancer as well as facilitating the use of CTCs as “liquid biopsies.”
Keywords: circulating tumor cell, deformability, liquid biopsy, epithelial–mesenchymal transition
Short abstract
What's new?
Circulating tumor cells (CTCs) carry vital information about a tumor but are few in number, challenging their use as diagnostic tools. Moreover, not all CTCs express epithelial markers, holding back the advance of promising approaches based on the combination of cell‐surface antigen targeting with microfluidic technology. Here, an antigen‐independent microfluidic separation platform based on differences in cell size and deformability is shown to effectively capture CTCs, enabling the isolation of CTCs from tumors lacking epithelial markers. The capture of viable CTCs from peripheral blood paves the way to the future use of “liquid biopsies” in cancer diagnosis.
Cells from solid tissues that are shed into the circulatory system have the potential to be useful for diagnosis and therapy in several clinical conditions. In cancer patients, circulating tumor cells (CTCs) detached from solid tumor tissues are found in the blood stream1 and these cells can potentially lead to metastasis.2 It is widely accepted that CTCs may be used as diagnostic and therapeutic indicators. However, the low concentration of these cells leads to challenges for purification, quantification and characterization and requires highly specialized approaches for their isolation.3, 4 Several strategies have been used to process blood for the analysis of CTCs.2, 5, 6 Many of the most common methods use antibodies against cell surface markers such as the epithelial cell adhesion molecule (EpCAM) to positively enrich the CTC population in the blood sample. The CellSearch® system is the most commonly used assay for CTC detection and at present is the only assay that has been authorized for clinical use by the US Food and Drug Administration (FDA). Using this approach, CTC concentration was linked to reduced progression‐free survival (PFS), and overall survival (OS), in primary and metastatic disease of patients with breast, colon, prostate and lung cancers.7, 8, 9, 10, 11, 12
Several other antibody‐based systems have been used successfully.2, 3, 4 However, due to absence of epitopes or differences in their expression and difficulties with cell surface exposure to the capture substrate, affinity‐based methods can be limited in their sensitivity.13, 14, 15 In addition, the need to maximize target cell purity, isolate cells in viable state, and in a form that facilitates downstream molecular analyses, has led to the development of other technical approaches.
Platforms that combine EpCAM‐capture with microfluidic designs are promising alternatives for selective capture of CTCs.16, 17, 18 Nevertheless, these approaches have not addressed the concern that metastasis formation involves transition of tumor cells into a mesenchymal state [epithelial–mesenchymal transition (EMT)], which may lead to downregulation of EpCAM on CTCs.5, 19
Systems with separation based on physical characteristics have the potential to bypass the problems associated with EpCAM dependence.2, 4, 20 For example, Ozkumur et al.14 reported a platform using size‐based enrichment either in combination with positive target cell selection (based on EpCAM) or with separate depletion of hematopoietic cells. Using the antigen independent mode, CTCs from several types of cancers that had lost or never expressed epithelial markers (e.g., triple‐negative breast cancer and melanomas) were detected with this system. Other size‐based technologies have also been used to enrich CTCs.12, 21 However, yields, identification of captured cells and release of captured CTCs for subsequent analysis in these systems remain challenging.
Microfluidic “weir type” structures have previously been reported to generate very effective size‐based cell enrichment.22 Here, we present a novel micro‐scale separation platform consisting of stepped physical structures that progressively decrease the dimensions of the fluidic path through which cells in liquid suspension are made to flow. This platform is based on a microfluidic separation technology that employs differences in cell size and deformability to separate, capture and subsequently harvest rare cells from blood. We demonstrate this system's ability to capture viable CTCs at high purity in spiking experiments as well as in clinical samples.1
Materials and Methods
Parsortix™ system and cell capture principle
All experiments described in this article employed a single use, disposable cassette that incorporates the separation method in a design suited to capture of CTCs from blood (ANGLE North America, Cell Separation Cassette GEN3D10, Figs. 1a–1c). The cassette is used in conjunction with a specially developed fluidic processor (ANGLE North America, Parsorter PR1, Fig. 1d) that generates controlled fluid flow during blood separation, and reverse flow through the device for subsequent recovery of captured cells (“harvesting”).2
Figure 1.
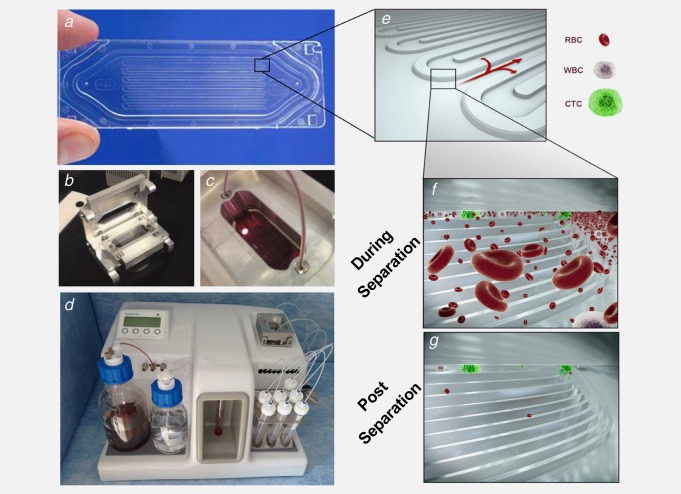
Microfluidic device and cell capture principle. (a) Photograph of the separation device and (e)–(g) diagrams with progressive enlargements to show the stepped separation structure, blood cells and CTCs during separation and captured CTCs at the end of separation. (b) and (c) Photographs of the device and its positioning in a clamp to enable connection to the processor. (d) Microfluidic processor with a device‐clamp assembly connected.
The cassette, illustrated in Figure 1a–c, has the dimensions of a microscope slide. It is made from two components: (i) a plastic molding that contains the stepped separation structure and flow channels and (ii) a heat‐bonded thin plastic cover, forming an enclosed structure. The space between the cover and the step structure surface forms a size‐restricted gap that enables cell separation. Blood enters the cassette through an inlet port incorporated into the molding, and waste material exits through an outlet port at its other end. The sample passes through a fluidic path leading to flow distribution channels and over the stepped separator. Importantly, the stepped separation technology can be deployed in different arrangements depending upon the cell separation objectives of individual device designs. In the present case the cassette has two key design elements: (i) a final separation gap of 10 µm (mean of measured gap sizes 10.1 µm, with a standard deviation of 0.52 µm) and (ii) the separation structure's capacity is maximized by a single, large separation element being incorporated onto the available surface area in a continuous series of folds. A video file showing the separation of blood in the device and animation demonstrating the separation micro‐structure and cell capture principle are available in the supplementary materials.
Cell culture
All cell lines utilized in these experiments were obtained from ATCC (Manassas, VA). The following tumor derived cell lines were selected: PANC‐1 (pancreatic cancer), PC3 (prostate cancer), A375 (melanoma), A549 (lung cancer), T24 (bladder cancer) and MDA‐MB‐468 (breast cancer). Cells were cultured under standard conditions in humidified incubators at 37°C with 5% CO2 in cell culture flasks using the following recommended media: DMEM for PANC‐1, A375 and MDA‐MB‐468; RPMI‐1640 for PC‐3, McCoy's 5A for T24 and F‐12K for A549 (Corning Cellgro). Media were fortified with 10% fetal bovine serum (FBS) and 1% Streptomycin as antibiotic. For routine passaging and preparation of cells for experimentation, cells were washed with 1 x PBS and treated with trypsin EDTA as recommended by ATCC product sheets.
Measurement of cell sizes
Cell size measurements were performed using a lipophilic fluorescent cell linker (Sigma‐Aldrich PKH67 mini), which binds to cell membranes and gives clear outlines of cells for measurement using fluorescence microscopy. Cells were labeled according to supplier instructions. Images of labeled cells collected using a Leica DMI5000 fluorescence microscope were analyzed using the ImageJ software package (National Institutes of Health). Size measurements were made on 67 cells of the PANC‐1 line and 85 cells of the T24 line. Colour images were converted to 16‐bit grayscale in order to enable input to ImageJ. The threshold for each image was set to disregard noise that did not correspond to cells. Values for the lower threshold ranged from 20 to 35. The Analyze Particles tool was used to obtain Feret diameters of cells. Feret diameter measurement involves taking the average of a series of measurements of cell diameter at different positions. The Analyze Particles tool was configured to ignore particles with an area less than 29 µm2.
Preparation of cells for spiking
Cells were either prelabeled with carboxyfluorescein diacetate succinimidyl ester (CFSE) (CellTrace, Life Technologies, C34554) or stained after harvesting. Briefly, cultured cells were trypsinized, transferred to a 15 mL tube, centrifuged at 1000 rpm for 3 min and washed with PBS. Approximately 1 × 10⁶ cells in 1 mL of PBS were mixed with 5 µl of 10 µM CellTrace solution, incubated at 37°C for 5 min, centrifuged at 400 rpm for 5 min, washed in PBS and recentrifuged. The pellet was re‐suspended in appropriate culture medium and a 10 µl aliquot counted on a disposable hemocytometer (Invitrogen, C10283 using fluorescence microscopy. Cells for each experiment were counted at least in triplicate, and average values were used to determine volumes required for a target number of spiked cells. The appropriate volumes of cell suspension containing the required number of cells were dispensed into 2 mL of blood from healthy individuals and separated on the fluidic processor described above. Captured cells were counted by observation using fluorescence microscopy.
Blood sample collection
Blood samples from healthy individuals were purchased from Interstate Blood Bank (Memphis, TN), collected in tubes containing ethylenediaminetetraacetic acid (EDTA) (Becton Dickinson 366643) or CellSave® Preservative Tubes (Janssen Diagnostics). Blood samples (4 mL for Parsortix™ and 7.5 mL for CellSearch®) from 26 patients were analyzed in this study [metastatic breast (n = 10), nonmetastatic colon (n = 5), metastatic colon (n = 5), metastatic lung (n = 5) and nonmetastatic lung (n = 1)]. Cancer patients, treated at the University Medical Center Hamburg‐Eppendorf, were collected into CellSave® Preservative Tubes (Janssen Diagnostics) and processed by Parsortix™ or CellSearch® within 96 hours. The study was carried out in accordance with the World Medical Association Declaration of Helsinki and the guidelines for experimentation with humans by the Chambers of Physicians of the State of Hamburg (“Hamburger Ärztekammer”). The experimental protocol was approved (Approval No. PVN‐3779) by the Ethics Committee of the Chambers of Physicians of the State of Hamburg (“Hamburger Ärztekammer”). All participants gave written informed consent before the study began. Samples were prepared in the same manner described in the materials and methods and in accordance with the operating procedures for the CellSearch® and Parsortix systems.
Immunocytochemistry
Immunocytochemistry was used to confirm the identity of spiked tumor cells (in addition to use of prelabeling) and of CTCs isolated by Parsortix™. Captured cells were stained after harvesting using the CellSearch® antibody cocktail (Janssen Diagnostics). Briefly, blood samples were separated and harvested by Parsortix™, then cytospun. The sample was dried overnight on a glass slide. The slide was then incubated with a mixture of 120 µl PBS plus 20 µl CellSearch® DAPI, 20 µl CellSearch® staining reagent, 20 µl CellSearch® permeabilization reagent and 20 µl CellSearch® Fixation reagent. The slide was incubated for 30 min at room temperature, washed three times with PBS, covered with a coverslip and examined by fluorescence microscopy. Morphologically intact cells (≥4 µm) that were Keratin‐positive, DAPI‐positive and CD45‐negative events were interpreted as CTCs.
Cell viability assay
To investigate the impact on cell viability of the cell capture and harvesting processes we used a standard assay involving a pair of fluorescent dyes (Live/Dead viability cytotoxicity kit, L‐3224, Life Technologies). This technique discriminates live from dead cells by simultaneous staining with green‐fluorescent calcein‐AM for intracellular esterase activity to identify live cells, and with red‐fluorescent ethidium homodimer‐1 to identify dead cells by loss of cell membrane integrity. In these experiments, the Live/Dead dyes were used in conjunction with a third dye, Hoechst nuclear stain 33342 (Thomas Scientific, 62249), which was used as a prelabel for spiked cells. The combination of these three dyes enabled distinction between spiked cells and normal nucleated blood cells.
PC‐3 cells were first trypsinized, centrifuged and washed with PBS. After further centrifugation, approximately 106 cells were suspended in 1 mL of PBS, to which 2 µl of the Hoechst dye was added. After incubation at room temperature for 10 min, the suspension was diluted by addition of 9 mL of PBS, followed by centrifugation at 400 rpm for 5 min. The pellet was then resuspended in 1 mL of PBS.
Hoechst labeled cells were counted by hemocytometer and spiked into blood as described above. 200 labeled cells were spiked into 2 mL of healthy blood, and separation and harvests performed using Parsortix™ Cell Separation System standard protocols. Five experiments were performed. Two experiments involved assay of viability of cells captured and remaining in the cassette. At completion of the separations, numbers of captured blue fluorescing cells were counted, after which 40 µl of Live/Dead dye were dispensed directly into the cassette, through its inlet port, using a micropipette. After incubation at room temperature for approximately 10 min, fluorescence microscopy was used to count viable cells (identified as combining blue and green fluorescence) and nonviable cells (identified as combining blue and red fluorescence).
Three experiments involved assay of cell viability after harvesting from the cassette. At completion of separation, cells were harvested into 200 µl of PBS and transferred to a 1 cm cell culture well containing an equal volume of Live/Dead dye mixture. After incubation at room temperature for approximately 10 min, viable and nonviable cells were counted as described above.
Biological status of harvested cells via qualitative RT‐PCR
In order to test cell viability after harvesting, qualitative RT‐PCR was performed. MDA‐MB‐468 breast cancer cells were spiked into blood from healthy donors by micromanipulation and processed by our device. During this process cell‐free nucleic acids pass the chip and do not affect the applicability of the PCR since only cells are isolated whereas cell‐free nucleic acids pass the cassette. Harvested cells were transferred into PCR tubes, centrifuged, washed with PBS, followed by RNA isolation (RNeasy Micro Kit, Qiagen), cDNA synthesis (First Strand cDNA Synthesis Kit, Thermo Scientific) and qualitative PCR. As a control, blood samples from 3 healthy individuals were used without spiked tumor cells. Water was used as a negative control for the RT‐PCR reaction. mRNA expression of tumor cell specific transcripts (EpCAM, EGFR (epidermal growth factor receptor) and Keratin19) as well as HPRT (hypoxanthin‐guanin‐phosphoribosyltransferase) as a house‐keeping gene, were assayed. The following primers were designed using the Primer3 software (Untergasser et al. 2012): EpCAM sense primer 5′‐GCTGGT GTGTGAACACTGCT‐3′/antisense 5′‐ACGCGTTGTGATCT CCTTCT‐3′; EGFR sense 5′‐CAGCGCTACCTTGTCATTCA‐3′/antisense 5′‐TGCACTCAGAGAGCTCAGGA‐3′; keratin19 5′‐CGAACCAAGTTTGAGACG‐3′/antisense 5′‐GATCTGCA TCTCCAGGTC‐3′; HPRT sense 5′‐GACCAGTCAACAGGG GACAT‐3′/antisense 5′‐CTTGCGACCTTGACCATCTT‐3′). PCR was performed in a peqStar Thermocycler (Peqlab). Amplification of the transcripts was performed under the following conditions: after 10 min denaturation at 95°C, the RNA was submitted to 40 cycles of denaturation at 94°C for 30 sec, annealing at 60°C for 30 sec and elongation for 30 sec at 72°C. After final elongation step at 72°C for 10 min the samples were stored at 4°C. Ethidium bromide stained‐agarose gel electrophoresis was performed to visualize PCR products.
Array‐based comparative genomic hybridization
Array‐based comparative genomic hybridization (aCGH) was performed on 4 CTCs as well as on 2 leukocytes as control, isolated from the same patient sample as previously described.23, 24 Cells were picked by micromanipulation and the analysis presented here, employed the ADM‐2 algorithm with a threshold of 6.5. For data centralization we used the legacy method with a threshold of 6 and a bin size of ten probes. For filtering aberrations we considered regions with a minimum of 250 probes and a minimum absolute mean log 2ratio of 0.45.
Results
Cell capture
We tested the Parsortix™ system's capability for epitope independent separation by performing spiking experiments with different cell numbers (10, 50 and 100; n = 4 for each spike level) from the cultured cancer cell lines PANC‐1, PC3, A375, A549 and T24. Prelabeled cells were spiked into healthy blood to test capture within the cassette. Figure 2a shows examples of captured cells (indicated by arrow) analyzed by bright field and fluorescence microscopy. Average captured cell counts are illustrated in Figure 2b, whereas average cell capture percentages are shown in Figure 2c. Average percentage of cell capture rates ranged from 42% (T24) to 70% (PANC‐1). It is apparent from Figure 2b that there is a clear correlation between the number of cells spiked into the blood and the number captured for all cell lines tested in these experiments. One cell line, T24, had a noticeably lower capture rate than the other cell lines examined. This difference provided an opportunity to investigate the basis of the capture mechanism, starting with the possibility of cell size. Cell size data are presented in Figure 2d, which shows the distribution of individual Feret diameters of cells captured in the cassette. (References in the literature to the sizes of cultured cells tend to state dimensions while cells are attached to plastic culture plates. However, for our experiments it was more relevant to consider the sizes of cells while in liquid suspension.) Figure 2d compares the distributions of sizes in the two cell lines that showed the highest and lowest capture rates, PANC‐1 and T24 respectively. We observed a difference in the sizes of these two cell lines, the mean Feret diameter of PANC‐1 being 23 µm and that of T24 being 18 µm. We address the significance of these cell size measurements in the Discussion.
Figure 2.
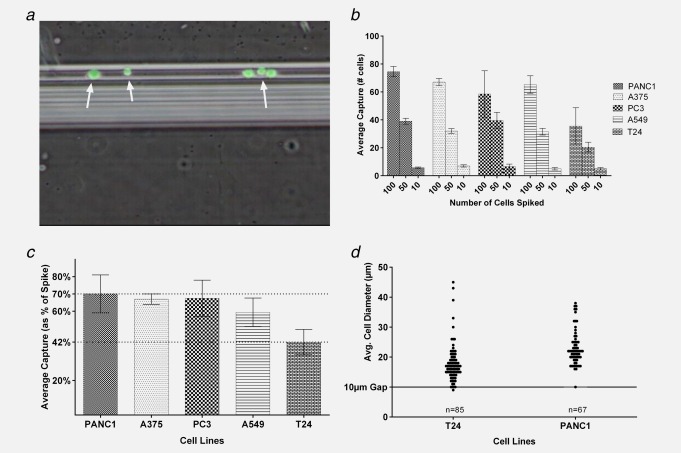
Quantification of cell capture and cell size. (a) Combined fluorescence and bright field micrograph of CFSE prelabeled cells (green) of the PC‐3 line captured on the separation structure in the device. (b) Average numbers of cultured cells captured in separations of blood spiked with 100, 50 or 10 cells. Minimum of four repeats performed for each number of cells spiked. All error bars are ±one standard deviation. (c) Average cell capture rates, expressed as percentage of cells spiked. Cell capture data from all repeats of all three spike levels are combined for each of the five cell lines. (d) Distribution of diameters of T24 and PANC1 cells. Average diameters of single cells (n = 85 for T24, n = 67 for PANC1) were calculated as Feret values from several measurements of each cell using ImageJ software. Note the line representing the 10 µm gap size of the device.
Harvesting of tumor cells
One of the novel and powerful capabilities that distinguishes the device is that it enables easy harvest of captured tumor cells for further downstream analyses. Figure 3a shows the average number of prelabeled cells harvested from the device, expressed as the percentage of captured cells. Harvest efficiency ranged from an average of 54% (T24) to 69% (A375). Figure 3b shows the harvest data from all separations of all the cell types, combined and presented as a frequency distribution (n = 66). The peak harvest rate falls between 60% and 70% of cells captured, with a mean rate of 64% for the combined data set, and a range between 20% and 100%.
Figure 3.
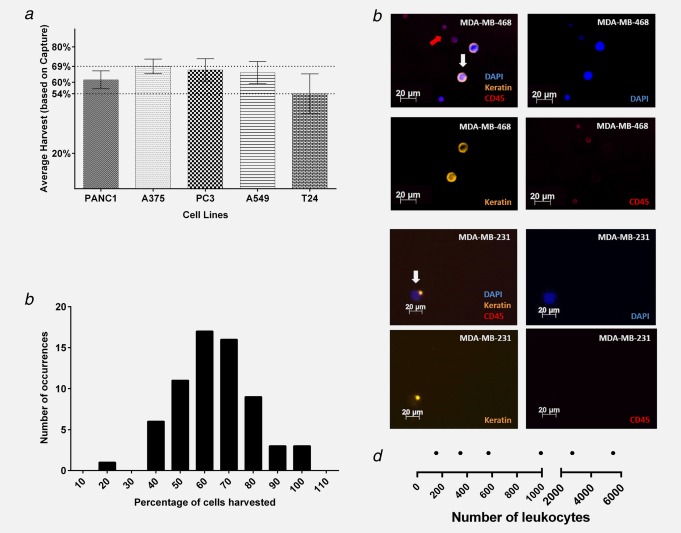
Cell harvesting efficiency. (a) Average cell harvests, expressed as percentages of cells captured for PANC1 (n = 12), A375 (n = 12), PC‐3 (n = 25), A549 (n = 12) and T24 (n = 12). Counts of CFSE‐labeled fluorescent cells successfully removed from the device subsequent to separation and capture. The lines at 70% and 42% are the absolute ranges of percent capture in individual experiments. (b) Frequency distribution of percentages of cells harvested. (c) Representative images of tumor cells (MDA‐MB‐468 and MDA‐MB‐231) and contaminating leukocytes after harvesting and immune staining. Four panels showing composite and separate fluorescent channels for each type of staining, as noted on the images: DAPI, Keratin and CD45. (d) Numbers of nucleated blood cells present in harvest eluents. Graphical summary of numbers of nucleated blood cells present in the harvest eluent from six experiments. The numbers of eluted nucleated cells range from less than 200 to in excess of 5,000. The split scale on the diagram, and four of the six data points are below 1,000 residual cells.
In clinical samples, tumor cells cannot be prelabeled and hence have to be identified using tumor specific staining. To test the efficacy of harvesting and subsequent immunostaining, 30 tumor cells of the MDA‐MB‐468 and MDA‐MB‐231 lines were spiked into 4 mL of blood, separated using Parsortix™, harvested, then cytospun (to secure the cells on a glass slide) and stained for keratins as tumor cell identifying markers. CD45 staining was included to identify residual nucleated blood cells. DAPI was used for nuclear counterstain. Using this approach, the numbers of identified target cells harvested from the cassette ranged from 27% to 40% of the cells originally spiked (9–12 out of 30 cells, n = 6; 3 per cell line). Representative images of spiked tumor cells and residual leukocytes are illustrated in Figure 3c.
Sample Purity
The device has a flow‐through design providing a separation process that eliminates most of the blood material. Given that there are approximately 5 × 10⁹ erythrocytes and 106 leukocytes per ml of whole blood, the purification achieved represents many orders of magnitude. Nevertheless, a residual level of nucleated blood cells remain in the device at the end of separation, as demonstrated by postharvest cell counts (n = 6), the range is shown in Figure 3d.
Biological status of harvested cells
To assess viability after capture and subsequent harvest of cells, we used a live/dead cell cytotoxicity assay. We counted cells that were either fluorescing both blue and green (i.e. Hoechst 33342 and viable indicator dye) or both blue and red (i.e. Hoechst 33342 and nonviable indicator dye). Representative images of viable and nonviable cells are illustrated in Figures 4a and 4b. The quantitative data in Figure 4c shows that in several experiments 99% of cells were viable, confirming that the processes of capture and harvest have a negligible impact on cell viability.
Figure 4.
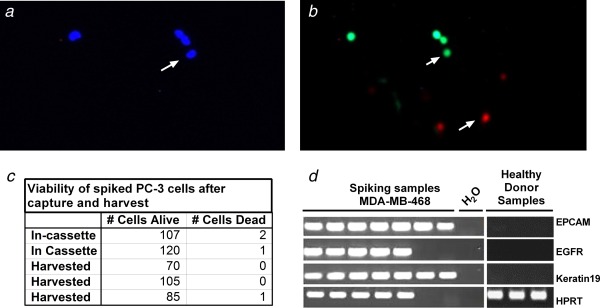
Viability of captured and harvested cells. (a) and (b) Photomicrographs of harvested cells subjected to fluorescence‐based Live/Dead viability assay. (a) Hoechst nuclear staining for cell identification. (b) Green fluorescence identifies live cells; red fluorescence identifies dead cells. (c) Table of numbers of live and dead cells following separation in five experiments (two showing numbers within cassette, three showing numbers following harvest). (d) Ethidium bromide stained agarose gel image to visualize the PCR products in analysis of mRNA, negative control as water and RNA from leucocytes of three healthy individuals.
Further information on the biological status of harvested cells is provided by mRNA data. The gel electrophoresis image presented as Figure 4d shows that mRNA‐based PCR analysis detected specific signals for all markers in five samples. Two of the four messages were not detected in two of the cell preparations. This mRNA expression data additionally supports conclusion previously made by live/dead staining that cells remain alive after the ParsortixTM separation process. Collectively, the viability assays and mRNA analysis indicate that harvested cells are biologically intact and suitable for culture and molecular analysis.
CTC capture from clinical samples
To demonstrate the clinical validity of the Parsortix™ system, we separated blood samples of 26 metastatic and nonmetastatic cancer patients (Supporting Information Table 1). The CellSearch® system was used in parallel for method comparison (Parsortix™ system: 4 mL of blood, CellSearch®: 7.5 mL of blood).
For separations made on the Parsortix™ system, clinical samples were collected into CellSave® preservative tubes, processed by Parsortix ™ harvested, cytospun and stained for keratins, DAPI and CD45. Representative images of CTCs and a CTC cluster (that was present in blood of one colorectal cancer patient) are illustrated in Figures 5a and 5b.
Figure 5.
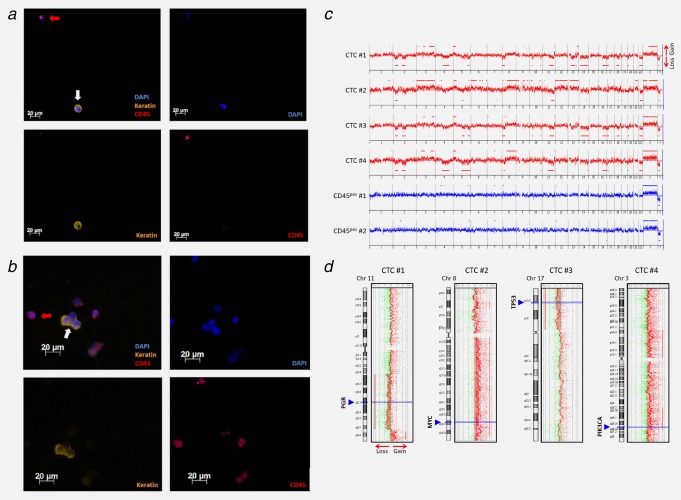
Identification of CTCs captured and harvested by Parsortix™ system, using immunofluorescence staining and downstream molecular characterization of harvested patient CTCs via array‐based comparative genomic hybridization (aCGH). CTCs from an additional metastatic breast cancer patient (CTC count Parsortix™: 10) were identified as keratin‐positive, DAPI‐positive and CD45‐negative events (white arrows). Leukocytes are indicated by red arrows (DAPI‐positive, CD45‐positive and keratin‐negative). (a) shows single CTCs captured by the device whereas a CTC cluster is illustrated in (b). (c) CNA‐patterns of the CTCs were typical for a metastasized breast cancer, presenting gain at 8q and losses at 11q, 16q and 17p. (d) some of the identified CNAs also affected different cancer‐related genes such as MYC, PIK3CA, TP53 and PGR.
Supporting Information Table 1 presents the numbers of CTCs captured by the two systems in comparative separations of samples from common donors. The table shows absolute CTC counts for each system (from 4 mL with Parsortix™ and 7.5 mL with CellSearch®), together with the counts normalized for the sample volumes (expressed as cells per ml). In this table, the cell numbers cited for CellSearch® are those captured, whereas numbers cited for Parsortix™ are those captured then harvested from the device.
Of the 26 patient blood samples, 4 samples had CTCs only detectable by Parsortix™. 11 patients were negative by Parsortix™ and CellSearch®, whereas 6 had CTCs detected by both. Five patients harboured CTCs only detectable by CellSearch®. Of the samples where CTCs were only detectable by CellSearch®, 3 of the 5 had only a single cell detected in each sample from 7.5 mL of blood. The ranges of CTC counts were 0–26 in 4 mL (0–6.5 per ml) for Parsortix ™ and 0–250 in 7.5 mL (0–33 per ml) for CellSearch®. As a control, ten blood samples from healthy individuals were screened and no CTC‐like events were found in those samples. A Wilcoxon matched pairs test performed on normalized counts yielded a p values of 0.5699 which indicates no statistically significant difference between the quantitative behavior of Parsortix™ and CellSearch® systems in this set of twenty six paired separations.
Array‐based comparative genomic hybridization
To confirm the malignant nature of the CTCs captured by the Parsortix™ device, four single cells from an additional metastatic breast cancer patient, who was positive for ten CTCs, were analyzed by aCGH. This patient was not screened for CTCs by CellSearch® since we wanted to prove the malignant nature of CTCs captured by the novel device. We performed aCGH experiments to screen for copy number alterations (CNAs). All cells displayed CNAs, while no relevant alterations were observed in the two analyzed CD45‐positive cells (leukocytes) isolated from the same patient sample (Figs. 5c and 5d). The CNA‐patterns of the CTCs were typical for a metastasized breast cancer, presenting gain at 8q and losses at 11q, 16q and 17p.25, 26 Of note, some of the identified CNAs also affected different cancer‐related genes such as MYC, PIK3CA, TP53 and PGR (Fig. 5d). As expected for advanced systemic breast cancer, several aberrations were shared by the different CTCs indicating their clonal relationship.
Discussion
Our results demonstrate that the Parsortix™ system efficiently captures and harvests intact and viable tumor cells from peripheral blood samples from a variety of different tumor types. Furthermore, in spiking experiments, we could show that cells are still functional for further molecular characterization. In spiking experiments, average percentages of cells captured inside the cassette ranged between 42% and 70% in individual runs. Average yields of cells subsequently harvested from the cassette ranged between 54% and 69%. These capture and harvest values were achieved even with low spiking levels (10–100 cells in up to 4 mL of blood). Note that the range of capture levels reflects differences between individual cell types; capture levels are consistent for repeated experiments with any single cell line.
Other microfluidic cell separation technologies have been reported with higher proportions of cell capture for certain EpCAM‐positive cell types.16, 17, 18 However, these cell capture devices are usually based on epitope selection. Epitope dependent cell separation methods fail to perform when presented with the task of capturing cells which have low or no expression of the target antigen.18 To test Parsortix™ system's ability with cells having low expression of target antigen we used a marginal EpCAM expressing cancer cell line MDA‐MB‐231 and performed three experiments with 30 cells spiked each time; recovery rates were 27%, 30% and 30%, respectively. We were able to recover higher tumor cell numbers than reported for CellSearch®,18, 27 indicating an improved detection rate for marginal EpCAM expressing tumor cells (Parsortix™: 27% ‐ 30% and CellSearch®: 10–15%).
Size‐based enrichment strategies using size exclusion filters have also been used and are reported to detect single tumor cells in one ml of blood.28 Although the membrane filter devices seem to detect CTCs with a comparable high recovery rate, this enrichment procedure is hampered by the fact that leukocytes can block the filter pores. Moreover, even if CTCs are caught on the filters, cells are fixed and hence not viable and are difficult to detach for further molecular examination.
To improve on conventional size‐based systems, the Parsortix™ system was developed not only to introduce affinity independent technology, but also to create a system free of the drawbacks and deficiencies of conventional fibrous and porous filters. Here, we demonstrated that the levels of residual nucleated blood cells present in harvest eluents are very low, usually ranging from 1,000–2,000 cells. Whether these residual cells have an influence on downstream molecular analysis in turn depends upon the type of technique to be used. Depending on the ratio of target to residual cells, the presence of blood cells may make some techniques more demanding to use, but will be suitable for others. However, there is no CTC assay worldwide that enriches CTCs with 100% purity. Even the FDA‐approved CellSearch® technology enriches CTCs with thousands of contaminating leukocytes that do not disturb the assay and most publications do not mention this issue. Patients with hematological malignancies can have highly increased leukocytes counts, different viscosity and leukocyte properties than healthy individuals. In contrast, patients with solid tumors like the ones analyzed in our study have usually normal blood cell or slightly decreased blood cell counts (depending on their stage and treatment). Thus, the background of leukocytes used in our spiking experiments is probably not higher in carcinoma patients, which supports that our model findings are trustworthy.
Our data furthermore confirms that some cells of interest, as expected, are captured at different rates. Cell size data presented in Figure 2d, shows the distribution of individual Feret diameters of cells captured in the device. The figure compares the distributions of sizes in the two cell lines that showed the highest and lowest capture rates, PANC‐1 and T24 respectively (Figs. 2b and 2c). There is a difference in the sizes of these two cell lines, the mean Feret diameter of PANC‐1 being 23 µm and that of T24 being 18 µm. The cell sizes therefore do reflect the differences in capture rate, the larger cell type being captured more effectively than the smaller one. However, close examination of the cell size distributions illustrated in Figure 2d reveals that no cells in either of these populations are smaller than the 10 µm critical gap size of the device. This strongly suggests that cell size cannot fully explain the difference in capture between these two lines; there must be other factors involved. It has been reported29, 30, 31 that cell types differ in their deformability under mechanical stress. Separation on the basis of a combination of size and deformability can consequently explain the results we have observed. Cassettes can be designed with different sizes of critical gap selected to accommodate the size and deformability combinations of target cells in specific circumstances. The gap size of 10 µm used in these experiments was selected on the basis of its versatility in capturing cells with a wide range of sizes and deformabilities.
It is expected that some cell loss occurs as a consequence of downstream processing which includes cell handling steps, cell washes and so forth As a result, different CTC isolation techniques may have variable yields.2, 15, 32 Relevant to the results presented here we think that some cell loss may be attributed to downstream processing, for example Cytospin centrifugation. Furthermore, antibody incubation steps and washing procedures are thought to cause detachment of cells from glass slides.
Blood and target cell preservation is an important factor in CTC isolation methods. Tests of CellSave® Preservative Tubes demonstrated that long‐term sample storage (up to 4 days) is possible when using CellSave® Preservative Tubes in combination with Parsortix™, which is not the case for certain other size‐based devices that are currently available. Compatibility with CellSave® was an important requirement for meaningful comparison of the Parsortix™ system with CellSearch®.
There was no statistically significant difference in overall cell capture between the Parsortix™ and CellSearch® systems across this set of twenty six paired separations. However, there were clear differences in numbers of CTCs isolated by the two systems in some specific samples. Of the ten samples that were positive for CTCs with Parsortix™, four samples (40%) were negative with CellSearch®. Of the six samples that were positive with both systems, one sample (17%) had 8× more CTCs with Parsortix™ than CellSearch®. This could reflect differences in the cell capture mechanisms of the respective platforms. The EMT condition of the CTC populations in these samples is not known, but CTC populations captured by the Parsortix™ system should contain both epithelial and mesenchymal cells. Modifications of methods currently under development are increasing levels of cell capture, harvest and separation speed obtained with the Parsortix™ system further.
Crucially, the Parsortix™ system provides easy accessibility to viable CTCs, in liquid suspension, enabling further molecular and functional characterization. The use of viable CTCs has already been applied to establish humanized (CTC‐derived) xenograft models for functional characterization of CTCs.33, 34 Future studies are needed to show if CTCs captured by Parsortix™ might also be used to culture and explant human derived CTCs for further in vitro and in vivo characterization.
The Parsortix™ system is a promising novel platform for harvesting of CTCs for analysis. This system overcomes hurdles of other techniques since it: (i) is not dependent on antibody affinity; (ii) provides CTCs in vitro and (iii) generates high purity CTC samples with low numbers of residual blood cells. Using this system, viable tumor cells are easily accessible and ready for molecular and functional analysis such as aCGH. aCGH has been wideliy used to study single cells/CTCs.24, 35, 36 We performed aCGH analyses from single CTCs and single leukocytes (which were processed identically) to show that (i) CTCs detected by Parsortix™ harbor chromosomal aberrations and (ii) that the WGA does not introduce amplification bias. Our results did not show any aberrations in the leukocytes, demonstrating the specificity of the WGA.
Furthermore, we tested the applicability of PCR in combination with the Parsortix™ system (Fig. 4d). A PCR‐based approach in combination with the Parsortix™ system was also recently presented describing the applicability of CTC mRNA detection in combination with this device.37
The system's ability for enumeration and molecular characterization of EpCAM‐negative CTC‐subpopulations will help to further the understanding of the mechanisms of cancer biology as well as facilitating the use of CTCs as “liquid biopsies.” The potential of the Parsortix™ system extends beyond the field of cancer. It also has applications in isolation of fetal cells from maternal blood and multiple clinical applications.
Supporting information
Supporting Information Table 1.
Supporting Information Video 1.
Supporting Information Video 2.
Footnotes
The term “recovery” is used by some to mean capture of cells and by others to describe extraction of cells for analysis. Instead, we use the terms “capture” meaning capturing target cells inside the cassette, and “harvesting” meaning capture and subsequent recovery of captured cells from the cassette for analysis.
Parsortix™ system is CE Marked for clinical use in Europe and an application to FDA for authorization in the USA has been filed.
References
- 1. Ashworth TR. A case of cancer in which cells similar to those in the tumors were seen in the blood after death. Aust Med J 1869;14:146–9. [Google Scholar]
- 2. Alix‐Panabières C, Pantel K. Circulating tumor cells: liquid biopsy of cancer. Clin Chem 2013;59:110–8. [DOI] [PubMed] [Google Scholar]
- 3. Alix‐Panabières C, Schwarzenbach H, Pantel K. Circulating Tumor Cells and Circulating Tumor DNA. Annu. Rev. Med 2012;63:199–215. [DOI] [PubMed] [Google Scholar]
- 4. Yu M, Stott S, Toner M, et al. Circulating tumor cells: approaches to isolation and characterization. J Cell Biol 2011;192:373–82. [DOI] [PMC free article] [PubMed] [Google Scholar]
- 5. Gorges TM, Pantel K. Circulating tumor cells as therapy‐related biomarkers in cancer patients. Cancer Immunol Immunother 2013;62:931–9. [DOI] [PMC free article] [PubMed] [Google Scholar]
- 6. Parkinson DR, Dracopoli N, Gumbs Petty B, et al. Considerations in the development of circulating tumor cell technology for clinical use. J Transl Med 2012;10:138. [DOI] [PMC free article] [PubMed] [Google Scholar]
- 7. Bidard F‐C, Peeters DJ, Fehm T, et al. Clinical validity of circulating tumour cells in patients with metastatic breast cancer: a pooled analysis of individual patient data. Lancet Oncol 2014;15:406–14. [DOI] [PubMed] [Google Scholar]
- 8. Cohen SJ, Punt CJA, Iannotti N, et al. Relationship of circulating tumor cells to tumor response, progression‐free survival, and overall survival in patients with metastatic colorectal cancer. J Clin Oncol 2008;26:3213–21. [DOI] [PubMed] [Google Scholar]
- 9. de Bono JS, Scher HI, Montgomery RB, et al. Circulating tumor cells predict survival benefit from treatment in metastatic castration‐resistant prostate cancer. Clin Cancer Res 2008;14:6302–9. [DOI] [PubMed] [Google Scholar]
- 10. Rack B, Schindlbeck C, Jückstock J, et al. Circulating tumor cells predict survival in early average‐to‐high risk breast cancer patients. J Natl Cancer Inst 2014;106: [DOI] [PMC free article] [PubMed] [Google Scholar]
- 11. Cristofanilli M, Budd G. Circulating tumor cells, disease progression, and survival in metastatic breast cancer. Engl J 2004; 781–91. [DOI] [PubMed] [Google Scholar]
- 12. Hou JM, Krebs MG, Lancashire L, et al. Clinical significance and molecular characteristics of circulating tumor cells and circulating tumor microemboli in patients with small‐cell lung cancer. J Clin Oncol 2012;30:525–32. [DOI] [PubMed] [Google Scholar]
- 13. Guetta E, Gutstein‐Abo L, Barkai G. Trophoblasts isolated from the maternal circulation: in vitro expansion and potential application in non‐invasive prenatal diagnosis. J Histochem Cytochem 2005;53:337–9. [DOI] [PubMed] [Google Scholar]
- 14. Ozkumur E, Shah AM, Ciciliano JC, et al. Inertial focusing for tumor antigen‐dependent and ‐independent sorting of rare circulating tumor cells. Sci Transl Med 2013;5:179ra47 [DOI] [PMC free article] [PubMed] [Google Scholar]
- 15. Vona G, Beroud C, Benachi A, et al. Enrichment, immunomorphological, and genetic characterization of fetal cells circulating in maternal blood. Am J Pathol 2002;160:51–8. [DOI] [PMC free article] [PubMed] [Google Scholar]
- 16. Maheswaran S, Sequist LV, Nagrath S, et al. Detection of mutations in EGFR in circulating lung‐cancer cells. N Engl J Med 2008;359:366–77. [DOI] [PMC free article] [PubMed] [Google Scholar]
- 17. Nagrath S, Sequist LV, Maheswaran S, et al. Isolation of rare circulating tumour cells in cancer patients by microchip technology. Nature 2007;450:1235–9. [DOI] [PMC free article] [PubMed] [Google Scholar]
- 18. Harb W, Fan A, Tran T, et al. Mutational Analysis of Circulating Tumor Cells Using a Novel Microfluidic Collection Device and qPCR Assay. Transl Oncol 2013;6:528–38. [DOI] [PMC free article] [PubMed] [Google Scholar]
- 19. Kasimir‐Bauer S, Hoffmann O, Wallwiener D, et al. Expression of stem cell and epithelial–mesenchymal transition markers in primary breast cancer patients with circulating tumor cells. Breast Cancer Res 2012;14:R15 [DOI] [PMC free article] [PubMed] [Google Scholar]
- 20. Pratt ED, Huang C, Hawkins BG, et al. Rare cell capture in microfluidic devices. Chem Eng Sci 2011;66:1508–22. [DOI] [PMC free article] [PubMed] [Google Scholar]
- 21. Desitter I, Guerrouahen BS, Benali‐furet N, et al. A new device for rapid isolation by size and characterization of rare circulating tumor cells. Anticancer Res 2011;31:427–41. [PubMed] [Google Scholar]
- 22. Wilding P, Kricka LJ, Cheng J, et al. Integrated cell isolation and polymerase chain reaction analysis using silicon microfilter chambers. Anal Biochem 1998;257:95–100. [DOI] [PubMed] [Google Scholar]
- 23. Möhlendick B, Bartenhagen C, Behrens B, et al. A robust method to analyze copy number alterations of less than 100 kb in single cells using oligonucleotide array CGH. PLoS One 2013;8: [DOI] [PMC free article] [PubMed] [Google Scholar]
- 24. Mohlendick B, Stoecklein NH. Analysis of copy‐number alterations in single cells using microarray‐based comparative genomic hybridization (aCGH). Curr Protoc Cell Biol 2014;65:21–2. [DOI] [PubMed] [Google Scholar]
- 25. Baudis M, Cleary ML. Progenetix.net: an online repository for molecular cytogenetic aberration data. Bioinformatics 2001;17:1228–9. [DOI] [PubMed] [Google Scholar]
- 26. Neves RPL, Raba K, Schmidt O, et al. Genomic high‐resolution profiling of single CKpos/CD45neg flow‐sorting purified circulating tumor cells from patients with metastatic breast cancer. Clin Chem 2014;60:1290–7. [DOI] [PubMed] [Google Scholar]
- 27. Sieuwerts AM, Kraan J, Bolt J, et al. Anti‐epithelial cell adhesion molecule antibodies and the detection of circulating normal‐like breast tumor cells. J Natl Cancer Inst 2009;101:61–6. [DOI] [PMC free article] [PubMed] [Google Scholar]
- 28. Vona G, Sabile A, Louha M, et al. Isolation by size of epithelial tumor cells: a new method for the immunomorphological and molecular characterization of circulatingtumor cells. Am J Pathol 2000;156:57–63. [DOI] [PMC free article] [PubMed] [Google Scholar]
- 29. Harouaka R, Nisic M, Zheng S. Circulating tumor cell enrichment based on physical properties. J Lab Autom 2013;18:1–24. [DOI] [PMC free article] [PubMed] [Google Scholar]
- 30. Mohamed H, Murray M, Turner JN, et al. Isolation of tumor cells using size and deformation. J Chromatogr A 2009;1216:8289–95. [DOI] [PubMed] [Google Scholar]
- 31. Zheng Y, Wen J, Nguyen J, et al. Decreased deformability of lymphocytes in chronic lymphocytic leukemia. Sci Rep 2015;5:7613. [DOI] [PMC free article] [PubMed] [Google Scholar]
- 32. Karabacak NM, Spuhler PS, Fachin F, et al. Microfluidic, marker‐free isolation of circulating tumor cells from blood samples. Nat Protoc 2014;9:694–710. [DOI] [PMC free article] [PubMed] [Google Scholar]
- 33. Baccelli I, Schneeweiss A, Riethdorf S, et al. Identification of a population of blood circulating tumor cells from breast cancer patients that initiates metastasis in a xenograft assay. Nat Biotechnol 2013;31:539–44. [DOI] [PubMed] [Google Scholar]
- 34. Hodgkinson CL, Morrow CJ, Li Y, et al. Tumorigenicity and genetic profiling of circulating tumor cells in small‐cell lung cancer. Nat Med 2014;20:897–903. [DOI] [PubMed] [Google Scholar]
- 35. Heitzer E, Auer M, Gasch C, et al. Complex tumor genomes inferred from single circulating tumor cells by array‐CGH and next‐generation sequencing. Cancer Res [Internet] 2013;73:2965–75. [DOI] [PubMed] [Google Scholar]
- 36. Gasch C, Bauernhofer T, Pichler M, et al. Heterogeneity of epidermal growth factor receptor status and mutations of KRAS/PIK3CA in circulating tumor cells of patients with colorectal cancer. Clin Chem 2013;59:252–60. [DOI] [PubMed] [Google Scholar]
- 37. Obermayr E, Maritschnegg E, Speiser P, Singer C, Schuster E, Holzer B, Danzinger S, Pecha N, Newland A, O'Brian M, Zeillinger R. Circulating rare cells enable highly efficient cancer detection. In: Proceedings of the 106th Annual Meeting of the American Association for Cancer Research. Philadelphia, PA: AACR, 2015.
Associated Data
This section collects any data citations, data availability statements, or supplementary materials included in this article.
Supplementary Materials
Supporting Information Table 1.
Supporting Information Video 1.
Supporting Information Video 2.