Abstract
Reporter proteins are essential tools in the study of biological processes and are employed to monitor changes in gene expression and protein levels. Luciferases are reporter proteins that enable rapid and highly sensitive detection with an outstanding dynamic range. Here we evaluated the usefulness of the 19 kDa luciferase NanoLuc (Nluc), derived from the deep sea shrimp Oplophorus gracilirostris, as a reporter protein in yeast. Cassettes with codon‐optimized genes expressing yeast Nluc (yNluc) or its destabilized derivative yNlucPEST have been assembled in the context of the dominant drug resistance marker kanMX. The reporter proteins do not impair the growth of yeast cells and exhibit half‐lives of 40 and 5 min, respectively. The commercial substrate Nano‐Glo® is compatible with detection of yNluc bioluminescence in < 50 cells. Using the unstable yNlucPEST to report on the rapid and transient expression of a heat‐shock promoter (PCYC1–HSE), we found a close match between the intensity of the bioluminescent signal and mRNA levels during both induction and decay. We demonstrated that the bioluminescence of yNluc fused to the C‐terminus of a temperature‐sensitive protein reports on its protein levels. In conclusion, yNluc and yNlucPEST are valuable new reporter proteins suitable for experiments with yeast using standard commercial substrate. © 2016 The Authors. Yeast published by John Wiley & Sons Ltd.
Keywords: bioluminescence, reporter, luciferase, gene expression, protein stability
Introduction
Reporter proteins are essential tools for both in vivo and in vitro experiments of biological processes. In their most fundamental form, the in vivo reporter proteins reflect on the expression of promoters and the levels of mRNA and proteins. For example, fusion of promoters or genes to the bacterial LacZ gene enables the detection of the expressed β‐galactosidase activity and has been essential in the study of many aspects of gene expression (Juers et al., 2012). However, although apparently simple, β‐galactosidase activity assays are time‐consuming and detection suffers from a poor dynamic range. Moreover, the enzyme is a large and stable tetrameric 1023 amino acid residues protein that, in the eukaryotic setting, takes time to translate and fold, making it a slow reporter for monitoring rapid changes of gene expression in yeast. Other examples of reporter proteins include fluorescent and bioluminescent proteins (Tsien, 1998; Wilson and Hastings, 1998). Both classes facilitate rapid detection by sensitive instruments, with bioluminescence outperforming fluorescent detection.
Bioluminescent luciferases have become popular as protein reporters, due to their high sensitivity and dynamic range and the ease and speed of using the detection instruments (Thorne et al., 2010). Examples include firefly (Photinus pyralis) luciferase (FFluc), Renilla reniformis luciferase (Rluc) and bacterial luciferases (lux operons) (de Wet et al., 1985; Lorenz et al., 1991; Engebrecht et al., 1983). FFluc is the most commonly used luciferase and produces green light in an ATP‐dependent reaction. In budding yeast (Saccharomyces cerevisiae), FFluc has been used successfully for gene fusions to report on transcriptional activity (Vieites et al., 1994). However, certain features make FFluc less than ideal as a reporter protein in yeast. First, it is a large multidomain protein of 61 kDa that takes time to express and exhibits slow turnover. Second, the protein denatures and form aggregates in vivo when cells are subjected to heat shock or other stressors that perturb protein homeostasis (proteostasis) (Nathan et al., 1997). Third, folding and reactivation of FFluc is highly dependent on the potentially limiting molecular chaperones Hsp40, Hsp70 and Hsp104 (Schröder et al., 1993; Glover and Lindquist, 1998). The tendency to aggregate and the chaperone‐dependent reactivation have made FFluc an important tool when studying proteostasis (Hartl and Hayer‐Hartl, 2002), yet the very same characteristics call for the evaluation of new and improved luciferases as reporter proteins in yeast.
Originally from the deep sea shrimp, Oplophorus gracilirostris (Inouye et al., 2000), NanoLuc (Nluc) is a novel engineered luciferase that is smaller (19 kDa) and more stable during denaturing conditions and changes in pH and temperature than FFluc and Rluc. It uses an imidazopyrazinone substrate (furimazine), commercialized as Nano‐Glo®, to produce a signal around 150‐fold brighter than FFluc in an ATP‐independent manner (Hall et al., 2012). Nluc was originally developed as a reporter protein for human cell lines (Hall et al., 2012) but has also been shown to function in bacteria (Loh and Proft, 2014). Yet the use of Nluc and its substrate in yeast has not been evaluated.
In this study, we have generated stable and destabilized Nluc genes codon‐optimized for yeast expression and report on the characteristics and usefulness of this novel and highly sensitive luciferase reporter in yeast.
Materials and methods
Yeast strains and plasmids
All S. cerevisiae strains and plasmids used in this study are listed in Tables 1 and 2, respectively. The strains are derivatives of BY4741 (Brachmann et al., 1998). CAY1015 is a meiotic segregant in the BY4741 background (Gowda et al., 2013) and CAY1259 was constructed by inserting mCherry in the HTB2 locus of CAY1015 (Keppler‐Ross et al., 2008). The yNlucPEST gene was synthesized codon‐optimized for expression in S. cerevisiae and subcloned into plasmids using PCR and homologous recombination in yeast. Details regarding plasmid construction are available upon request.
Table 1.
Yeast strains
Table 2.
Plasmids
| Plasmid | Description | Type | Reference/source |
|---|---|---|---|
| pAM09 | URA3 VC | CEN/ARS | This study |
| pAM10 | URA3 PCYC1–HSE–Nluc | CEN/ARS | This study |
| pCA873 | URA3 PSSA4–NlucPEST | CEN/ARS | This study |
| pCA955 | URA3 PCYC1‐HSE–NlucPEST | CEN/ARS | This study |
| pGA1 | URA3 PTEF1–GFP–yNluc | CEN/ARS | This study |
| pGA2 | URA3 PTEF1–Z–yNIuc | CEN/ARS | This study |
| pGA3 | URA3 PTEF1–EGFP–Ubc9ts–yNluc | CEN/ARS | This study |
| pGA4 | URA3 PTDH3–yNluc–EGFP–Ubc9ts | CEN/ARS | This study |
| pZJ–HSE2–26 | URA3 PCYC1‐HSE–LacZ | 2 µ | Slater and Craig (1987) |
Yeast media
Cells were grown in standard yeast peptone dextrose (YPD) or on ammonia‐based synthetic complete dextrose (SC) medium supplemented to support the growth of auxotrophic strains. The cells were grown at 30°C.
Bioluminescence determination
Nano‐Glo substrate (Promega GmbH, Germany) was diluted 1:100 with the supplied lysis buffer and mixed 1:10 with cells grown in SC in a white 96‐well plate. Bioluminescence was determined immediately, using an Orion II Microplate Luminometer (Berthold Technologies GmbH & Co. KG, Germany). Bioluminescence light units (BLU) are defined as the relative light units (RLU)/s of 1 ml cells at OD600 = 1.0. To monitor turnover, 1 mg/l cycloheximide (Sigma‐Aldrich, St. Louis, MO, USA) or 5 µm lactimidomycin (Merck‐Millipore) was added. For in vitro bioluminescence measurements, cells were subjected to glass bead lysis for 30 s in a bead beater and cell debris was removed by 10 min centrifugation at 1500 × g. Cell‐free lysates were diluted to a protein concentration of 0.05 mg/ml (Nanodrop, 280 nm) and mixed with cycloheximide before determining bioluminescence.
Determination of mRNA levels
RNA was extracted from cells grown in SC using a RiboPure™ RNA Purification Kit for Yeast (Ambion). cDNA was synthesized from DNase I‐treated RNA using Superscript® III Reverse Transcriptase (Invitrogen). qPCR was performed using KAPA SYBR® Fast Universal qPCR Kit (KAPA Biosystems), with primers specific for the yNlucPEST (ATGGTGTTACTGGTTGGCGTTTATG and GCACAAGCAGCAGGATGACGAT) and TAF10 transcripts (ATATTCCAGGATCAGGTCTTCCGTAGC and GTAGTCTTCTCATTCTGTTGATGTTGTTGTTG). Quantification was performed using the 2–ΔΔCt method (Livak and Schmittgen, 2001) and expression was normalized to TAF10 (Teste et al., 2009).
β‐Galactosidase activity determination
β‐Galactosidase activity was determined using N‐lauroyl‐sarcosine‐permeabilized cells (Kippert, 1995; Andréasson and Ljungdahl, 2004). After pre‐incubation of cells in 800 µl 0.2% w/v sodium N‐lauroyl‐sarcosine Z buffer (60 mm Na2HPO4, 40 mm NaH2PO4, 10 mm KCl, 1 mm MgSO4, 50 mm β‐mercaptoethanol, pH 7) at 30°C for 15 min, a 160 µl aliquot of 4 g/l o‐nitrophenyl‐β‐d‐galactopyranoside (ONPG) solution was added and the tubes were mixed by inversion. The reaction was stopped by the addition of 400 µl 1 m Na2CO3 and cell debris was removed by centrifugation. The absorbance of the supernatant was measured at 420 nm.
Fluorescence microscopy
Transformants of strain CAY1259 carrying plasmid pGA1 were grown to logarithmic phase and images were acquired using an Axiovert 200 M inverted fluorescence microscope (Carl Zeiss, Germany), Plan‐Apochromate × 63/1.4 oil DIC, DG4 light source (Sutter Instrument Novato, CA) equipped with Roper Cascade 1 K camera (Carl Zeiss) and SlideBook 6 software. Binning of 2 × 2 was used to acquire images that were processed using SlideBook Reader.
Flow‐cytometric determination of GFP signal
The growth medium of cells in logarithmic growth phase was removed and exchanged for phosphate‐buffered saline (PBS). Data were acquired on a FACS Calibur instrument (BD Biosciences) and average green fluorescent protein (GFP) signal was determined using FlowJo software.
Sedimentation assays
The sedimentation assay was adopted from Theodoraki et al. (2012). Briefly, cells were subjected to glass bead lysis and cell debris was removed by centrifugation at 700 × g in a table‐top centrifuge. The cleared lysate was centrifuged at 12 800 × g for 15 min to separate soluble and insoluble proteins.
Western blot analysis
Protein extracts were prepared from cells in logarithmic phase (Silve et al., 1991). Briefly, NaOH was added directly to the cultures to a final concentration of 0.37 m and the cells were incubated for 10 min on ice before the addition of trichloroacetic acid to a final concentration of 8.3%. After centrifugation and removal of the supernatant, the pellet was rinsed with 1 m Tris base and equal amounts of SDS‐solubilized protein were separated by SDS–PAGE and analysed by quantitative western blotting, using the Odyssey infrared imaging system (Li‐COR Biosciences). GFP signal (anti‐GFP, Sigma‐Aldrich; 1:10000) or Nanoluc signal (anti‐Nanoluc, Promega GmbH, Germany; 1:1000) was normalized to the Pgk1 signal (anti‐Pgk1, Life Technologies; 1:10000).
Results and discussion
Nanoluc reporters in yeast
To create a new gene reporter system based on Nluc for S. cerevisiae, we codon‐optimized its coding sequence for optimal expression in yeast (yNluc). The leucine codon CUG was omitted from the sequence to enable the future use of the reporter in Candida albicans, a yeast that non‐canonically reads the CUG codon as serine (White et al., 1995). Since turnover of the yNluc reporter in yeast cells was not known and this characteristic greatly impacts on the usefulness of the reporter to monitor rapid expression level changes, we also codon‐optimized a version of yNluc with a potentially destabilizing PEST sequence (yNlucPEST) (Marchal et al., 1998). The genes encoding yNluc and yNlucPEST were introduced into plasmids in the context of the dominant G418 resistance cassette kanMX to facilitate promoter fusion by direct genomic integration, using PCR and homologous recombination (Figure 1A).
Figure 1.
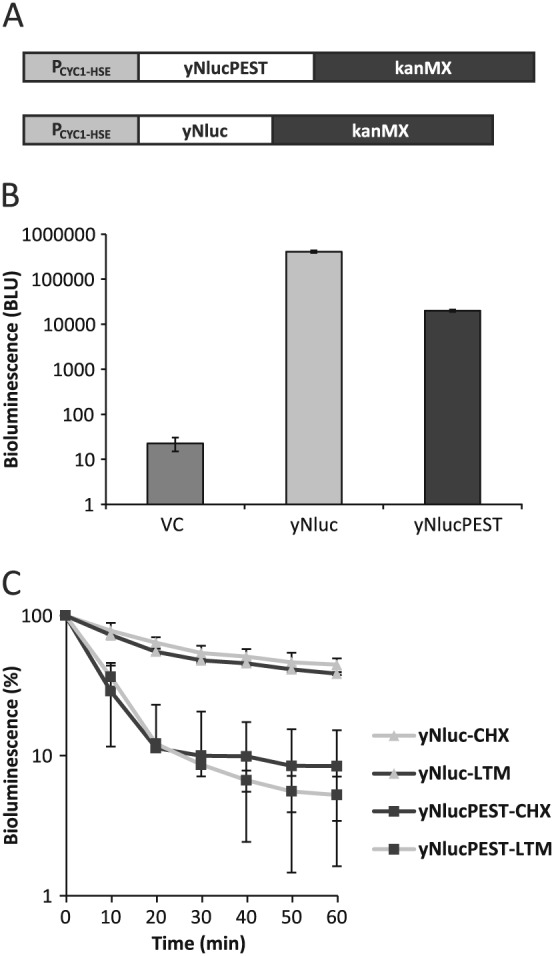
Expression of yNluc and yNlucPEST gene reporters in yeast. (A) Schematic representation of yNanoluc and yNlucPEST yeast codon‐optimized gene reporter cassettes designed for PCR amplification and integration into the yeast genome: a dominant G418 selection marker is provided by kanMX; for the purposes of this study, the minimal CYC1 promoter (PCYC1) fused to a heat shock element (HSE) drives the expression of each reporter variant. (B) Bioluminescence (bioluminescence light units, BLU) in cells carrying vector control (VC) or expressing yNluc or yNlucPEST; error bars represent SD (n = 3). (C) Turnover of yNluc and yNlucPEST bioluminescence following arrest of translation by cycloheximide (CHX) or lactimidomycin (LTM) addition; error bars represent SD (n ≥ 3)
To evaluate the usefulness of the reporters in yeast, we chose to drive the expression of yNluc and yNlucPEST from a widely used heat shock‐responsive promoter built from the core CYC1 promoter (PCYC1) and a heat shock element (HSE) from the Hsp70 gene SSA1 (Slater and Craig, 1987) (Figure 1A). While wild‐type cells (BY4741) growing at 30°C and carrying empty vector control (pAM09) emitted 22 (±7.64 SD) BLU upon addition of the Nano‐Glo® substrate, expression of yNluc (pAM10) or yNlucPEST (pCA955) resulted in 18000‐ and 900‐fold increases, respectively, of the bioluminescence (Figure 1B). Importantly, yNluc exhibited 20‐fold higher bioluminescence compared to yNlucPEST, consistent with the notion that the PEST sequence destabilizes the reporter protein in yeast.
We directly monitored the turnover of yNluc and yNlucPEST by arresting translation (cycloheximide/lactimidomycin) and followed the decay of bioluminescence. Consistent with the expression levels, the signal from yNluc was more stable over the time course than the signal from yNlucPEST, with half‐lives of 40 and 5 min, respectively (Figure 1C). Apparently, a small fraction of yNlucPEST escapes inactivation and accumulates over time to represent approximately 20% of the protein population. The half‐lives in yeast are generally shorter than what has been reported from expression in mammalian cells (Nluc did not exhibit turnover over 6 h and NlucPEST had a half‐life of 20 min) (Hall et al., 2012). The more stable yNluc accumulates to high levels and is potentially suitable for experiments that require sensitivity and a stable signal. In contrast, yNlucPEST facilitates the detection of rapid changes of reporter activity including its downregulation. Moreover, during our experiments we found that cycloheximide did not interfere with the bioluminescent activity in cell‐free lysates (see supporting information, Figure S1).
yNluc or yNlucPEST do not impair growth of yeast cells
We assessed whether yNluc and yNlucPEST expression is toxic to yeast cells. Growth measured in liquid medium over 24 h showed no difference in the growth rates of yNluc and yNlucPEST compared to VC (Figure 2A). Since PCYC1–HSE is a heat shock‐responsive promoter, cells were grown in 10‐fold dilution on solid medium at 25°C, 30°C and 37°C, to assess whether higher expression together with the additional proteotoxic stress that comes with an elevated temperatures impacts on growth. The reporters did not elicit growth inhibition at any temperature (Figure 2B). We conclude that yNluc and yNlucPEST do not impair the growth of yeast cells.
Figure 2.
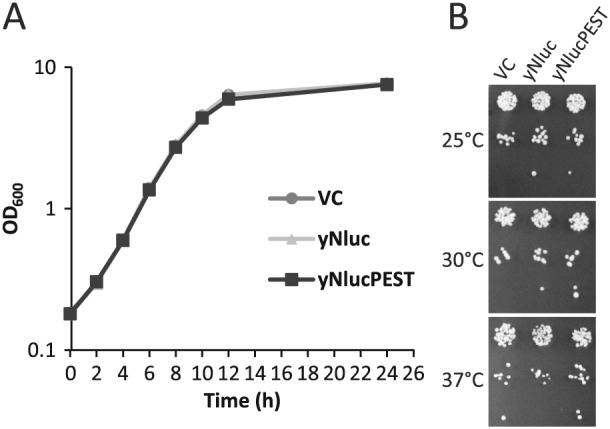
Growth characteristics of cells expressing yNluc or yNlucPEST. (A) Density (OD600) of cells growing in liquid medium carrying vector control (VC) or expressing yNluc or yNlucPEST. (B) Ten‐fold serial dilution of cells, as in (A), spotted onto solid growth medium and grown at the indicated temperatures
Sensitivity of yNluc or yNlucPEST bioluminescence
Sensitivity is crucial for a reporter system to obtain accurate measurements and to be able to monitor small changes with limited sample material. To test the sensitivity of yNluc and yNlucPEST, a serial dilution of Nano‐Glo® substrate was added to 107 cells. For both reporters the signal decreased linearly upon dilution of the substrate until reaching levels < 100 BLU, a value similar to the background signal detected in cells without the reporter (Figure 3A).
Figure 3.
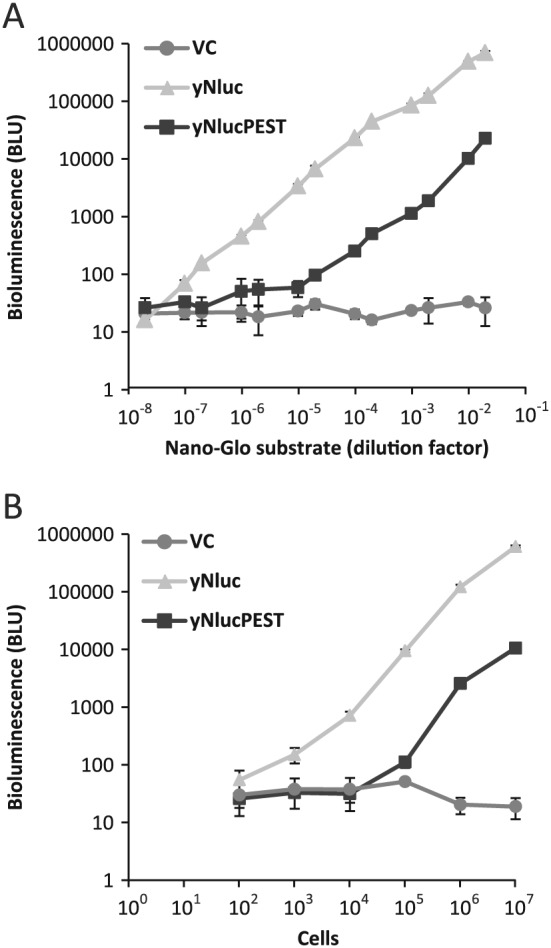
Sensitivity of the yNluc and yNlucPEST reporter. (A) Bioluminescence in 107 cells carrying VC or expressing yNluc or yNlucPEST with dilute Nano‐Glo® substrate. (B) Bioluminescence detected in 102–107 cells expressing yNluc or yNlucPEST. Error bars represent SD (n = 3) in both experiments
Serial dilution of cells expressing either reporter and bioluminescent detection using 10–3 dilution of the Nano‐Glo® substrate demonstrated that with the higher expression level of yNluc, 50 cells were sufficient to produce a signal higher than background (Figure 3B). The cell density was verified by plating. By increasing the amount of Nano‐Glo® substrate, this sensitivity can be increased further to monitor even fewer cells or reporters with lower expression levels.
yNlucPEST as a reporter for transient changes of gene expression
The study of rapid and transient change of gene expression depends on reporters that recapitulate both the induction and repression of transcript levels. We investigated how transcriptional variation translated to changes in yNlucPEST expression by simultaneously monitoring bioluminescence and mRNA levels by qPCR before, during and after transient heat shock. Strikingly, the bioluminescent signal faithfully followed the transiently induced mRNA levels of the reporter over the entire heat‐shock and recovery phases (Figure 4A). Arrest of translation by cycloheximide demonstrated that the rapid turnover of the reporter was not inhibited by the heat‐shock response (Figure 4B).
Figure 4.
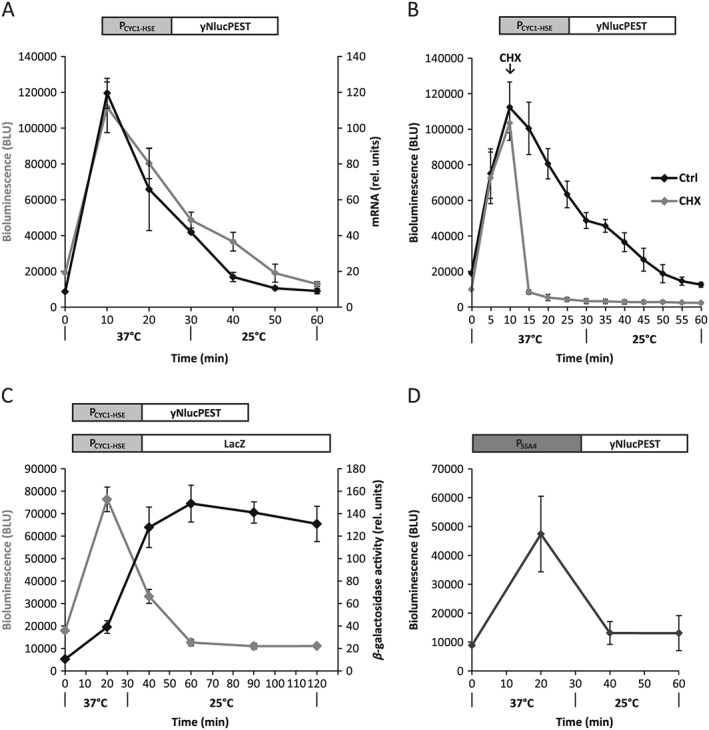
yNlucPEST as a reporter of rapid and transient changes of heat shock‐regulated gene expression. (A) yNlucPEST expression from a heat‐shock response promoter (PCYC1–HSE) upon acute heat shock (37°C) followed by recovery (25°C); bioluminescence (grey line) and mRNA levels (black line) were monitored simultaneously. (B) Bioluminesence measurements, as in (A), but cycloheximide (CHX, grey line) was added to arrest translation after 10 min of heat shock. (C) Comparison of expression from the heat‐shock response promoter (PCYC1–HSE) using yNlucPEST and LacZ as reporter genes. (D) Bioluminescence of yNlucPEST expressed from the endogenous Hsp70 (SSA4) promoter during transient heat shock; cells were grown at 25°C prior to heat shock and error bars represent SD (n = 9) in all experiments
LacZ has commonly been used to observe changes in gene regulation, including studies of the heat‐shock response (Ellwood and Craig, 1984; Nussbaum et al., 2014). However, the expressed β‐galactosidase is a tetrameric enzyme of 1024 amino acids that takes time to express and exhibits a half‐life of > 20 h (Bachmair et al., 1986). The low turnover of the reporter introduces an obstacle when measuring rapid downregulation of promoter activity. Using identical heat shock promoters to drive the expression of yNlucPEST (pCA955) and LacZ (pZJ–HSE2‐26), we directly compared the performance of the reporter genes before, during and after transient heat shock. While yNlucPEST in real‐time reported on the accumulation and decay of transcripts, the LacZ reporter signal accumulated slowly over 60 min to reach a stable plateau (Figure 4C). The data indicate that while LacZ is not a suitable reporter for studies of rapid and transient changes of gene expression, yNlucPEST is well‐suited for the purpose.
Finally, we tested yNlucPEST performance in the context of the endogenous promoter SSA4, a gene that expresses stress‐inducible Hsp70 (Werner‐Washburne et al., 1987). We fused the yNlucPEST to the SSA4 promoter (pCA873) and subjected transformed cells to a transient heat stress while measuring bioluminescence. The bioluminescent signal peaked 20 min following shift to elevated temperature and then returned to pre‐heat shock baseline values (Figure 4D). The behaviour of the reporter reproduces the transient induction characteristics following heat shock that have been established for SSA4 (Saavedra et al., 1996).
yNluc as a reporter to monitor protein levels
Fusion of activity tags to proteins facilitates the rapid determination of protein levels by directly monitoring the activity of the tag. This experimental approach potentially enables high‐throughput screening and reduces the variability associated with quantitative western blot analysis. To assess the usefulness of yNluc as an activity fusion tag in yeast (CAY1015), we initially tested an N‐terminal fusion of GFP to yNluc (GFP–yNluc; pGA1). Unexpectedly, the bioluminescence was reduced to 55% of the initial activity within 10 min following arrest of translation with cycloheximide (Figure 5A). The kinetics of loss of bioluminescence at later time points was slower, suggesting that the fusion protein populated at least two species. Importantly, loss of bioluminescence was not the result of protein degradation, since both GFP fluorescence (flow‐cytometry measurements) and protein levels (Western blotting) remained stable over the entire time‐course. A centrifugation‐based solubility assay was performed to investigate whether the loss of bioluminescence was due to aggregation of GFP–yNluc. The protein did not populate the pellet fraction before and 10 min after cycloheximide addition (Figure 5B). Consistent with this observation, GFP–yNluc localized evenly throughout the cytoplasm of yeast (Figure 5C). Summarizing the data for GFP–yNluc, the fusion protein is expressed as a soluble protein but a large fraction of the population rapidly loses its bioluminescence, presumably due to local unfolding that does not drive protein aggregation.
Figure 5.
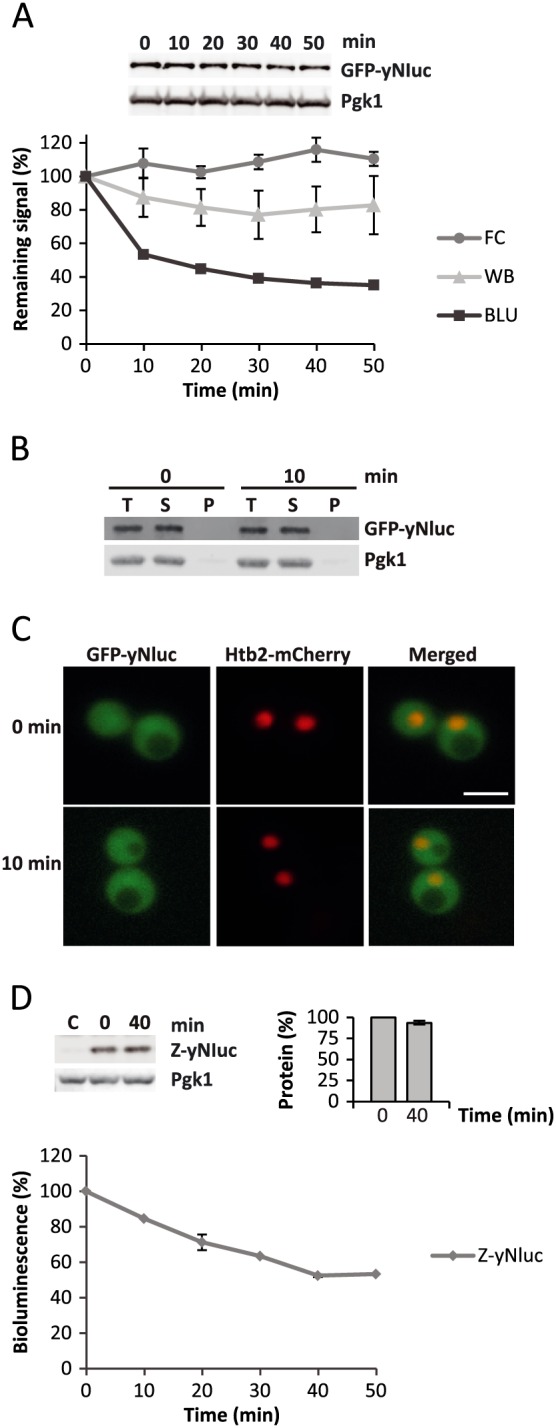
N‐terminal fusions to yNluc triggers rapid loss of specific bioluminescence. (A) Decay of GFP–yNluc bioluminescence (BLU), protein levels (Western blot, WB) and GFP fluorescence (flow cytometry, FC) following translation arrest by cycloheximide. (B) Solubility assay showing the total (T), soluble (S) and pellet (P) fractions of centrifuged samples (12 800 × g, 15 min) taken before and 10 min after cycloheximide addition. (C) Fluorescence microscopy of GFP–yNluc and nuclear histone 2B fused to mCherry (Htb2–mCherry) before and 10 min after cycloheximide addition; scale bar = 5 µm. (D) Decay of Z–yNluc protein levels by Western blotting (WB) and bioluminescence (BLU) following arrest of translation using cycloheximide; error bars indicate SD; n ≥ 3.
We considered the possibility that N‐terminal fusions to yNluc triggered the loss of specific bioluminescence. Indeed, when fusing the well‐folded triple α‐helical Z domain of Protein A (Samuelsson et al., 1994) to the N‐terminus of yNluc (Z–yNluc; pGA2), we again observed loss of bioluminescence without loss of protein (Figure 5D). Our data suggest that N‐terminal fusions to yNluc should be avoided when designing bioluminescent fusions that report on protein levels.
Next we decided to use the conditionally destabilized temperature‐sensitive protein EGFP–Ubc9ts to assess the applicability of yNluc fusions to monitor the protein levels. EGFP–Ubc9ts is a temperature‐sensitive protein that is stable and well‐folded at the permissive temperature of 30°C, but that misfolds and is degraded at the non‐permissive temperature of 37°C (Kaganovich et al., 2008). Again we observed that the N‐terminal fusion of EGFP–Ubc9ts to yNluc (EGFP–Ubc9ts–yNluc; pGA3) resulted in rapid loss of bioluminescence following translation arrest, even at the permissive temperature of 30°C (Figure 6A). In contrast, a C‐terminal fusion of EGFP–Ubc9ts to yNluc (yNluc–EGFP–Ubc9ts; pGA4) was well behaved and retained 80% of the bioluminescence over the entire time course of 40 min (Figure 6B). Upon temperature shift to the non‐permissive 37°C, the bioluminescence of yNluc–EGFP–Ubc9ts was reduced to 50% after 40 min of translation arrest. Importantly, assessment of yNluc–EGFP–Ubc9ts protein levels at time points 0 and 40 min after cycloheximide addition confirmed that loss of bioluminescence was the result of loss of protein (Figure 6C). To summarize the data, yNluc is a useful fusion reporter to monitor protein levels, but N‐terminal fusions display rapid loss of specific bioluminescence.
Figure 6.
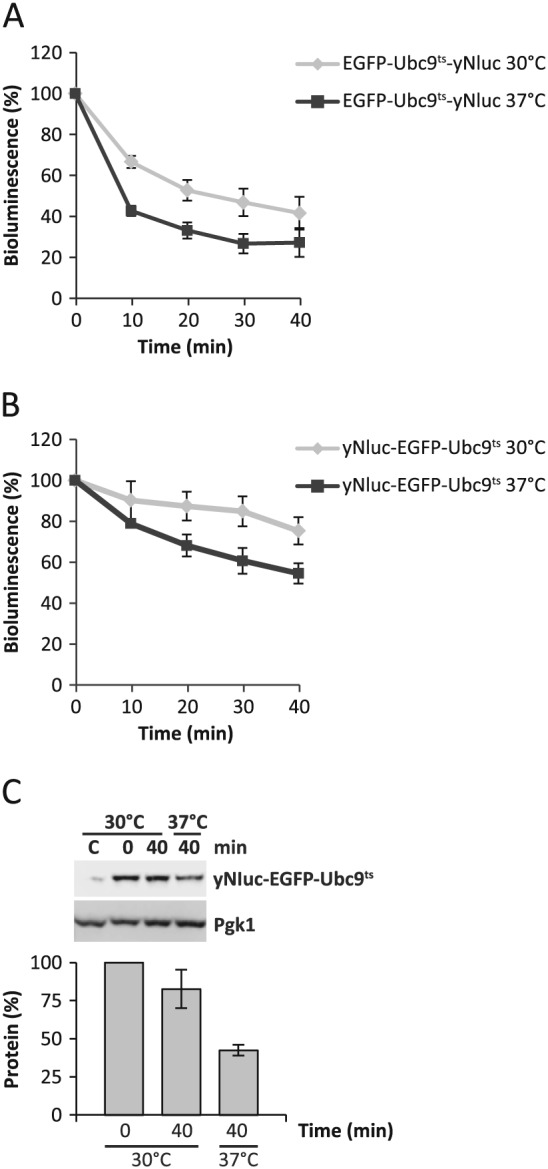
Bioluminescence of yNluc reports on the protein levels of C‐terminally fused EGFP–Ubc9ts. (A) Decay of EGFP–Ubc9ts–yNluc bioluminescence (BLU) at 30°C (permissive for Ubc9ts) and 37°C (non‐permissive for Ubc9ts) following translation arrest by cycloheximide. (B) Decay of yNluc–EGFP–Ubc9ts bioluminescence, as in (A). (C) Western blot analysis of yNluc–EGFP–Ubc9ts protein levels, as in (B); error bars indicate SD; n ≥ 3
Conclusion
The two luciferase variants yNluc and yNlucPEST, together with its commercially available substrate Nano‐Glo®, function as sensitive reporter systems in budding yeast. The destabilized yNlucPEST facilitates the construction of reporter fusions that faithfully reproduce rapid and transient changes of gene expression. Higher expression levels, sensitivity and the option of an activity fusion tag are offered by C‐terminal fusions to the more stable yNluc. Both yNluc and yNlucPEST are available fused to kanMX for PCR amplification and direct gene targeting by homologous recombination.
Supporting information
Relative bioluminescence (RLU) in cell‐free lysates prepared from yeasts that express yNluc or yNlucPEST
Acknowledgements
We acknowledge the Imaging Facility at Stockholm University (IFSU) for support with microscopy. This work was funded by a Swedish Cancer Society grant and Carl Tryggers Stiftelse för vetenskaplig forskning.
Masser, A. E. , Kandasamy, G. , Kaimal, J. M. , and Andréasson, C. (2016) Luciferase NanoLuc as a reporter for gene expression and protein levels in Saccharomyces cerevisiae . Yeast, 33: 191–200. doi: 10.1002/yea.3155.
References
- Andréasson C, Ljungdahl PO. 2004. The N‐terminal regulatory domain of Stp1p is modular and, fused to an artificial transcription factor, confers full Ssy1p–Ptr3p–Ssy5p sensor control. Mol Cell Biol 24: 7503–7513. [DOI] [PMC free article] [PubMed] [Google Scholar]
- Bachmair A, Finley D, Varshavsky A. 1986. In vivo half‐life of a protein is a function of its amino‐terminal residue. Science 234: 179–186. [DOI] [PubMed] [Google Scholar]
- Brachmann CB, Davies A, Cost GJ, et al. 1998. Designer deletion strains derived from Saccharomyces cerevisiae S288C: a useful set of strains and plasmids for PCR‐mediated gene disruption and other applications. Yeast 14: 115–132. [DOI] [PubMed] [Google Scholar]
- de Wet JR, Wood KV, Helinski DR, Deluca M. 1985. Cloning of firefly luciferase cDNA and the expression of active luciferase in Escherichia coli . Proc Natl Acad Sci U S A 82: 7870–7873. [DOI] [PMC free article] [PubMed] [Google Scholar]
- Ellwood MS, Craig EA. 1984. Differential regulation of the 70 k heat‐shock gene and related genes in Saccharomyces cerevisiae . Mol Cell Biol 4: 1454–1459. [DOI] [PMC free article] [PubMed] [Google Scholar]
- Engebrecht J, Nealson K, Silverman M. 1983. Bacterial bioluminescence – isolation and genetic analysis of functions from Vibrio fischeri . Cell 32: 773–781. [DOI] [PubMed] [Google Scholar]
- Glover JR, Lindquist S. 1998. Hsp104, Hsp70, and Hsp40: a novel chaperone system that rescues previously aggregated proteins. Cell 94: 73–82. [DOI] [PubMed] [Google Scholar]
- Gowda NKC, Kandasamy G, Froehlich MS, et al. 2013. Hsp70 nucleotide exchange factor Fes1 is essential for ubiquitin‐dependent degradation of misfolded cytosolic proteins. Proc Natl Acad Sci U S A 110: 5975–5980. [DOI] [PMC free article] [PubMed] [Google Scholar]
- Hall MP, Unch J, Binkowski BF, et al. 2012. Engineered luciferase reporter from a deep sea shrimp utilizing a novel imidazopyrazinone substrate. ACS Chem Biol 7: 1848–1857. [DOI] [PMC free article] [PubMed] [Google Scholar]
- Hartl FU, Hayer‐Hartl M. 2002. Protein folding – molecular chaperones in the cytosol: from nascent chain to folded protein. Science 295: 1852–1858. [DOI] [PubMed] [Google Scholar]
- Inouye S, Watanabe K, Nakamura H, Shimomura O. 2000. Secretional luciferase of the luminous shrimp Oplophorus gracilirostris: cDNA cloning of a novel imidazopyrazinone luciferase. FEBS Lett 481: 19–25. [DOI] [PubMed] [Google Scholar]
- Juers DH, Matthews BW, Huber RE. 2012. LacZ β‐galactosidase: structure and function of an enzyme of historical and molecular biological importance. Protein Sci 21: 1792–1807. [DOI] [PMC free article] [PubMed] [Google Scholar]
- Kaganovich D, Kopito R, Frydman J. 2008. Misfolded proteins partition between two distinct quality control compartments. Nature 454(1088): U36. [DOI] [PMC free article] [PubMed] [Google Scholar]
- Keppler‐Ross S, Noffz C, Dean N. 2008. A new purple fluorescent color marker for genetic studies in Saccharomyces cerevisiae and Candida albicans . Genetics 179: 705–710. [DOI] [PMC free article] [PubMed] [Google Scholar]
- Kippert F. 1995. A rapid permeabilization procedure for accurate quantitative determination of β‐galactosidase activity in yeast cells. FEMS Microbiol Lett 128: 201–206. [DOI] [PubMed] [Google Scholar]
- Livak KJ, Schmittgen TD. 2001. Analysis of relative gene expression data using real‐time quantitative PCR and the 2–∆∆Ct method. Methods 25: 402–408. [DOI] [PubMed] [Google Scholar]
- Loh JMS, Proft T. 2014. Comparison of firefly luciferase and NanoLuc luciferase for biophotonic labeling of group A Streptococcus . Biotechnol Lett 36: 829–834. [DOI] [PubMed] [Google Scholar]
- Lorenz WW, Mccann RO, Longiaru M, Cormier MJ. 1991. Isolation and expression of a cDNA encoding Renilla reniformis luciferase. Proc Natl Acad Sci U S A 88: 4438–4442. [DOI] [PMC free article] [PubMed] [Google Scholar]
- Marchal C, Haguenauer‐Tsapis R, Urban‐Grimal D. 1998. A PEST‐like sequence mediates phosphorylation and efficient ubiquitination of yeast uracil permease. Mol Cell Biol 18: 314–321. [DOI] [PMC free article] [PubMed] [Google Scholar]
- Nathan DF, Vos MH, Lindquist S. 1997. In vivo functions of the Saccharomyces cerevisiae Hsp90 chaperone. Proc Natl Acad Sci U S A 94: 12949–12956. [DOI] [PMC free article] [PubMed] [Google Scholar]
- Nussbaum I, Weindling E, Jubran R, et al. 2014. Deteriorated stress response in stationary‐phase yeast: Sir2 and Yap1 are essential for Hsf1 activation by heat shock and oxidative stress, respectively. Plos One 9: e111505. [DOI] [PMC free article] [PubMed] [Google Scholar]
- Saavedra C, Tung KS, Amberg DC, et al. 1996. Regulation of mRNA export in response to stress in Saccharomyces cerevisiae . Genes Dev 10: 1608–1620. [DOI] [PubMed] [Google Scholar]
- Samuelsson E, Moks T, Nilsson B, Uhlen M. 1994. Enhanced in vitro refolding of insulin‐like growth factor‐i using a solubilizing fusion partner. Biochemistry 33: 4207–4211. [DOI] [PubMed] [Google Scholar]
- Schröder H, Langer T, Hartl FU, Bukau B. 1993. DNAk, DNAj and GRPe form a cellular chaperone machinery capable of repairing heat‐induced protein damage. EMBO J 12: 4137–4144. [DOI] [PMC free article] [PubMed] [Google Scholar]
- Silve S, Volland C, Garnier C, et al. 1991. Membrane insertion of uracil permease, a polytopic yeast plasma‐membrane protein. Mol Cell Biol 11: 1114–1124. [DOI] [PMC free article] [PubMed] [Google Scholar]
- Slater MR, Craig EA. 1987. Transcriptional regulation of an Hsp70 heat‐shock gene in the yeast Saccharomyces cerevisiae . Mol Cell Biol 7: 1906–1916. [DOI] [PMC free article] [PubMed] [Google Scholar]
- Teste M, Duquenne M, Francois JM, Parrou J. 2009. Validation of reference genes for quantitative expression analysis by real‐time RT–PCR in Saccharomyces cerevisiae . BMC Mol Biol 10: 99. [DOI] [PMC free article] [PubMed] [Google Scholar]
- Thorne N, Inglese J, Auldl DS. 2010. Illuminating insights into firefly luciferase and other bioluminescent reporters used in chemical biology. Chem Biol 17: 646–657. [DOI] [PMC free article] [PubMed] [Google Scholar]
- Theodoraki MA, Nillegoda NB, Saini J, Caplan AJ. 2012. A network of ubiquitin ligases is important for the dynamics of misfolded protein aggregates in yeast. J Biol Chem 287: 23911–23922. [DOI] [PMC free article] [PubMed] [Google Scholar]
- Tsien RY. 1998. The green fluorescent protein. Annu Rev Biochem 67: 509–544. [DOI] [PubMed] [Google Scholar]
- Vieites JM, Navarrogarcia F, Perezdiaz R, et al. 1994. Expression and in vivo determination of firefly luciferase as gene reporter in Saccharomyces cerevisiae . Yeast 10: 1321–1327. [DOI] [PubMed] [Google Scholar]
- Werner‐Washburne M, Stone DE, Craig EA. 1987. Complex interactions among members of an essential subfamily of Hsp70 genes in Saccharomyces cerevisiae . Mol Cell Biol 7: 2568–2577. [DOI] [PMC free article] [PubMed] [Google Scholar]
- White TC, Andrews LE, Maltby D, Agabian N. 1995. The universal leucine codon CTG in the secreted aspartyl proteinase‐1 (Sap1) gene of Candida albicans encodes a serine in vivo . J Bacteriol 177: 2953–2955. [DOI] [PMC free article] [PubMed] [Google Scholar]
- Wilson T, Hastings JW. 1998. Bioluminescence. Annu Rev Cell Dev Biol 14: 197–230. [DOI] [PubMed] [Google Scholar]
Associated Data
This section collects any data citations, data availability statements, or supplementary materials included in this article.
Supplementary Materials
Relative bioluminescence (RLU) in cell‐free lysates prepared from yeasts that express yNluc or yNlucPEST


