Abstract
Background:
Traditional two-dimensional (2D) echocardiographic evaluation of tricuspid annulus (TA) dilation is based on single-frame measurements of the septolateral (S-L) dimension. This may not represent either the axis or the extent of dynamism through the entire cardiac cycle. In this study, we used real-time 3D transesophageal echocardiography (TEE) to analyze geometric changes in multiple axes of the TA throughout the cardiac cycle in patients without right ventricular abnormalities.
Materials and Methods:
R-wave-gated 3D TEE images of the TA were acquired in 39 patients undergoing cardiovascular surgery. The patients with abnormal right ventricular/tricuspid structure or function were excluded from the study. For each patient, eight points along the TA were traced in the 3D dataset and used to reconstruct the TA at four stages of the cardiac cycle (end- and mid-systole, end- and mid-diastole). Statistical analyses were applied to determine whether TA area, perimeter, axes, and planarity changed significantly over each stage of the cardiac cycle.
Results:
TA area (P = 0.012) and perimeter (P = 0.024) both changed significantly over the cardiac cycle. Of all the axes, only the posterolateral-anteroseptal demonstrated significant dynamism (P < 0.001). There was also a significant displacement in the vertical axis between the points and the regression plane in end-systole (P < 0.001), mid-diastole (P = 0.014), and mid-systole (P < 0.001).
Conclusions:
The TA demonstrates selective dynamism over the cardiac cycle, and its axis of maximal dynamism is different from the axis (S-L) that is routinely measured with 2D TEE.
Keywords: Three-dimensional echocardiography, Transesophageal echocardiography, Tricuspid annulus, Tricuspid regurgitation, Tricuspid valve repair
INTRODUCTION
Despite the increased appreciation of the tricuspid annulus (TA) geometry in recent years,[1,2,3] there are still gaps in understanding its dynamism over the course of the cardiac cycle and identifying the axes of maximal dynamism. The lack of correlation between TA dilation and severity of tricuspid regurgitation (TR) could possibly be due to the discrepancy between the echocardiographically appreciated, i.e., septolateral (S-L) axis, and the true anatomical axis of dynamism.[4] The previous assumptions of a circular shape and flat conformation of the TA have been shown to be erroneous, and therefore, other derived geometric calculations may also be inaccurate.[5,6] In this context, three-dimensional (3D) echocardiography has provided new insight to understanding the spatial and temporal geometry of the TA.[3,7,8,9]
The S-L diameter is traditionally measured during routine 2D echocardiographic imaging as a potential marker of TA dilation. While this axis is echocardiographically convenient, it may not be the anatomical axis of maximal dynamism or dilation. Furthermore, establishing the time course of geometric changes in TA conformation may have added clinical value. The current understanding is based on predefined end-systolic (ES) and end-diastolic (ED) frame analyses, and the timing of the maximal change in TA dimensions may not be in synchrony with these user-defined points. Considering this knowledge gap, we used real-time 3D transesophageal echocardiography (TEE) to quantify the dimensions of the TA and analyze its geometric changes over the course of the cardiac cycle.
MATERIALS AND METHODS
This study was conducted as part of an ongoing Institutional Review Board-approved protocol for intraoperative 3D echocardiographic data collection with a waiver of informed consent. For the purpose of this study, only patients undergoing cardiovascular surgery with intraoperative 3D TEE were included. Exclusion criteria were: Abnormal right ventricular structure or function, rhythm other than sinus, congenital cardiac abnormalities, and TR greater than mild.
All echocardiographic data were collected intraoperatively after induction of general anesthesia and before institution of cardiopulmonary bypass. All data were acquired using the Philips iE-33 Ultrasound System with an X7-2t TEE probe (Phillips Healthcare, Andover MA, USA).
Briefly, the TEE probe was positioned to display a midesophageal four-chamber view. The image was optimized to include the TA and right ventricle apex in the imaging window. After activating the full-volume mode, the R-wave-gated acquisition was performed over 4–6 beats. Image acquisition was performed during a brief period of apnea and lack of patient motion or electrical interference. The acquired datasets were immediately accessed with on-cart 3D visualization software to ensure their quality and exclude artifacts, dropout, and inadequate annulus visualization.
The acquired data were later exported to a USB drive in the Digital Imaging for Communication in Medicine format. They were then analyzed on a desktop computer equipped with the TomTec® Image Arena Software (TomTec Imaging Systems, GmBH, Munich, Germany).
In the 4D Cardio-View interface of the Image Arena software, 3D images were viewed in sagittal, coronal, and transverse planes. The tricuspid valve was identified in orthogonal views. Multiplanar reformatting was used to digitally mark septal (S), lateral (L), anterior (A), and posterior (P) TA points. The sagittal plane was then rotated 45° to identify another four annular points. These four points are the posteroseptal (PS), anterolateral (AL), anteroseptal (AS), and posterolateral (PL) midpoints, respectively [Figure 1]. This sequence was followed for each dataset at the following four stages of the cardiac cycle:
Figure 1.
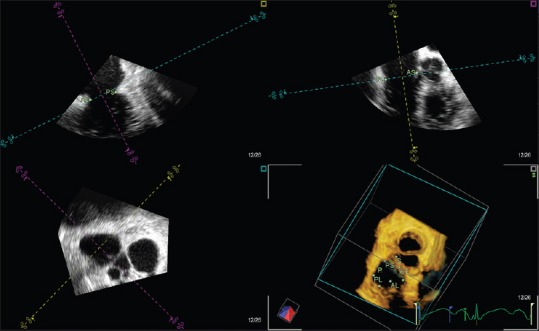
The tricuspid annular points marked in Image Arena. First, the septal, lateral, anterior, and posterior points were identified. Then, the sagittal plane was rotated 45° for the anterolateral, posteroseptal, posterolateral, and anteroseptal points to be identified (A: Anterior, AL: Anterolateral, AS: Anteroseptal, L: Lateral, P: Posterior, PL: Posterolateral, PS: Posteroseptal, S: Septal)
End-systole, or the last frame before the tricuspid valve starts to open
End-diastole, or the last frame before the tricuspid valve starts to close
Mid-systole (MS), or the middle frame between ED and ES
Mid-diastole (MD), or the middle frame between ES and ED.
Afterward, the Cartesian coordinates for the marked annular points were exported as a comma-separated value (.csv) file for further analysis.
The Cartesian coordinates were imported into SolidWorks (Dassault Systemes, Paris, France) for reconstruction and computational measurement of TA area and perimeter [Figure 2].
Figure 2.
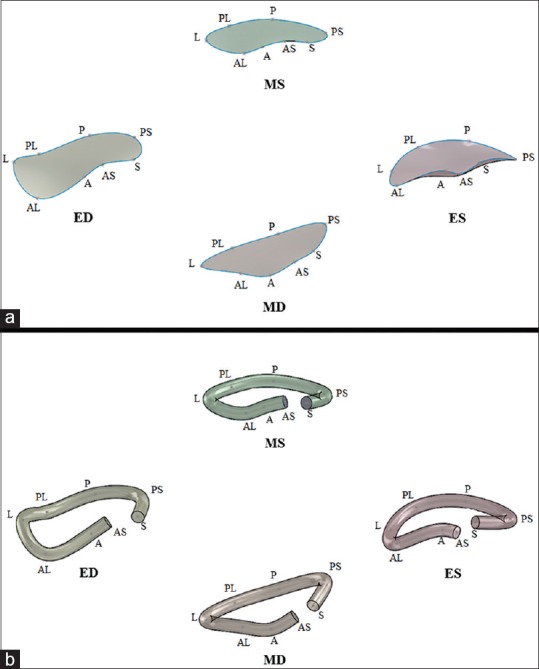
The SolidWorks closed curve construction of the tricuspid annulus at each of four stages of the cardiac cycle (a) allowed for area and perimeter measurements to be obtained using the SolidWorks “measure” tool. The SolidWorks solid construction of the tricuspid annulus at each of four stages of the cardiac cycle (b) could be exported as a stereolithography file for three-dimensional printing (A: Anterior, AL: Anterolateral, AS: Anteroseptal, ED: End-diastole, ES: End-systole, L: Lateral, MD: Mid-diastole, MS: Mid-systole, P: Posterior, PL: Posterolateral, PS: Posteroseptal, S: Septal)
A closed spline curve was generated from the Cartesian coordinates of all eight points of the TA, in consecutive order, with a repeat entry for the S point. The closed curve sketch that was generated was then selected and its surface filled, allowing for area and perimeter to be obtained via the “measure” tool within the SolidWorks evaluation functions.
An open spline curve was created in SolidWorks by fitting a curve to the eight annular points, starting with S and ending with AS. After constructing the open spline, a circle with an arbitrarily selected diameter of 5 mm was then swept around the path of the open curve to give the TA an established thickness. This 3D reconstruction was then exported as a stereolithography (.stl) file for 3D printing.
TA area and perimeter were computed in SolidWorks at each stage of the cardiac cycle for each patient. To assess whether there was a significant change in TA area and perimeter over the cardiac cycle, a repeated measures analysis of variance (ANOVA) was performed using R (R Core Team, Vienna, Austria). The ANOVA tested whether the average area and average perimeter varied with cardiac cycle stage while treating the patient identity as a repeated measure to account for between-patient variability. These tests were followed up with a post hoc Tukey's honest significant difference (HSD) analysis to examine the differences in area and perimeter between each pairwise combination of cardiac cycle stages.
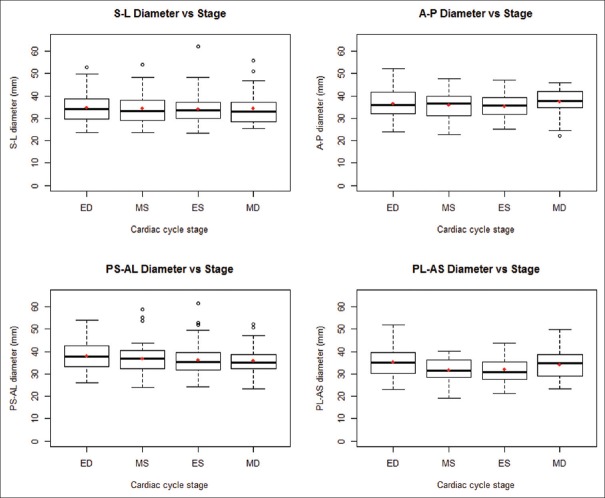
Because eight points were captured for each TA, there were four discrete axes (S-L, A-P, PS-AL, and PL-AS) available to test for their degree of dynamism over the four defined stages of the cardiac cycle [Figure 3]. The coordinate data were imported to R, and the four diameters were determined for each patient at each cardiac cycle stage using their Cartesian distance. Independently, each of the four diameters was then compared to the cardiac cycle stage, with repeated measures ANOVA to account for diameter variability between patients. After identifying which of the four diameters underwent significant change over the cardiac cycle, a post hoc Tukey's HSD analysis was performed to determine the specific cardiac cycle stages that presented these differences.
Figure 3.
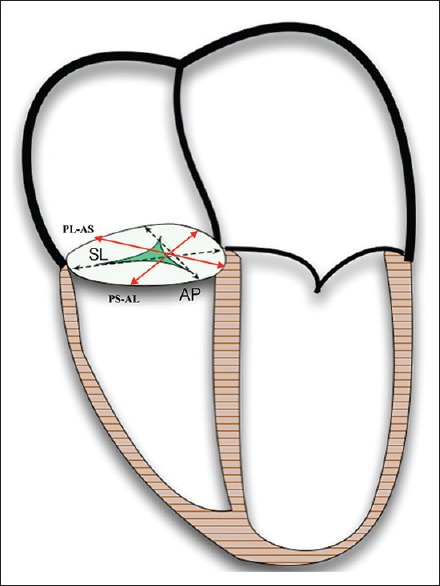
Four-chamber view of the heart with tricuspid axes labeled (AL: Anterolateral, AP: Antero-posterior, AS: Anteroseptal, PL: Posterolateral, PS: Posteroseptal, SL: Septo-lateral)
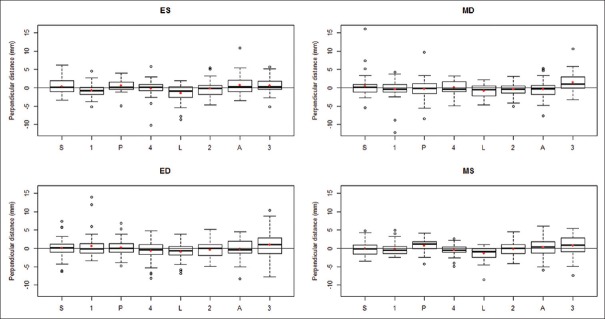
For every patient and for each phase of the cardiac cycle, a linear regression plane was fit to the eight points of the TA by the first-order polynomial in both the x and y directions to the response direction (i.e., z) [Figure 4]. The perpendicular distance from each point to the regression plane was then calculated, and one-way ANOVA was performed to assess whether there was a significant relationship between perpendicular distances and cardiac cycle stage for each of the eight points. The specific pairwise combinations of points that differed were obtained from a post hoc Tukey's HSD analysis.
Figure 4.
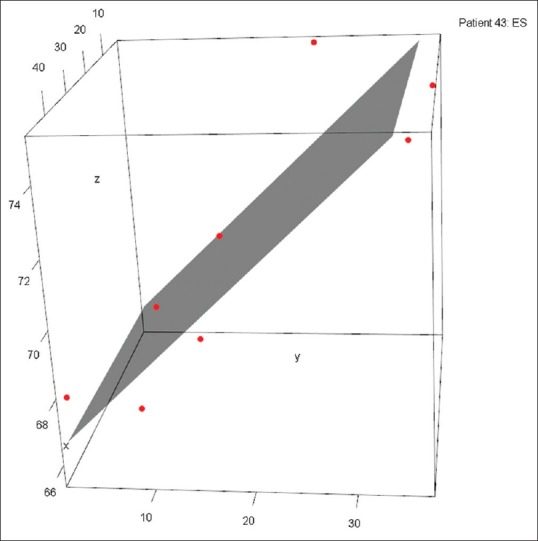
Tricuspid annulus points plotted with a three-dimensional planar fit constructed via least squares regression. This planar fit best represents the tricuspid valve plane. A greater perpendicular distance from point to regression plane is an indication of nonplanar fit and a notable high or low point
RESULTS
Totally, 37 patients completed the study [Table 1].
Table 1.
Demographics of the patient population of size 37
| Patient demographics (n=37) | |
|---|---|
| Markers | Values |
| Gender (male/female) | 26 (70)/11 (30) |
| Procedure (isolated CABG/CABG concurrent/other procedure) | 19 (51)/3 (8)/15 (41) |
| BMI (mean±SD) | 28.75±5.63 |
| BSA (mean±SD) | 1.98±0.25 |
| Age (mean±SD) | 69.57±10.38 |
Gender and procedure are reported as counts (%), while BMI, BSA, and age are represented as a mean±1 SD. BMI: Body mass index, SD: Standard deviation, BSA: Body surface area, CABG: Coronary artery bypass graft
TA area changed significantly throughout the four stages of the cardiac cycle (P = 0.012) as did TA perimeter (P = 0.024). The most notable changes in both area and perimeter occurred during the transition from ED to MS. TA area experienced an average decrease of 138.66 mm2 (P = 0.007) and perimeter experienced an average decrease of 7.44 mm (P = 0.021) between these two stages of the cardiac cycle. There were no significant changes in area or perimeter during any other phase transition [Figure 5].
Figure 5.
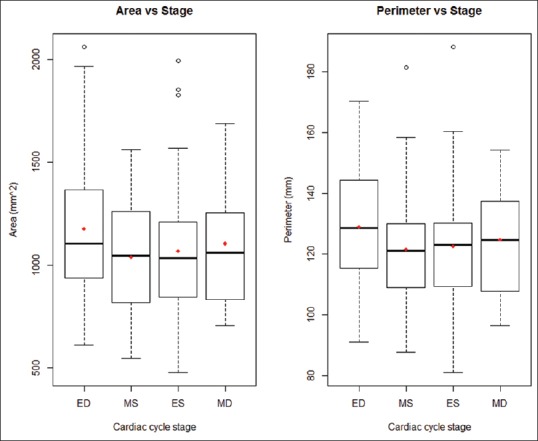
Tricuspid annulus area and perimeter distributions grouped by cardiac cycle stage (ED: End-diastole, ES: End-systole, MD: Mid-diastole, MS: Mid-systole)
Of the four axes studied, the PL-AS axis was the only one that changed significantly throughout the cardiac cycle (P < 0.001). The S-L (P = 0.888), A-P (P = 0.095), and AL-PS (P = 0.386) axes did not vary with cardiac cycle stage [Figure 6]. A post hoc Tukey's HSD analysis identified the significant pairwise differences in each diameter between stages of the cardiac cycle.
Figure 6.
Diameter distributions grouped by cardiac cycle stage (A: Anterior, AL: Anterolateral, AS: Anteroseptal, ED: End-diastole, ES: End-systole, L: Lateral, MD: Mid-diastole, MS: Mid-systole, P: Posterior, PL: Posterolateral, PS: Posteroseptal, S: Septal)
There was a significant perpendicular displacement of the TA points from the regression plane in ES (P < 0.001), MD (P = 0.014), and MS (P < 0.001) while the relationship in ED was not statistically significant (P = 0.066). This suggests that the TA has defined high and low points in ES, MD, and MS but is relatively planar in ED [Figure 7]. A post hoc Tukey's HSD analysis identified the significant pairwise differences in the perpendicular distance between points.
Figure 7.
Perpendicular distance from point to regression plane at each point, subdivided by cardiac cycle stage (A: Anterior, AL: Anterolateral, AS: Anteroseptal, ED: End-diastole, ES: End-systole, L: Lateral, MD: Mid-diastole, MS: Mid-systole, P: Posterior, PL: Posterolateral, PS: Posteroseptal, S: Septal)
DISCUSSION
Our study has demonstrated that the TA undergoes selective, heterogeneous dynamism throughout the cardiac cycle, with the largest change in diameter occurring along the PL-AS axis. This implies that the traditional S-L diameter is not a true representative axis of TA dynamism. Furthermore, the PL-AS axis cannot be reliably measured with traditional 2D echocardiography [Figure 8]. The maximal annular diameter in PL-AS axis is observed at ED. Therefore, based on the findings of our study, it would be prudent to recommend 3D TEE imaging as the most suitable method of the evaluation of TA dimensions. Furthermore, a static evaluation of the TA, considering the changes occurring over the cardiac cycle, may not be representative of TA structure in other stages of the cardiac cycle.
Figure 8.
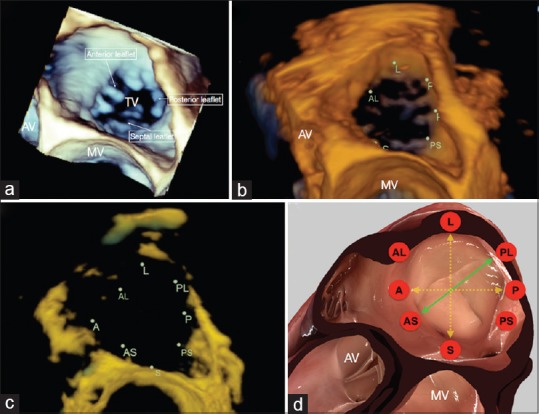
Tricuspid annulus positioned in the surgical view as: three-dimensional volumetric data (a), an Image Arena reconstruction (b), Image Arena reconstruction with increased transparency (c), and a simulation using HeartWorks (Inventive Medical Limited, London, UK) software (d). The HeartWorks image is annotated with the observed axis of maximal dynamism (green) and the axes routinely measured during imaging (yellow) (A: Anterior, AL: Anterolateral, AS: Anteroseptal, AV: Aortic valve, L: Lateral, MV: Mitral valve, P: Posterior, PL: Posterolateral, PS: Posteroseptal, S: Septal, TV: Tricuspid valve)
TA geometry in both healthy and TR patients has been previously studied using 3D TEE.[3,5,7,8,9,10] These studies, however, have evaluated the annulus at fewer stages of the cardiac cycle[3,5,7,10] and with fewer diameters,[5,7,8,10] using a complex methodology.[3,9] Some studies have not specifically identified either the axis of maximal dynamism or the temporal relationship of this change [Table 2].[5,7,10] While the disparity may be explained by random sampling or by the patient populations investigated, it may also be explained by the different methodologies implemented by each study as many studies have neglected to investigate the PL-AS axis.[5,7,8,10] In our previous report, we addressed the same question using a different methodology with fewer spatial and temporal data points.[5] Whereas we demonstrated a similar complex conformational change, our current study is unique in using a simpler, clinically feasible methodology. We have found that a relatively simple analysis of 8 points and 4 diameters can be used to evaluate the structure and dynamic changes of the TA during the cardiac cycle. This methodology could be applied to assess the maximum axes of dilation in patients with TR and could potentially explain the discordance between TA diameter and the severity of TR.
Table 2.
Summary of previous studies using three-dimensional transesophageal echocardiography to describe the geometry of the tricuspid annulus
| Previous studies on the geometry of the tricuspid annulus | ||||
|---|---|---|---|---|
| Author | Methods (patient sample and number of annular points captured) | Axes investigated | Observed cycle stages | Axis of maximal dynamism |
| Owais et al., 2014 | 26 healthy patients 24 annular points | A-P, S-L, 1000+ possible axes in between | End-diastole, end-systole | S-L |
| Ton-Nu et al., 2005 | 40 healthy patients+35 TR patients Number of annular points not specified | A-P, S-L | Mid-systole | Not investigated |
| Ring et al., 2012 | 20 healthy patients+30 patients with right ventricular dilation 16 annular points | A-P, S-L | Early diastole, mid-diastole, late diastole, early systole, mid-systole, late systole | S-L in healthy patients, no significant diameter changes in patients with right ventricular dilation |
| Fukuda et al., 2006 | 15 healthy patients+16 TR patients 8 annular points | S-L, PS-AL, A-P, AS-PL | Whole cycle, frame-by-frame | S-L in healthy patients, PS-AL in TR patients |
| Mahmood et al., 2013 | 12 healthy patients+8 TR patients 32 annular points | A-P, S-L | End-diastole | Not investigated |
| Kwan et al., 2006 | 13 healthy patients 32 annular points | A-P, S-L | Early systole, late systole | Not investigated |
A: Anterior, AL: Anterolateral, AS: Anteroseptal, L: Lateral, P: Posterior, PS: Posteroseptal, S: Septal, TR: Tricuspid regurgitation
The changes in dimension and planarity of the TA throughout the cardiac cycle suggest that some degree of flexibility is necessary for normal tricuspid valve function. Therefore, tricuspid valve repair with rigid annuloplasty rings may impair this flexibility. Our findings also raise the question of whether the axis of maximal dynamism, the PL-AS axis, may also be the primary axis of dilation in functional TR. This could potentially explain the discordance between TA dilation and severity of functional TR.
Our study presents some limitations. First, our sample was composed of cardiovascular surgery patients. While we excluded patients with abnormal tricuspid valves or abnormal right ventricular structure/function, these were not healthy patients. Second, we limited our analysis to 3D R-wave-gated reconstruction TEE data because this gave us an optimal temporal and spatial resolution. Obtaining these data may not be possible in patients with irregular cardiac rhythms or during patient motion due to temporal or spatial misalignment. Third, since this study was limited to patients without TR, we cannot comment with certainty on the geometric changes that the TA undergoes in functional TR. It is possible that the major axis of dynamism is different in these patients.
CONCLUSION
It is possible to quantify the dimensions and geometric changes of the TA over the cardiac cycle using a simple approach based on 3D TEE imaging. This analysis demonstrates that the TA is a nonplanar and dynamic structure, with the maximum dimensional change occurring along the PL-AS axis at ED that cannot be measured reliably with 2D imaging. Therefore, 2D imaging is inadequate to comprehensively and accurately interrogate the TA, and 3D TEE should be routinely used for tricuspid quantitative analyses.
Financial support and sponsorship
Nil.
Conflicts of interest
There are no conflicts of interest.
REFERENCES
- 1.Fawzy H, Fukamachi K, Mazer CD, Harrington A, Latter D, Bonneau D, et al. Complete mapping of the tricuspid valve apparatus using three-dimensional sonomicrometry. J Thorac Cardiovasc Surg. 2011;141:1037–43. doi: 10.1016/j.jtcvs.2010.05.039. [DOI] [PubMed] [Google Scholar]
- 2.Park YH, Song JM, Lee EY, Kim YJ, Kang DH, Song JK. Geometric and hemodynamic determinants of functional tricuspid regurgitation: A real-time three-dimensional echocardiography study. Int J Cardiol. 2008;124:160–5. doi: 10.1016/j.ijcard.2006.12.036. [DOI] [PubMed] [Google Scholar]
- 3.Owais K, Taylor CE, Jiang L, Khabbaz KR, Montealegre-Gallegos M, Matyal R, et al. Tricuspid annulus: A three-dimensional deconstruction and reconstruction. Ann Thorac Surg. 2014;98:1536–42. doi: 10.1016/j.athoracsur.2014.07.005. [DOI] [PMC free article] [PubMed] [Google Scholar]
- 4.Shiran A, Sagie A. Tricuspid regurgitation in mitral valve disease incidence, prognostic implications, mechanism, and management. J Am Coll Cardiol. 2009;53:401–8. doi: 10.1016/j.jacc.2008.09.048. [DOI] [PubMed] [Google Scholar]
- 5.Mahmood F, Kim H, Chaudary B, Bergman R, Matyal R, Gerstle J, et al. Tricuspid annular geometry: A three-dimensional transesophageal echocardiographic study. J Cardiothorac Vasc Anesth. 2013;27:639–46. doi: 10.1053/j.jvca.2012.12.014. [DOI] [PMC free article] [PubMed] [Google Scholar]
- 6.Maffessanti F, Gripari P, Pontone G, Andreini D, Bertella E, Mushtaq S, et al. Three-dimensional dynamic assessment of tricuspid and mitral annuli using cardiovascular magnetic resonance. Eur Heart J Cardiovasc Imaging. 2013;14:986–95. doi: 10.1093/ehjci/jet004. [DOI] [PubMed] [Google Scholar]
- 7.Ton-Nu TT, Levine RA, Handschumacher MD, Dorer DJ, Yosefy C, Fan D, et al. Geometric determinants of functional tricuspid regurgitation: Insights from 3-dimensional echocardiography. Circulation. 2006;114:143–9. doi: 10.1161/CIRCULATIONAHA.106.611889. [DOI] [PubMed] [Google Scholar]
- 8.Ring L, Rana BS, Kydd A, Boyd J, Parker K, Rusk RA. Dynamics of the tricuspid valve annulus in normal and dilated right hearts: A three-dimensional transoesophageal echocardiography study. Eur Heart J Cardiovasc Imaging. 2012;13:756–62. doi: 10.1093/ehjci/jes040. [DOI] [PubMed] [Google Scholar]
- 9.Fukuda S, Saracino G, Matsumura Y, Daimon M, Tran H, Greenberg NL, et al. Three-dimensional geometry of the tricuspid annulus in healthy subjects and in patients with functional tricuspid regurgitation: A real-time, 3-dimensional echocardiographic study. Circulation. 2006;114(1 Suppl):I492–8. doi: 10.1161/CIRCULATIONAHA.105.000257. [DOI] [PubMed] [Google Scholar]
- 10.Kwan J, Kim GC, Jeon MJ, Kim DH, Shiota T, Thomas JD, et al. 3D geometry of a normal tricuspid annulus during systole: A comparison study with the mitral annulus using real-time 3D echocardiography. Eur J Echocardiogr. 2007;8:375–83. doi: 10.1016/j.euje.2006.07.010. [DOI] [PubMed] [Google Scholar]


