

Abstract
The analysis of disease-specific biomarker panels holds promise for the early detection of a range of diseases, including cancer. Blood-based biomarkers, in particular, are attractive targets for minimally-invasive disease diagnosis. Specifically, a panel of organ-specific biomarkers could find utility as a general disease surveillance tool enabling earlier detection or prognostic monitoring. Using arrays of chip-integrated silicon photonic sensors, we describe the simultaneous detection of eight cancer biomarkers in serum in a relatively rapid (1 hour) and fully automated antibody-based sandwich assay. Biomarkers were chosen for their applicability to a range of organ-specific cancers, including disease of the pancreas, liver, ovary, breast, lung, colorectum, and prostate. Importantly, we demonstrate that selected patient samples reveal biomarker “fingerprints” that may be useful for a personalized cancer diagnosis. More generally, we show that the silicon photonic technology is capable of measuring multiplexed panels of protein biomarkers that may have broad utility in clinical diagnostics.
Introduction
The development of targeted protein-based diagnostics promises to increase the degree of biomolecular detail that can be gleaned into the state of disease. For example, biomarker panels have been investigated as a means to provide more personalized and effective treatment for cancer.1,2 Although much work has been accomplished to discover putative biomarkers and biomarker panels, validation and clinical deployment of diagnostic biomarker panels remains to be achieved.3, 4 Typically, clinical assays for protein biomarkers rely on immunoassays such as the enzyme-linked immunosorbent assay (ELISA), which is traditionally designed to measure one biomarker at a time. However, given the diagnostic potential of multiplexed analyses, there is an increasing emphasis on the development of technologies capable of simultaneously detecting multiple protein targets from within a single sample, with the bead-based Luminex platform being the most commercially successful. Many emerging technologies leverage advances micro- and nanoscale fabrication technologies to create small footprint sensors that can be configured into multiplexed sensor arrays.5-8
To this end, our own group has been developing a scalable silicon photonic technology detection platform that can be readily configured into multiplexed detection arrays for to create multiplex sensors that can measure multiple proteins from a given sample.9, 10 Silicon photonic microring resonators belong to a larger class of refractive index-responsive “whispering gallery resonators” 11 and this chip-integrated geometry leverages robust semiconductor fabrication methods to create multiplexable sensor arrays. Light is coupled into microring resonators from adjacent linear waveguides only under conditions of optical resonance, as described by:
where m is an integer, λ is the wavelength of light, r is the radius of the ring, and neff is the effective refractive index of the waveguide mode. When functionalized with target-specific capture agents, binding induced changes in the local refractive index at the sensor surface can be used to sensitively quantitate the presence of a range of analytes.
The scalability of silicon enables the facile creation of microsensor chips containing multiple sensors on a given chip. Experiments described in this paper were performed on sensor chips with 32 active microring sensors, with two additional sensors used to correct for thermal drift. Using these arrays, we create a microsensor chip that can detect eight different analytes, each measured in quadruplicate, as illustrated in Figure 1. As described in greater detail in the experimental methods section, antibodies were attached to the surface via the DNA-encoded antibody method,12, 13 which provides a robust approach for creating on-demand antibody arrays. The following eight biomarkers were targeted on account of their previously reported correlation with organ-specific cancer: α-fetoprotein (AFP; liver and germ cell cancers14); activated leukocyte cell adhesion molecule (ALCAM; breast cancer15); cancer antigen 15-3 (CA15-3; breast cancer14); cancer antigen 19-9 (CA19-9; pancreatic, colorectal, and ovarian cancers14, 16); cancer antigen-125 (CA-125; ovarian cancer14, 17); carcinoembryonic antigen (CEA; colorectal and pancreatic cancers18-20); osteopontin (ovarian and liver cancers17, 21); and prostate specific antigen (PSA; prostate cancer22). Within our selected 8-plex panel, five biomarkers are FDA-approved biomarkers (AFP, CA15-3, CA-125, CEA, PSA).23 These biomarkers were also convenient targets because they have broad relevance across diverse organ-specific cancers and also have a good selection of commercially available antibodies.
Figure 1.
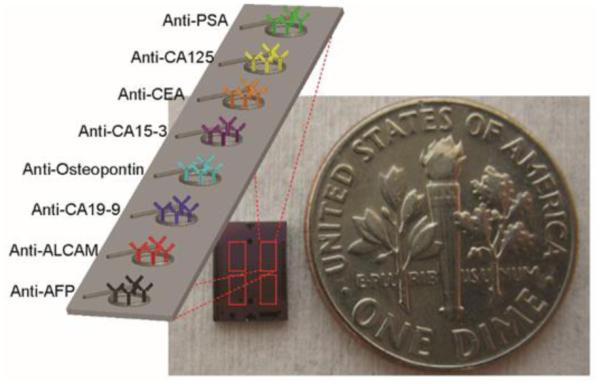
Photograph of silicon microchip overlaid with four red boxes indicating sub-array regions containing 8 microring resonators, each functionalized with an antibody specific for a different cancer biomarker antigen.
It is important to note that many of these biomarkers have been observed in other types of cancer and even within a single organ-type of cancer their elevation is not ubiquitous, which reflects underlying heterogeneities in disease mechanism. In fact, patient heterogeneity often complicates the universal diagnostic utility of any single biomarker. Moreover, the validation of any biomarker(s) requires the analysis of many diverse patient samples, which underscores the need for robust and automated biomarker screening tools. In this manuscript our focus is not on the biological relevance of specific biomarkers, but rather the demonstration that the silicon photonic detection technology can be used for analyse panels of protein biomarkers from within clinically-relevant samples.
Results and discussion
In contrast to most other immunoassay technologies which only offer endpoint readout, microring resonators offer a unique real-time monitoring capacity that is extremely enabling in the assay development process. Specifically, every step of the assay, including antigen-capture antibody and tracer antibody binding, and the entirety of the signal enhancement process can be followed in real time as each of these steps causes a shift in resonance wavelength. We have previously demonstrated that this breadth of measurement capability can enable an extended dynamic range of detection, an important consideration when measuring multiple analytes each with a particular concentration range of interest.24 Additionally, observation of direct binding of antigens and capture antibodies tremendously expedites the screening and identification of capture agents with the required binding affinity and specificity. While not a major focus of this manuscript, this complete assay development capability offers a significant advantage in that the same technology can be utilized throughout the entire assay design, validation, and (eventually) deployment process.
Figure 2 shows how microring resonator arrays can be used to construct a multiplexed biomarker detection panel, including the ability to reveal antibody cross reactivity. Figures 2a and 2b represent eight separate experiments showing primary and tracer recognition, respectively, of single biomarkers in buffer. In Figure 2a, each antigen was added individually in order and the primary binding was observed. Most of the capture antibodies show a specific response for only the specified target; however, noticeable cross reactivity was observed for the analytes CA19-9 and CA15-3. Upon the introduction of 1 kU/mL CA19-9, the appropriate anti-CA19-9-functionalized rings (cyan) respond, but the anti-CEA-functionalized rings (orange) also show a resonance shift, indicating non-specific target binding to this capture antibody. Similarly, addition of 1 kU/mL of CA15-3 generated resonance shifts from not only the anti-CA15-3-functionalized sensors (purple), but also from the anti-CEA-(orange) and anti-CA19-9-functionalized (cyan) sensors.
Figure 2.

8-plex analysis for cross reactivity and 8-plex serum sensing. (a) Response of 8-plex chip upon sequential addition of 1 μg/mL (or 1 kU/mL) of each antigen in buffer. Each plot shows the responses for the entire array of microring sensors, each functionalized with a different capture antibody, to a single biomarker. (b) Response of the same 8-plex chip upon subsequent addition of 1 μg/mL of the capture antibody. Each plot shows the responses for the entire array exposed to the single listed analyte and corresponding tracer antibody. (c) Schematic showing the layer-by-layer singnal enhancement strategy. (d) A real-time plot showing the resonance wavelength shifts through the entire assay analysing a representative human serum sample. Vertical arrows represent the start of the primary, tracer, and secondary enhancement steps, respectively. The * symbol indicates a buffer rinse. For panels, a, b, and d, responses are color-coded according to the capture antibody on each microring:anti-AFP = black, and-ALCAM = red, anti-CA19-9 = cyan, anti-osteopontin = blue, anti-CA15-3 = purple, anti-CEA = orange, anti-CA125 = yellow, anti-PSA = green.
In a continuation of these single biomarker studies, we then tested tracer antibodies, which can form a highly selective sandwich immunocomplex specific for the targeted biomolecule. Figure 2b shows the sensor responses upon the sequential addition of 1 μg/mL of each tracer antibody, which followed the introduction of a single biomarker for the primary binding step (Figure 2a). Interestingly, the addition of every tracer antibody shows a selective response, indicating on-target recognition, with one exception. The anti-CA 15-3 tracer was also observed to bind to anti-CA 19-9-functionalized rings, which had also showed an apparently non-specific response to CA 15-3. In a separate experiment (not shown) we flowed the anti-CA 15-3 tracer antibody alone (no antigen) over the array of capture antibodies, suggesting that the response is a function of the biomarker sample itself. Upon consulting the product literature provided by the vendor, CA 19-9 is a known contaminant in the CA 15-3 sample, which explains this response and provides confidence in the overall fidelity of our 8-plex biomarker detection panel. Moreover, arrays of silicon photonic sensors and the real-time analysis capability provide significant benefits in terms of assay development, optimization, and troubleshooting that will likely be helpful for reagent screening and assay validation even if they are to be used with alternative detection methodologies.
After determining that the 8-plex assay had sufficient specificity, we proceeded to make measurements of biomarkers in human serum samples. In order to obtain a detection of limit at the clinically relevant levels. Specifically, we employed a protein-based multilayer signal enhancement strategy.25-28 Similar layer-by-layer methods have also been deployed using nanoparticle-based labels, rather than proteins alone,29, 30
Figure 2c illustrates this methodology on the microring resonator silicon surface. Following the binding of the primary antigen and biotinylated tracer antibody, a solution of PE-labelled anti-biotin antibodies is introduced and a binding response is only measured on microrings that have the fully assembled sandwich immunocomplex (capture antibody-antigen-tracer antibody). Biotinylated anti-PE antibodies are then introduced, which bind to the PE labels of the anti-biotin antibody. This process can be repeated with cycling between separate solutions containing either PE-labelled anti-biotin or biotinylated anti-PE antibodies giving an enhanced shift in the resonance wavelength shift that correlated with the initial concentration of antigen in solution. The response from this signal enhancement procedure varied among the targeted cancer antigens, but overall the response correlated with the number of antibody layering steps (Supplementary Figure 2) Moreover, the initial layers deposited follow an exponential growth, consistent with previous layer-by-layer protein films assembled on microring resonators involving multiply biotinylated antibodies and streptavidin.31
It is worth noting that the Maverick M1 instrumentation utilized in these experiments features completely automated fluid handling, which facilitated this multi-step signal enhancement strategy. This is In contrast to traditional Luminex assay protocols that require long incubation times and many manual pipetting steps (Supplementary Table 7). For our assays, we used a maximum of six steps (3 multilayer cycles), though some biomarkers could be detected with fewer. Notably, negative control experiments revealed that the signal enhancement strategy in the absence of target did not contribute any non-specific sensor response (Supplementary Figure 1). Furthermore, by quantitating in buffer, as opposed to sensor matrix, this sandwich assay format was immune to the sample matrix effects seen in the primary binding response.
Figure 2d shows the real-time shifts in resonance wavelength during an entire representative 8-plex biomarker assay from a representative human serum sample, which was a 90-minute total assay. The diluted serum sample was flowed across a pre-functionalized microring resonator array for a total of 30 minutes to allow primary antigen binding. After 30 minutes, the flow is switched to running buffer and the surface rinsed for 20 minutes. Note that there is a large bulk refractive index shift that is observed upon introduction of serum, which is confirmed by its reversal upon switching running buffer. A cocktail of all eight tracer antibodies were then flowed across the surface for 15 minutes, followed by a 5 minute rinse with running buffer. The multilayered signal enhancement scheme was then invoked with 2 minute cycles in the PE-labelled anti-biotin and biotinylated anti-PE antibodies. Importantly, sample quantitation was performed using only the secondary enhancement response, which showed a quantitative correlation with the number of layers deposited, as described in Supplementary Figure 2. Additional enhancement layers would have lowered limits of detection; however, we found that a maximum of six layers were sufficient for the multiplexed biomarker screening results described in this manuscript. Furthermore, the number of steps were also limited to minimize time-to-result and reagent consumption.
After assay development and validation of specificity, we then created standard curves to be used for biomarker quantitation. Solutions containing known concentrations of biomarker standards were prepared and analysed using the 8-plex microring array. The total relative shift during the secondary enhancement is plotted as a function of concentration, with a calibration curve for each antigen presented in Figure 3. The working ranges for each assays are found in Supplementary Table 6, and further details about the calibration analysis and fitting parameters are given in the Supplementary Information section.
Figure 3.

Calibration curves for each cancer biomarker. Each plot shows the dose-response relationship and fit for each of the targeted antigens as detected by the specific sandwich assay immunoassay.
Following the generation of calibration curves, we next moved to quantitate the 8-plex biomarkers panel in a handful of representative human serum samples. Specifically, we analysed commercially-available samples from patients generically diagnosed with pancreatic, liver, ovarian, breast, lung, colorectal, and prostate cancer, as well as a sample from a healthy patient. Figure 4 shows the real-time resonance shifts for each of the entire 8-plex assays. The resonance shift during the secondary, protein multi-layer enhancement regime was measured and compared against the calibration curves to determine the serum concentrations of each of the respective antigens (Supplementary Table 2)
Figure 4.

Real-time response of the 8-plex cancer biomarkers assay in eight evaluated serum samples from healthy patients as well as cancer patients. Each panel shows the real-time shift in resonance shift throughout the entire assay to detect the 8-plex biomarker panel from each commercial, organ-specific serum sample. Although clear differences are observed through the primary antigen binding response, quantification is achieved only from the layer-by-layer secondary enhancement component of the assay.
For the sake of comparison, the sensor responses of each biomarker determined from the cancer patient samples were divided by the response of the same biomarker measured in the healthy sample to generate a relative index of expression. That is to say that a relative index of 15 means that the biomarker level is elevated 15-fold over the healthy sample. This mechanism of data presentation is helpful as some biomarkers, such as ALCAM, have uniformly higher concentrations in all samples and therefore the importance in absolute concentrations is highly variable across this set of biomarkers. This indexing approach seems reasonable given that these markers are known to be elevated in the case of organ-specific cancer.
In Figure 5 we plotted relative indices across the 8-plex panel for each patient that revealed organ-specific biomarker “fingerprints” for these seven samples. For example, the known pancreatic cancer biomarker CA 19-9 shows the greatest level of elevation in the pancreatic cancer sample. Similarly, CA 15-3 and PSA show the largest elevations in breast and prostate cancer, respectively. For the liver cancer sample, AFP and osteopontin, both known to be elevated in some liver malignancies, showed elevated levels. However, we also see examples where biomarkers are not elevated as have been reported in the literature. CA-125, a putative ovarian cancer biomarker, is not elevated in the ovarian cancer sample. Also, both CEA, a colorectal cancer marker, and ALCAM, a breast cancer marker, have relatively stable levels across all of the patient samples and are not elevated in breast or colorectal samples.
Figure 5.

Relative biomarker “fingerprints” for selected cancer patient serum samples. This “fingerprint” was generated by dividing the sensor response for each biomarker in each cancer serum sample by the response measured in the healthy serum sample. Error bars indicate the relative standard deviation for the four technical replicate sensors on each chip used to measure each antigen. A relative index level of 1.0 indicates (horizondal dashed lines in each plot) that the biomarker was equivalent in both disease and normal sample, with indices greater than 1.0 representing organ-specific biomarker elevation.
Importantly, we are not making any claims about the diagnostic value of any of these markers. Rather we are reporting on the development of a silicon photonic technology that has the capability to robustly perform analyses of multiplexed panels of serum biomarkers. From a biological perspective, though, there are many reasons why the diagnostic utility of specific biomarkers might not strictly be observed in these (and other) serum samples. The patient-to-patient heterogeneity of cancers is well-documented and genetic and phenotypic differences can lead to wide disparities in secreted biomarker signatures. Perhaps the best instance of underling disease heterogeneity compromising the value of single biomarker-based diagnostics is the example of PSA, of which an overreliance on this assay for screening purposes can lead to over diagnosis and overly aggressive treatment.32 Moreover, the limited specificity of many single disease biomarkers greatly restricts their independent diagnostic utility,33 but rather suggest defined roles in screening and monitoring. Though taken together, panels of mildly specific serum biomarkers might, if recorded longitudinally using cost effective, multiplexed technologies, be very effective in the early detection of malignancies that could then be localized via more highly specific clinical means.
Experimental methods
Materials
Succinimidyl 4-formylbenzoate (S-4FB), succinimidyl 6-hydrazinonicotinamide acetone hydrazone (S-HyNic), and 3-N-((6-(N'-Isopropylidene-hydrazino))nicotinamide)propyltriethy-oxysilane (HyNic Silane) were purchased from SoluLink (San Diego, CA). Custom DNA oligonucleotides were synthesized by Integrated DNA Technologies (Coralville, IA). A list of all antigens and antibodies (capture and detection) purchased and used for eight-plex experiments are listed in Supplementary Table 3. NHS-PEG4-Biotin, Zeba spin filters, and Starting Block were purchased from Pierce (Rockford, IL). NHS-PEG4-Biotin was dissolved in N,N-dimethylformamide (DMF) to make a 20 mM stock solution. Vivaspin molecular weight cutoff filters (50,000 and 5,000 Da MWCO), were obtained from GE Healthcare (Waukesha, WI). Anti-biotin antibody conjugated to phycoerythrin (anti-biotin PE) and biotinylated anti-phycoerythrin (anti-PE biotin) were obtained from eBioscience (San Diego, CA). Phosphate buffered saline (PBS), with a standard 10 mM phosphate ion concentration, was reconstituted from Dulbecco’s phosphate buffered saline packets purchased from Sigma-Aldrich (St. Louis, MO). All other chemicals were obtained from Sigma-Aldrich and used as received. Human serum samples from cancer patients were purchased from Innovative Research, Inc. (Novi, MI) and Asterand, Inc. (Detroit, MI), and information related to these samples are listed in Supplementary Table 5.
Buffers were made with purified water (ELGA PURELAB filtration system; Lane End, UK), and the pH adjusted as necessary with 1 M HCl or 1 M NaOH. For NHS-ester chemistry, A high phosphate PBS buffer with 100 mM phosphate (100 mM PBS) was made to be 150 mM NaCl, 22.5 mM monobasic sodium phosphate, and 77.7 mM dibasic sodium phosphate and then pH-adjusted to either pH 7.4 or pH 6.0. PBS with 0.05% Tween-20 (PBST) was made by adding Tween-20 to standard PBS buffer (Dulbecco’s formulation). PBST with Starting Block (PBST-SB) was made by adding 1% Starting Block to PBST buffer and then adding 0.01% sodium azide as a preservative. All solutions were degassed under vacuum with concurrent sonication before being flowed across the sensor surface.
Instrumental Setup and Microchip Design
The instrument, sensor chips, and microring resonator measurement system was acquired from Genalyte, Inc. (San Diego, CA). The M1 version of the instrument offered optical detection performance equivalent to the previous version,34 but with the enabling addition of full automation of fluidic flow with programming to allow sipping from a 96-well plate. The chips used in these experiments are 4 × 6 mm microchips with 34 microring sensors—32 active sensor rings and 2 thermal controls, which are rings covered by a polymeric cladding that allowed real-time correction of resonance shifts resulting only from temperature fluctuation. All measurements for these experiments were made with the sensor chips loaded into a custom cell with microfluidic flow channels defined by a 0.007-inch thick Mylar gasket with a U-shaped channel 400 μm wide. Solution was drawn from pre-loaded 96-well plates via the automated fluid handling system in the instrument.
Surface Functionalization with DNA
Microring array substrates were first cleaned with piranha solution (3:1 H2SO4:30% H2O2) for 30 seconds followed by rinsing with water and drying under a stream of N2. To introduce reactive functional groups, substrates were covered with 20 μL of a 1 mg/mL solution of HyNic Silane (20 mg/mL HyNic Silane in DMF stock solution diluted to 1 mg/mL with ethanol) for ~30 minutes, followed by rinsing with ethanol and then sonicating in ethanol for ~30 minutes. Chips were then dried with N2. Notably, the polymeric cladding layer confined surface functionalization to the annular openings surrounding microring sensors.
Antibodies were attached to the sensor surfaces via DNA-DNA hybridization, as is described below. For this purpose, individual microring sensors were modified with specific single-stranded DNA oligonucleotides, the sequences of which were previously designed to ensure minimal cross-reactivity.35 The sequences of all surface attached oligonucleotides (B, C, D, F, J, K, L, and M), are provided in Supplementary Table 4. Single-strand oligonucleotides were synthesized with a 5′ amino terminal group to facilitate surface attachment via standard bioconjugate reactions. Oligonucleotides were first functionalized with S-4FB according to manufacturer (SoluLink) instructions, with an initial buffer exchange to 100 mM PBS pH 7.4 using 5 kDa MWCO filters and then subsequent reaction with a 20-fold molar excess of S-4FB in DMF. Solutions were allowed to react overnight at room temperature and were then buffer exchanged into 100 mM PBS pH 6.0 using 5 kDa MWCO filters to remove excess S-4FB reagent.
Eight-plex chips were created by microspotting 4FB-functionalized DNA strands onto HyNic-functionalized microring resonator chips. Each chip had four microrings spotted with a unique DNA sequence (B, C, D, F, J, K, L, and M). Spotting was accomplished with a Nano eNabler spotting system from BioForce Nanosciences (Ames, IA). The 4-FB-modified DNA was diluted to a concentration of ~100 μM in 100 mM PBS buffer pH 6.0 and mixed in a 1:1 ratio with dimethyl sulfoxide (DMSO). After spotting, the drops evaporated on a hot plate (~80 °C) for five minutes and then incubated in a saturated humidity chamber overnight. The chips were then briefly rinsed in Starting Block, and then immediately in water. The chips were then again rinsed with fresh Starting Block and stored in PBST-SB until use.
DNA-Antibody Conjugate Synthesis and Sensor Array Encoding via Self-Assembly
To create DNA-antibody conjugates, antibodies were functionalized with S-HyNic as previously demonstrated.12 The sequences of oligonucleotides attached to antibodies (B′, C′, D′, F′, J′, K′, L′, and M′; with the prime denoting complementarity to the respective surface-attached sequence) are provided in Supplementary Table 4. Again, each oligonucleotide had a 5′-NH2 functionality. S-HyNic solutions, dissolved in DMF, was added in 20-to 30-fold molar excess to ~1 mg/mL antibody that had been buffer exchanged into 100 mM PBS pH 7.4 with a Zeba spin filter. This reaction was allowed to proceed for at least two hours at room temperature. The HyNic presenting antibodies were then exchanged into 100 mM PBS pH 6.0 with a Zeba spin filter to remove excess HyNic.
DNA modified with 4FB was then added in >10-fold molar excess to the HyNic-modified antibody and allowed to react overnight at 4 °C. The resulting DNA-antibody conjugates were then purified away from the excess 4FB-DNA using a Superdex 200 10/300 GL column on an AKTA FPLC, both from GE Healthcare (Waukesha, WI). The separation was performed at 4 °C with a PBS isocratic elution. Collected fractions were concentrated with 50 kDa MWCO filters to yield purified solutions of DNA-antibody conjugates. The final conjugate concentration was determined by measuring the differential absorption at 260 versus 280 nm, corresponding to the DNA and IgG, respectively, using a NanoDrop UV-Vis absorbance system (ThermoFisher Scientific, Wilmington, DE). The following conjugates were synthesized using the capture antibodies listed in Supplementary Table 3, resulting in the following DNA-capture antibody combinations: B′-anti-AFP, C′-anti-ALCAM, D′-anti-CA19-9, F′-anti-osteopontin, J′-anti-CA15-3, K′-anti-CEA, L′-anti-CA-125, M′-anti-PSA.
To create multiplexed biomarker detection arrays, each of the DNA-antibody conjugates were combined into a single mixed with each conjugate at 5 μg/mL (except for L′-anti-CA-125, which was used at 1 μg/mL) in PBST. To each eight-plex, DNA-functionalized microchip, 10 μL of DNA-antibody conjugate mixture was added to the surface of each chip and the array allowed to self-assemble. Chips were incubated overnight to enable maximum binding of the DNA-antibody conjugates to the DNA capture probes on the surface. Following overnight binding, the chips were rinsed and stored immersed in PBST-SB. Notably, we find that DNA-modified sensor arrays are extremely stable and that fully-functional DNA-encoded antibody arrays can be assembled many months after initial deposition of DNA.
Tracer Antibody Biotinylation
Each of tracer antibodies was biotinylated to facilitate the layer-by-layer signal enhancement scheme. The ALCAM tracer was purchased as a pre-biotinylated polyclonal antibody. Each of the other tracer antibodies were first buffer exchanged into 100 mM PBS pH 7.4 via a Zeba spin column. A 20-fold molar excess of 20 mM NHS-PEG4-biotin was then added allowed to react for 2 h at room temperature. For the anti-AFP and anti-osteopontin tracer antibodies, it was empirically determined that 5-fold and 50-fold molar excesses, respectively, gave the best performance. Excess NHS-PEG4-biotin was removed by buffer exchange using Zeba spin filter columns. Prior to use in the layer-by-layer signal enhancement scheme, the anti-PE biotin and anti-biotin PE antibodies were buffer exchanged into the PBST-SB.
Eight-plex Antigen Analysis
To generate calibration curves, all antigens were diluted in PBST-SB or 50% Starting Block/50% PBST-SB. Human serum samples were analyzed after diluting to 33% in PBST-SB. The sensor array was placed into the fluidic cartridge and loaded into the M1 instrument. For all assay steps, except for sample and biotinylated tracer antibody introduction, the flow rate was 30 μL/min. When the sample and biotinylated tracer was introduced, the flow rate was reduced to 15 μL/min to reduce consumption. PBST-SB was used as the running buffer and was flowed over the surface for ~5 minutes to establish a stable baseline. The sample was introduced and flowed over the chip for a total of 30 minutes (200 μL of serum diluted 3-fold) before a 20 minute rinse with running buffer to help remove non-specifically bound proteins for 20 minutes. A mixture of biotinylated tracer antibodies each at a concentration of 1 μg/mL was then flowed over the chip for 15 minutes followed by a 5 minute running buffer rinse. For the layer-by-layer signal enhancement step, the solution flowing across the chip was repeatedly switched between 1 μg/mL anti-biotin (PE) and 2 μg/mL anti-PE (biotin) for two minutes each, with a 15-second running buffer rinse between each step. This process was repeated up to 3 times (six steps), yielding an enhanced signal magnitude for biomarkers present in the sample. Importantly, each of these steps was completely automated and did not require any under intervention during the assay.
The difference in resonance wavelength shift before and after the signal enhancement step was determined and used for quantitation. Importantly, since the signals are measured only from this secondary step, resonance shifts from non-specific protein adsorption do not contribute to the analytical signal. Calibration curves were generated by flowing protein standards prepared at defined concentrations across the sensor array and plotting the enhancement step resonance shift as a function of concentration. Details on calibration curves, assay performance, negative control experiments, and linearity of the signal enhancement scheme are provided in the Supporting Information.
Conclusions
The emergence of a number of disease-related biomarkers place an impetus on the development of robust diagnostic technologies of cost-effective and relatively rapid measuring levels of multiple biomarkers from within single patient sample. Using a silicon photonic microring resonator platform we demonstrate the multiplexed detection of eight cancer serum biomarkers. The real-time analytical capabilities of the technology streamlined the assay development and optimization process, and an automated layer-by-layer signal enhancement scheme provided requisite analytical performance. Comparison of biomarkers levels across a narrow subset of samples suggest that panel-based disease “fingerprints” might have utility in the screening, early detection, or monitoring of disease on an individualized level. Obviously the next step for this technology involves the analysis of many more patient samples in concert with a more directed clinical applications and patient outcomes. However, we feel that this technological achievement is noteworthy in the context of analytical sensor development. Moreover, the cost effective and modularly multiplexable nature of the technology position it as an attractive platform for a wide number of biomarker-based diagnostic applications that are becoming increasingly valuable in the pursuit of personalized cancer diagnostics.
Supplementary Material
Acknowledgements
This work was supported by the NIH Director's New Innovator Award Program, part of the NIH Roadmap for Medical Research, through grant number 1-DP2-OD002190-01, and National Science Foundation grant CHE 12-14081. ALW was supported via a National Science Foundation Graduate Research Fellowship as well as a Division of Analytical Chemistry Summer Graduate Research Fellowship sponsored by the Society for Analytical Chemists of Pittsburgh. WWS was supported by an American Heart Association Predoctoral Fellowship. KAL was supported by a REU program at the University of Illinois Department of Chemistry that was sponsored by 3M.
Footnotes
Electronic Supplementary Information (ESI) available: Details on antibodies, antigens, and calibration curve generation.
Notes and references
- 1.Etzioni R, Urban N, Ramsey S, McIntosh M, Schwartz S, Reid B, Radich J, Anderson G, Hartwell L. Nature Reviews Cancer. 2003;3:243. doi: 10.1038/nrc1041. [DOI] [PubMed] [Google Scholar]
- 2.Petricoin EF, Ardekani AM, Hitt BA, Levine PJ, Fusaro VA, Steinberg SM, Mills GB, Simone C, Fishman DA, Kohn EC, Liotta LA. Lancet. 2002;359:572–577. doi: 10.1016/S0140-6736(02)07746-2. [DOI] [PubMed] [Google Scholar]
- 3.Sawyers CL. Nature. 2008;452:548–552. doi: 10.1038/nature06913. [DOI] [PubMed] [Google Scholar]
- 4.Rusling JF. Analytical Chemistry. 2013;85:5304–5310. doi: 10.1021/ac401058v. [DOI] [PMC free article] [PubMed] [Google Scholar]
- 5.He B, Morrow TJ, Keating CD. Current Opinion in Chemical Biology. 2008;12:522–528. doi: 10.1016/j.cbpa.2008.08.027. [DOI] [PMC free article] [PubMed] [Google Scholar]
- 6.Carregal-Romero S, Caballero-Díaz E, Beqa L, Abdelmonem AM, Ochs M, Hühn D, Suau BS, Valcarcel M, Parak WJ. Annual Review of Analytical Chemistry. 2013;6:53–81. doi: 10.1146/annurev-anchem-062012-092621. [DOI] [PubMed] [Google Scholar]
- 7.Muzyka K. Biosensors and Bioelectronics. 2014;54:393–407. doi: 10.1016/j.bios.2013.11.011. [DOI] [PubMed] [Google Scholar]
- 8.Estevez MC, Otte MA, Sepulveda B, Lechuga LM. Analytica Chimica Acta. 2014;806:55–73. doi: 10.1016/j.aca.2013.10.048. [DOI] [PubMed] [Google Scholar]
- 9.Luchansky MS, Bailey RC. Analytical Chemistry. 2010;82:1975–1981. doi: 10.1021/ac902725q. [DOI] [PMC free article] [PubMed] [Google Scholar]
- 10.Washburn AL, Luchansky MS, Bowman AL, Bailey RC. Analytical Chemistry. 2010;82:69–72. doi: 10.1021/ac902451b. [DOI] [PMC free article] [PubMed] [Google Scholar]
- 11.Foreman MR, Swaim JD, Vollmer F. Adv. Opt. Photon. 2015;7:168–240. doi: 10.1364/AOP.7.000168. [DOI] [PMC free article] [PubMed] [Google Scholar]
- 12.Washburn AL, Gomez J, Bailey RC. Analytical Chemistry. 2011;83:3572–3580. doi: 10.1021/ac200317z. [DOI] [PMC free article] [PubMed] [Google Scholar]
- 13.Bailey RC, Kwong GA, Radu CG, Witte ON, Heath JR. J. Am. Chem. Soc. 2007;129:1959–1967. doi: 10.1021/ja065930i. [DOI] [PMC free article] [PubMed] [Google Scholar]
- 14.Sturgeon C. Clinical Chemistry. 2002;48:1151–1159. [PubMed] [Google Scholar]
- 15.Kulasingam V, Zheng Y, Soosaipillai A, Leon AE, Gion M, Diamandis EP. International Journal of Cancer. 2009;125:9–14. doi: 10.1002/ijc.24292. [DOI] [PMC free article] [PubMed] [Google Scholar]
- 16.Berger AC, Meszoely IM, Ross EA, Watson JC, Hoffman JP. Annals of Surgical Oncology. 2004;11:644–649. doi: 10.1245/ASO.2004.11.025. [DOI] [PubMed] [Google Scholar]
- 17.Mor G, Visintin I, Lai Y, Zhao H, Schwartz P, Rutherford T, Yue L, Bray-Ward P, Ward DC. Proceedings of the National Academy of Sciences of the United States of America. 2005;102:7677–7682. doi: 10.1073/pnas.0502178102. [DOI] [PMC free article] [PubMed] [Google Scholar]
- 18.Schiemann U, Günther S, Gross M, Henke G, Müller-Koch Y, König A, Muders M, Folwaczny C, Mussack T, Holinski-Feder E. Cancer Detection and Prevention. 2005;29:356–360. doi: 10.1016/j.cdp.2005.04.003. [DOI] [PubMed] [Google Scholar]
- 19.Szymendera J, Nowacki M, Szawlowski A, Kamińska J. Diseases of the Colon and Rectum. 1982;25:46–52. doi: 10.1007/BF02553548. [DOI] [PubMed] [Google Scholar]
- 20.Wang JY, Tang RP, Chiang JM. Diseases of the Colon & Rectum. 1994;37:272–277. doi: 10.1007/BF02048166. [DOI] [PubMed] [Google Scholar]
- 21.Cao D-X, Li Z-J, Jiang X-O, Lum YL, Khin E, Lee NP, Wu G-H, Luk JM. World Journal of Gastroenterology : WJG. 2012;18:3923–3930. doi: 10.3748/wjg.v18.i30.3923. [DOI] [PMC free article] [PubMed] [Google Scholar]
- 22.Andriole GL, Crawford ED, Grubb RL, III, Buys SS, Chia D, Church TR, Fouad MN, Gelmann EP, Kvale PA, Reding DJ, Weissfeld JL, Yokochi LA, O'Brien B, Clapp JD, Rathmell JM, Riley TL, Hayes RB, Kramer BS, Izmirlian G, Miller AB, Pinsky PF, Prorok PC, Gohagan JK, Berg CD, PLCO Project Team New England Journal of Medicine. 2009;360:1310–1319. doi: 10.1056/NEJMoa0810696. [DOI] [PMC free article] [PubMed] [Google Scholar]
- 23.Rhea JM, Molinaro RJ. MLO: Medical Laboratory Observer. 2011;43:10–18. [PubMed] [Google Scholar]
- 24.Luchansky MS, Washburn AL, McClellan MS, Bailey RC. Lab on a Chip. 2011;11:2042–2044. doi: 10.1039/c1lc20231f. [DOI] [PMC free article] [PubMed] [Google Scholar]
- 25.Spaeth K, Brecht A, Gauglitz G. Journal of Colloid and Interface Science. 1997;196:128–135. doi: 10.1006/jcis.1997.5200. [DOI] [PubMed] [Google Scholar]
- 26.Anderson GP, Taitt CR. Sensor Letters. 2008;6:213–218. [Google Scholar]
- 27.Pei R, Cheng Z, Wang E, Yang X. Biosens. Bioelectron. 2001;16:355–361. doi: 10.1016/s0956-5663(01)00150-6. [DOI] [PubMed] [Google Scholar]
- 28.Hosokawa K, Omata M, Maeda M. Anal. Chem. 2007;79:6000–6004. doi: 10.1021/ac070659o. [DOI] [PubMed] [Google Scholar]
- 29.Bakalova R, Zhelev Z, Ohba H, Baba Y. J. Am. Chem. Soc. 2005;127:9328–9329. doi: 10.1021/ja0510055. [DOI] [PubMed] [Google Scholar]
- 30.Chen H, Jiang J-H, Huang Y, Deng T, Li J-S, Shen G-L, Yu R-Q. Sens. Actuators, B. 2006;117:211–218. [Google Scholar]
- 31.Luchansky MS, Washburn AL, Martin TA, Iqbal M, Gunn LC, Bailey RC. Biosensors and Bioelectronics. 2010;26:1283–1291. doi: 10.1016/j.bios.2010.07.010. [DOI] [PMC free article] [PubMed] [Google Scholar]
- 32.Carter HB, Albertsen PC, Barry MJ, Etzioni R, Freedland SJ, Greene KL, Holmberg L, Kantoff P, Konety BR, Murad MH, Penson DF, Zietman AL. The Journal of Urology. 190:419–426. doi: 10.1016/j.juro.2013.04.119. [DOI] [PMC free article] [PubMed] [Google Scholar]
- 33.Sturgeon CM, Lai LC, Duffy MJ. BMJ. 2009;339 doi: 10.1136/bmj.b3527. [DOI] [PubMed] [Google Scholar]
- 34.Iqbal M, Gleeson MA, Spaugh B, Tybor F, Gunn WG, Hochberg M, Baehr-Jones T, Bailey RC, Gunn LC. IEEE J. Sel. Top. Quantum Electron. 2010;16:654–661. [Google Scholar]
- 35.Fan R, Vermesh O, Srivastava A, Yen BKH, Qin L, Ahmad H, Kwong GA, Liu C-C, Gould J, Hood L, Heath JR. Nature Biotechnology. 2008;26:1373–1378. doi: 10.1038/nbt.1507. [DOI] [PMC free article] [PubMed] [Google Scholar]
Associated Data
This section collects any data citations, data availability statements, or supplementary materials included in this article.