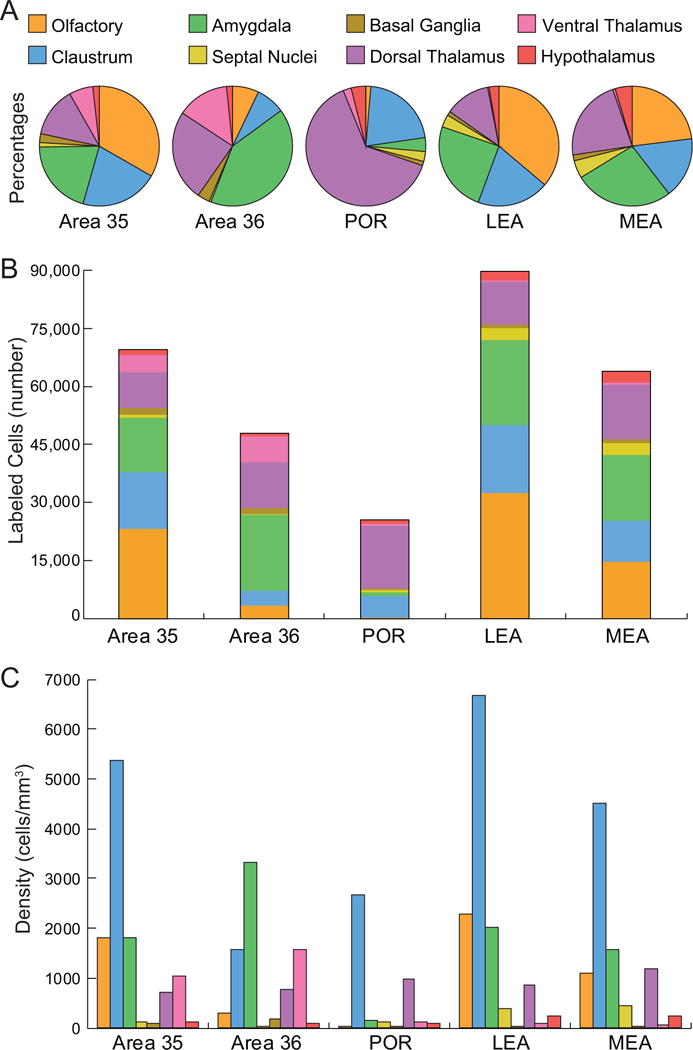
Figure 8.

Percentages, total numbers of labeled cells and densities in composite subcortical areas resulting from retrograde injections in the PER areas 35 and 36, POR, LEA and MEA. Color code is for all panels. A. Input to each target region as indicated by the percentage of labeled cells found in each composite subcortical region. Note POR has a much larger proportion of labeled cells in the dorsal thalamic nuclei, largely the lateral posterior nucleus. Proportions for area 35 are more similar to the LEA and area 36 is more similar to the MEA. See Table 3 for details. B. Input to each target region as indicated by normalized total numbers of labeled cells for each group of subcortical structures. The LEA has the most input from subcortical regions, followed by area 35, then MEA, area 36 and finally the POR. C. Output from different subcortical structures indicated by average densities of labeled cells in the subcortical areas. See Table 4 for details and Table 1 for abbreviations.
