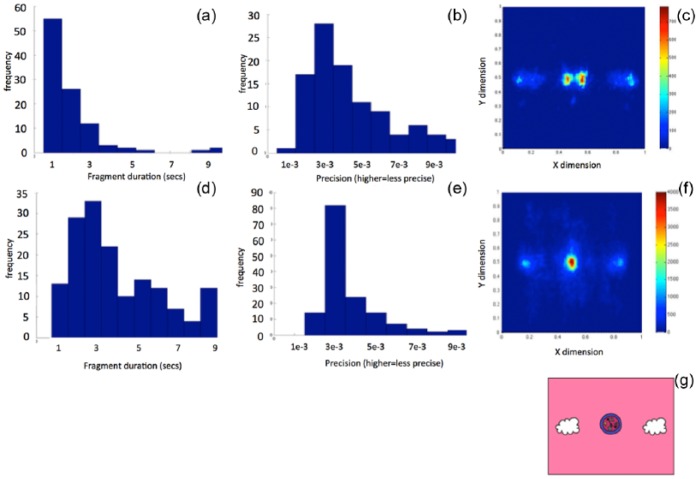
Figure 3.
Data quality comparison based on data from the gap-overlap study: (a–c) data from this study, (d–f) data from a comparison study that used identical procedures, in laboratory settings, with typical infants (Wass et al., 2011). (a) and (d) Histograms showing the duration of usable fragment durations that were present in our data (calculated on a block-by-block basis). Markedly, longer usable fragment durations were obtained in the comparison study. (b) and (e) Histograms showing the precision of our data (calculated on block-by-block basis). Markedly, more precise data were obtained in the comparison study. (c) and (f) Gaze maps of usable gaze data obtained during the trial. (g) A schematic of how images were distributed on the screen during the trials. (Colour version available online. DOI: 10.1177/1362361315617880.)

