Abstract
Background: Patients with chronic hepatitis C virus (HCV) infection are at risk of serious complications of cirrhosis and hepatocellular carcinoma (HCC). Mass spectrometry (MS) is a versatile methodology that produces a global proteomic landscape for analysis of cancer mechanisms. Materials and Methods: Using multiplex peptide stable isotopic labeling and immobilized metal affinity chromatography (IMAC), we enriched and quantified the phosphoproteome of HCC, with and without HCV. While raw data identified protein targets based on expression alone, we also used abundance groups for comprehensive functional analysis. Results: Analysis of functional differences highlighted deregulated phosphoprotein networks. This uncovered additional candidates that could be directly derived from the MS data. Cellular processes and pathways that may differ with HCV infection include: cytoskeletal dynamics, insulin response, gene expression, and PI3K/AKT oncogenesis. Conclusion: This function-focused workflow provides a simple framework to analyze MS data. Phosphoproteome quantitation with inclusive functional analysis can generate hypotheses for liver cancer research to improve early screening and identification of molecular targets for therapy.
Keywords: Hepatocellular carcinoma, hepatitis C virus, mass spectrometry, phosphoproteomics
The phospho-network promises us more than a few scientific breakthroughs. In unveiling how Escherichia coli enhances its bacterial virulence (1,2), how oncogenic B-RAF stabilizes the anti-apoptotic protein Mcl-1 to promote melanoma survival and chemo-resistance (3), or how type II diabetics develop insulin insensitivity (4), the phospho-network implores our imagination to draw other intricate biological maps.
Patients with chronic hepatitis C virus (HCV) infection risk serious complications of cirrhosis and hepatocellular carcinoma (HCC). What if HCV-infected hepatocytes utilize post-translational modifications (PTM) like phosphorylation to orchestrate fundamental biological changes influencing cancer growth, proliferation, and differentiation? Using selective tools (5,6) to capture network-wide phosphorylation signals to expose the primary switches of how HCV triggers core HCC pathways, we can create a new platform that generates hypotheses for future studies to earlier diagnose and treat one of the most prevalent types of liver cancer (7,8).
This study presents the first quantitative phosphoproteome analysis of liver cancer with HCV. Our model uses a simple work-flow to map the differential phosphoproteomic expression between two conditions: HCC (hepatocellular carcinoma) and HCC+V (hepatocellular carcinoma with HCV replicon). While raw data were utilized to identify protein candidates based on expression alone, additional comprehensive functional analyses using abundance thresholds uncovered targets that could not be derived from the original MS results. This function-focused workflow provides a simple methodology for revealing hypotheses that incorporate a broader range of protein networks. In comparison to analyzing mRNA messages, mass spectrometry provides a much closer approximation of the final cellular dynamics that influence HCC transformation. The HCC and HCC+V phosphoproteomes depict unique protein abundances that may differentially regulate processes including: metabolic insulin response, cytoskeletal dynamics impacting cell growth, viral-mediated host mRNA transcription, and phosphatidylinositol-3-kinase/protein kinase B (PI3K/AKT)-driven oncogenic survival. These MS derived hypotheses can serve as the starting point for subsequent molecular research to closely investigate the mechanisms of HCC.
Materials and Methods
In solution tryptic digestion. All experimentation and analysis were performed at the University of California, Los Angeles. 2×10⁸ cells were harvested with 0.25% trypsin (Fisher Scientific, Grand Island, NY, USA) from Huh-7.5 (HCC) and SGR (HCC+V) cell lines. Cell pellets were lysed in 500 μL of 12 mM sodium lauryl sarcosine, 0.5% sodium deoxycholate, and 50 nM triethyl ammonium bicarbonate (TEAB). Samples were then sonicated and heated at 90˚C for 5 min each. A bicinchoninic acid protein quantitation assay (Thermo Fischer Scientific) was performed using a spectrophotometer. Protein disulfides were reduced with 5 mM tris (2-carboxytheyl) phosphine (TCEP) in 50 mM TEAB (30 min at RT) and alkylated with 10 mM iodoacetamide in 50 mM TEAB (30 min in the dark at RT). Protein solutions were diluted five-fold with 50 mM TEAB. Lyophilized porcine trypsin (Promega, Madison, WI, USA) was solubilized in 50 mM TEAB and added 1:50 (w/w) ratio to proteins, followed by overnight incubation at 37˚C. Sodium deoxycholate was removed from peptide solutions with trifluoroacetic acid (0.5% final concentration), phase transferred with ethyl acetate 1:1(v/v), and centrifuged (12,000 × g at RT, 5 min). The upper organic phase was decanted prior to lyophilizing peptides.
On-column stable isotopic dimethyl labeling. Supelco Visiprep SPE Vacuum Manifold (Sigma-Aldrich, St. Louis, MO, USA) was assembled with Sep-Pak cartridges and waste containers. Each sample was reconstituted in 2 mL of water. Cartridges were conditioned with 100% methanol (MeOH), 80% acetonitrile (ACN), and 0.5% acetic acid. The cartridges were then equilibrated with 0.6% acetic acid. The sample set was passed through the cartridge and washed with 2.4 mL of 0.25 M 2-(N-Morpholino)-ethanesulfonic acid (MES). Two labeling solutions were then prepared by adding 300 μl of formaldehyde (4%, CH2O or 13CD2O) and 300 μl cyanoborohydride (0.6M, NaBH3CN or NaBD3CN) to 2.4 ml of 0.25 M MES Buffer (final concentration: 0.4% CH2O or 13CD2O or 60 mM NaBH3CN or NaBD3CN). 3 ml of 0.4% CH2O, 60mM NaBH3CN (light isotope labeling solution) was passed through the HCC samples over the course of 10 min. Then, 3 ml of 0.4% 13CD2O, 60 mM NaDBD3CN (heavy isotope labeling solution) was passed through the HCC + V samples over the course of 10 min. Acetic acid (0.6%) was then used to wash the cartridges. Labeled peptides were eluted with 3 ml of 80% acetonitrile (ACN) and 0.5% acetic acid (9).
HILIC. Labeled peptides were combined 1:1 (w/w) and loaded onto a column (TosoHaas TSKgel Amide-80 HR 4.6 mm ID ×25 cm,5 μm) and fractionated using a Series II 1090 Liquid Chromatography (Hewlett-Packard, Palo Alto, CA, USA). Loading Solvent A (100% H2O, 0.1% trifluoroacetic acid (TFA)) and Eluting Solvent B (100% ACN, 0.1% TFA) were used. Fractionation was performed as per protocol (5). Peptides were initially held in 80% solvent B for 10 min, eluted for 35 min in 80%-65% solvent B, and then eluted for 5 min in 65%-0% solvent B. After elution, there was a 10 min hold for a final run time of 60 min. A total of 40 fractions (1 min each) were collected.
IMAC. Forty fractions were combined into 28 fractions for IMAC phosphopeptide enrichment as per protocol (5). 18 μL of PHOS-Select Iron Affinity Gel beads (Sigma) were added to each sample and mixed (30 min. at RT). An Acroprep Nylon 96 Filter Plate (Pall) was prepared by passing through 100% ethanol, 400 mM ammonium hydroxide in 85% ACN, and 250 mM acetic acid in 95% ACN. After samples were passed through, they were washed with 250 mM acetic acid in 30% ACN. Acetic acid was diluted by passing through H2O. Samples were eluted with 150 μL of 400 mM ammonium hydroxide in 30% ACN and 15 μL of 10% TFA using centrifuge (1150 × g × 2 min). Samples were dried prior to desalting.
Desalting. Desalting of samples was performed according to StageTips procedure (10). Phosphopeptide-enriched samples were re-suspended in 100 μl of a buffer solution (3% ACN and 0.5% acetic acid). C18 filter tips were conditioned by passing through 100% methanol and then 80% ACN with 0.5% acetic acid. Next, C18 tips were equilibrated with 3% ACN, 0.5% acetic acid and 80 μL of the samples were subsequently loaded. The filter was washed with 3% ACN, 0.5% acetic acid. Peptides were eluted with 20 μl of 80% ACN, 0.5% acetic acid. The eluted samples were lyophilized and 10 μl of 3% ACN, 0.1% FA was mixed with the lyophilized sample, which was then placed into the injection vial.
HPLC-MS/MS. Fractionated samples were analyzed with an Eksigent 2D nanoLC attached to a Orbitrap LTQ XL (Thermo Fisher Scientific, Waltham, MA, USA) Peptides were injected onto a laser-pulled nanobore 20 cm × 75 μm C18 column (Acutech Scientific, San Diego, CA, USA) in buffer A (0.1% formic acid) and resolved using a 2-h linear gradient from 3-50% buffer B (80% acetonitrile with 0.1% formic acid). The Orbitrap LTQ XL was operated in data-dependent mode with 60,000 resolution and target auto gain control at 5e6 for parent scan. The top 12 ions above +1 charge were subjected to collision induced dissociation (CID) set to a value of 35 with target auto gain control of 5000. Dynamic exclusion was set to 30 seconds. Raw data was processed and quantified using Proteome Discoverer (Thermo Fisher Scientific, Waltham, MA, USA).
MS Quantification. Multiplex peptide stable isotope dimethyl labeling was used to accurately compare and quantify protein levels. This method converts all primary amines in a peptide mixture to dimethylamines. By incorporating 13C and D as the heavy isotopes in one condition, all experimental conditions (i.e. HCC and HCC+V) are subsequently distinguished during concurrent LC-MS/MS runs. Protein quantification is achieved by comparing their relative ion abundances. Raw data was interpreted with Proteome Discoverer v.2.0 (Thermo Fisher Scientific, Waltham, MA, USA) and SEQUEST HT (Matrix Science London, UK) against human entries from the UniProt database (released December 20, 2015). Search parameters were performed using: trypsin enzyme digest with up to two missed cleavages; a precursor ion mass tolerance of 10 ppm; CID fragment ion mass tolerance of 0.02 Da; carbamidomethylation as a fixed modification; variable modifications for oxidation of methionine; dimethylation (C2H6) of lysine and the N-terminus; dimethylation 13C2D6 of lysine and the N-terminus; and phosphorylation of serine, threonine, and tyrosine; and a peptide minimum length of six amino acids. An individual ion score cutoff was chosen that led to a FDR of 5% at the PSM level. Phosphorylation sites were localized with PhosphoRS 2.0 embedded within Proteome Discoverer (6). Individual site probabilities are calculated using probability-based PhosphoRS 2.0 with a 75% site probability threshold.
Data analysis and software. Microsoft Office Excel (Microsoft, Redmond, WA, USA) was used for main data organization and presentation. R statistical computing software was used for creating intensity heat maps. WebGestalt (bioinfo.vanderbilt.edu/webgestalt) and Gene Ontology Consortium (geneontology.org) were used for GO enrichment and PathwayCommons analysis to generate protein sets. Protein networks and corresponding pathways were generated from PathwayCommons analysis using the Top10 significance level. All GO enrichment was performed with a significance level of p<0.05 and for each analysis a hypergeometric statistical method and Benjamini-Hochberg multiple test adjustment were used. Functional proteomic analysis was completed by combining GO enrichment results with UniProt (uniprot.org) search and validation. The heat map depicting proteomic functional results was created by using Python (python.org) software to sort GO enrichment data into different abundance categories and graph the resulting proportion of ids over the respective total. Protein network diagrams were created using Cytoscape3.3.0 (cytoscape.org) with the GeneMania application (apps.cytoscape.org/apps/genemania) (11). Pathways for the hypothetical protein target figures were created using information from PathwayCommons 2 (v7) (pathwaycommons.org) and UniProt. The hypothetical protein target and mass spectrometry workflow images were made with GeneMania software (http://www.genemania.org/) and Servier Medical Art (servier.com/ Powerpoint-image-bank).
Western blot analysis. Lysates were prepared with TritonX-100 lysis buffer (0.5% Triton X-100, 10 mM Tris, 150 mM NaCl, 5 mM EDTA, 1 mM Sodium Orthovanadate, 40 mM Sodium Fluoride, 50 mM Beta-Glycopyrophosphate, 5% Sigma Aldrich Protease Inhibitor Cocktail, and 10% Glycerol). Protein samples were separated and transferred overnight onto PVDF membrane (EMD Millipore, Darmstadt, Germany). Western blots were incubated overnight with primary antibodies, then for 1 h with secondary antibodies. Primary antibodies for BCL-2, p-Op18 Ser25, p-Op18 Ser63 were purchased from Santa Cruz Biotechnology (Dallas, TX, USA); VEGF was purchased from Abcam (Cambridge, MA, USA); Tubulin was purchased from DSHB (Iowa City, IA, USA); and all other remaining antibodies were purchased from Cell Signaling (Danvers, MA, USA). Secondary antibodies were purchased from Jackson ImmunoResearch (West Grove, PA, USA). Western blots were visualized with ECL Prime Western Blot Detection Reagent (GE Healthcare, Buckinghamshire, UK) and Odyssey Fc (Li-Cor, Lincoln, Nebraska, USA).
Results
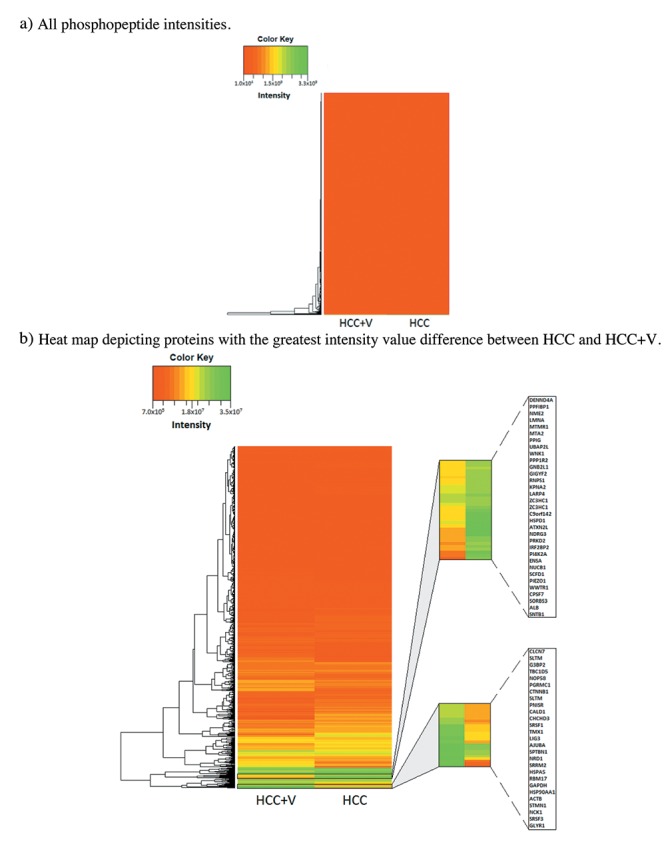
MS Overview. All results were obtained from the average of the MS biological replicates. Though there was a small subset of exclusive phosphopeptides, the overwhelming majority of phosphorylation events were common to both cell lines. Overall, MS analysis identified 2,382 shared phosphopeptides out of 3,712 peptide groups (Figure 1 and Table I). There were commonly 1-3 phosphorylations on each phosphopeptide, which subsequently totaled to 3,173 phosphosites (p-sites). Phosphorylated serine was over-represented among the identified p-sites at 85% (2,698/3,173). In contrast, threonine and tyrosine constituted a much smaller share of the total p-sites. Only 13% of the p-sites was phosphorylated threonine (426/3,173), with the rarest p-site identified of just 2% (49/3173) being phosphorylated tyrosine. Proteome Discoverer produced a ratio derived from peptides modified with heavy (13C2D6 ) vs. light (C2H6) dimethylation sites. This gave the relative abundance for the phosphopeptides as ratio of(HCC +V)/(HCC), ranging from 7.14 to 0.0285. Global intensity values were similar between the two conditions (Figure 2a). A small subset of phosphopeptides showing differential intensity was discernable when excluding the 10% highest and lowest values from the range (Figure 2b).
Figure 1. Experimental workflow. The sequence of events for each biological replicate, as well as the resulting quantified phosphopeptides and phosphosite amino acids averaged from the experiments.
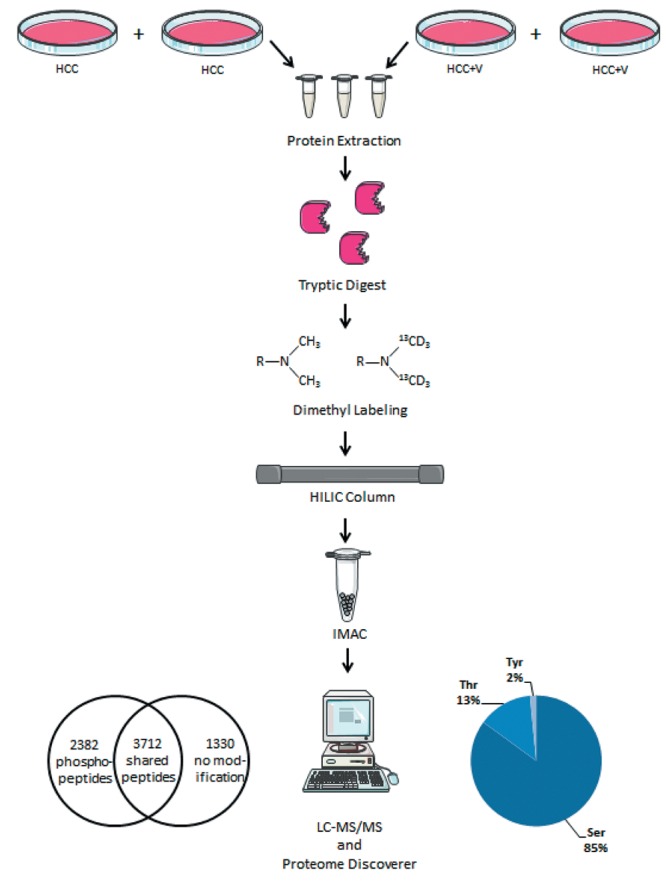
Table I. Phosphoproteome overview.
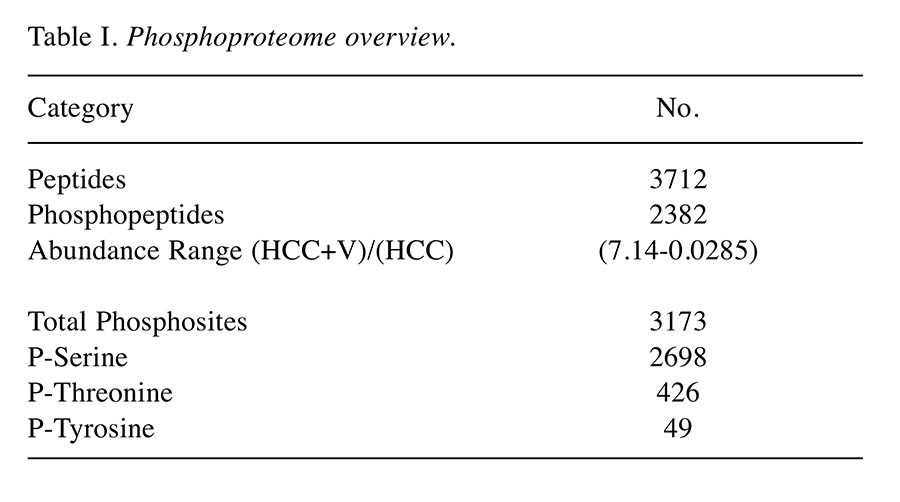
Figure 2. Intensity heat maps. (a) Heat map for all phosphopeptide values. (b) Heat map for phosphopeptides excluding top 10% and bottom 10% of intensity values.
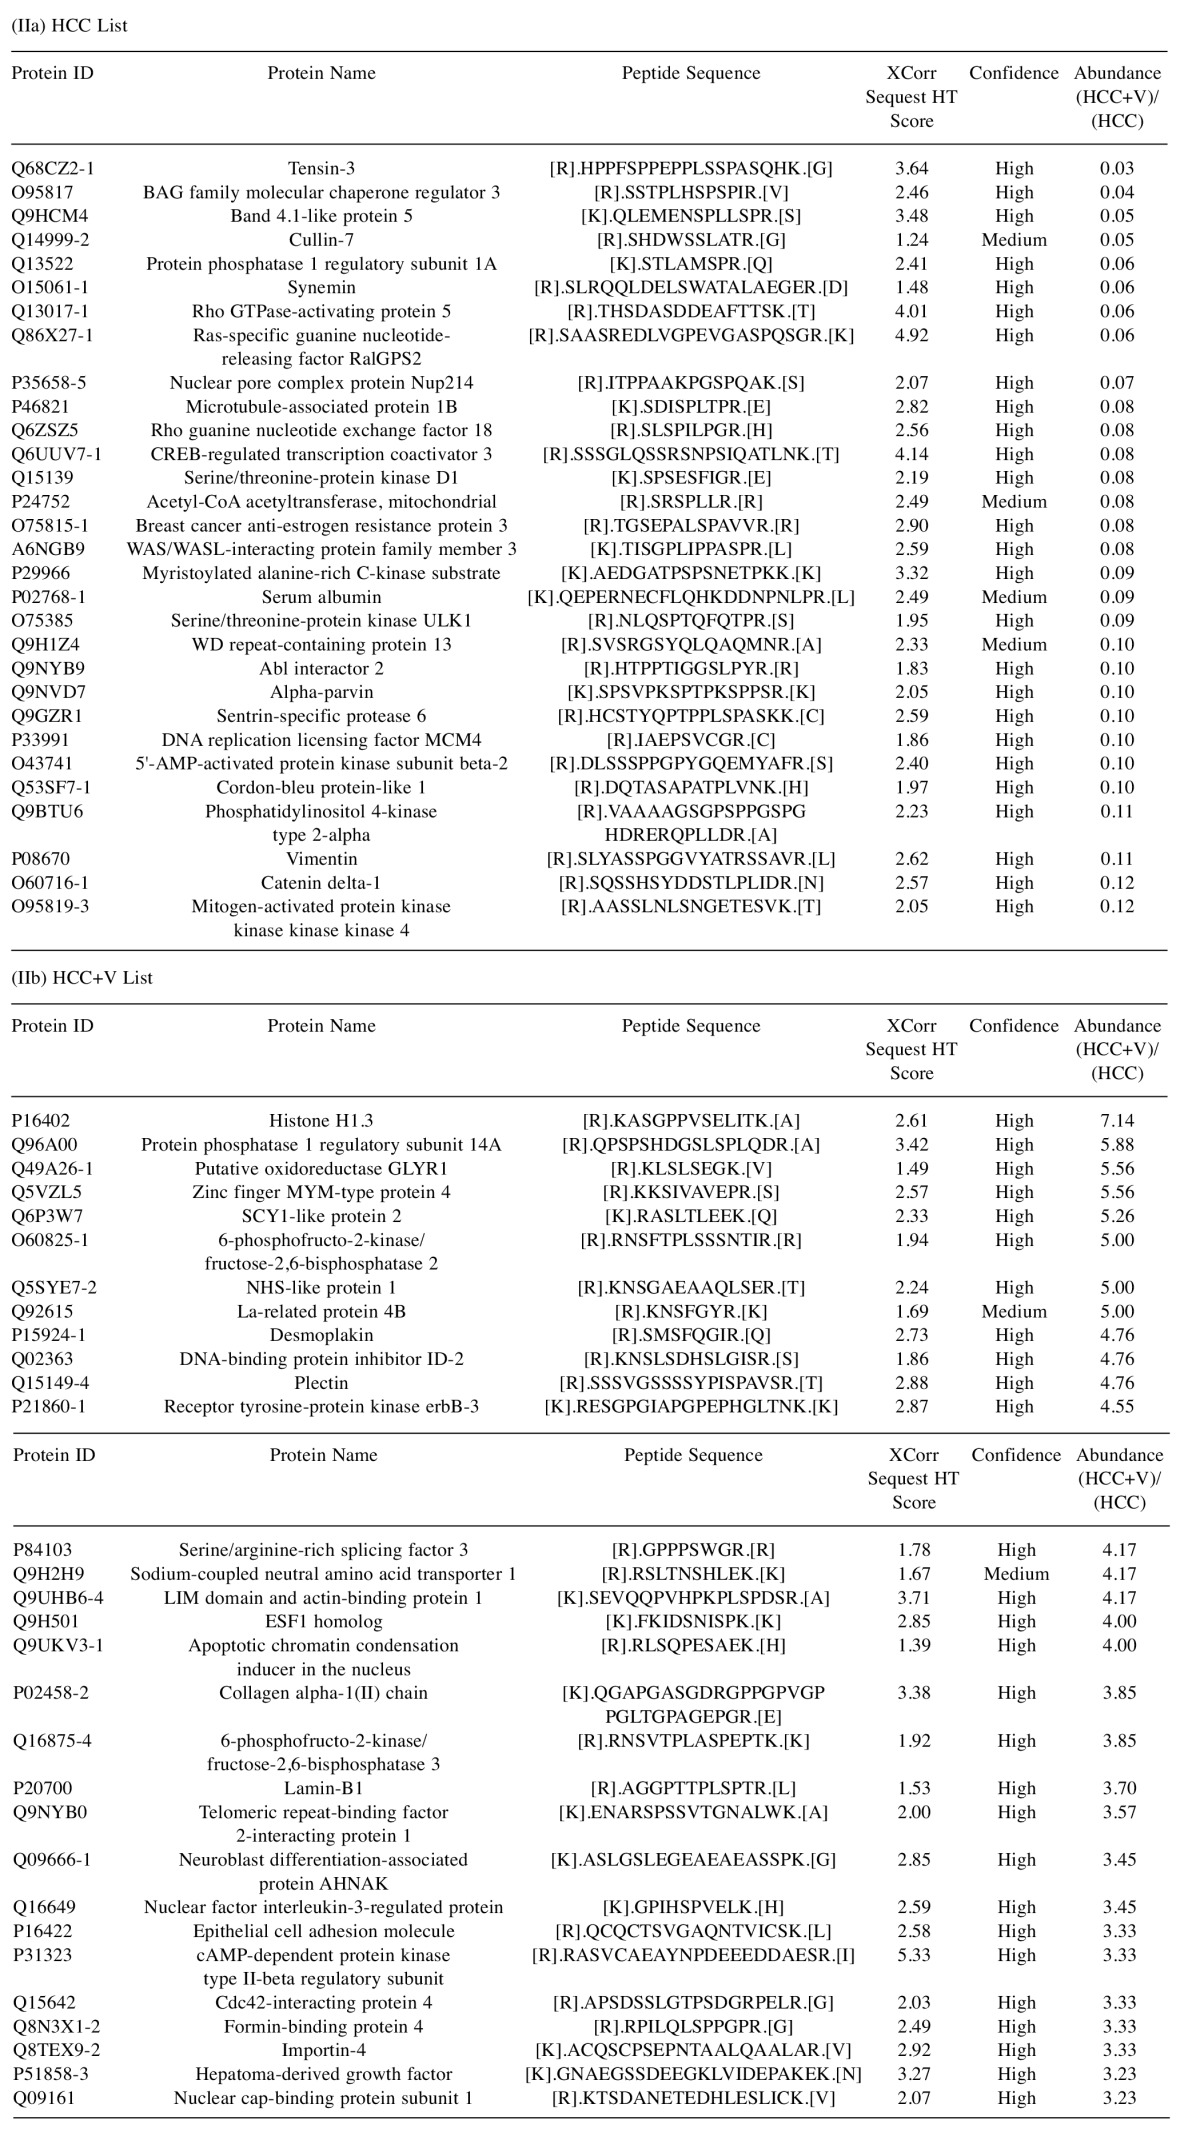
Most abundant phosphopeptides. The 30 most abundant phosphopeptides in HCC with and without virus are shown (Table II). The XCorr Sequest HT score ranges from 1.24 to 4.92 for HCC and from 1.39 to 5.33 for HCC+V. Majority of these scores correlated with a high hit confidence level (Table II). Gene ontology enrichment of this top subset revealed that most abundant proteins identified for HCC were pronounced for the biological process category of cytoskeleton organization (ID:GO:0007010, adjusted p=0.0186). Conversely, the HCC+V most abundant phosphopeptides predominantly belonged to the execution phase of apoptosis category (ID:GO:0097194, adjusted p=0.0307).
Table II. Most abundant phosphopeptides. List of the top 1% (top 30) most abundant phosphopeptides identified in (2a) HCC and (2b) HCC+V. Peptide stringency was set at a high ion cutoff score of FDR=5%.
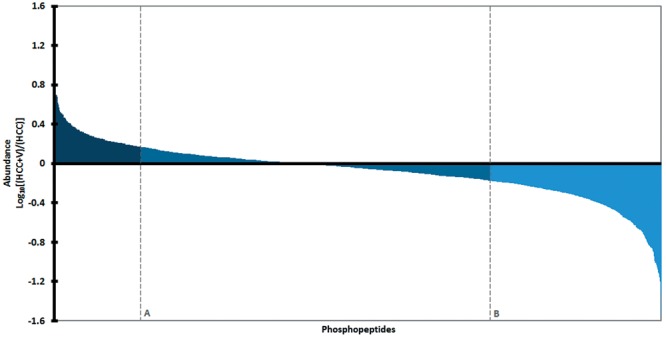
Phosphorylation fold change. Overall, there were more phosphopeptides with higher abundance in HCC compared to HCC+V. Three hundred and forty (14%) phosphopeptides had ≥1.5-fold abundance in HCC+V and 673 (28%) phosphopeptides had ≥1.5-fold abundance in HCC. To visually represent the phosphorylation fold change difference between the two conditions, the abundance ratio is depicted as Log10 [(HCC+V/HCC)] (Figure 3). Additionally, there were 1,369 other phosphopeptides that did not reach this 1.5-fold threshold.
Figure 3. Phosphorylation landscape. The protein abundance of phosphopeptides in the HCC and HCC+V abundance groups. The abundance groups are gated on a threshold of ≥1.5-fold higher relative abundance (dotted lines A and B), which is calculated as the ratio of HCC+V over HCC. Log10 of the relative abundance ratio is depicted, resulting in positive y-values (left of line A) for the HCC+V group and negative y-values (right of line B) for the HCC group.
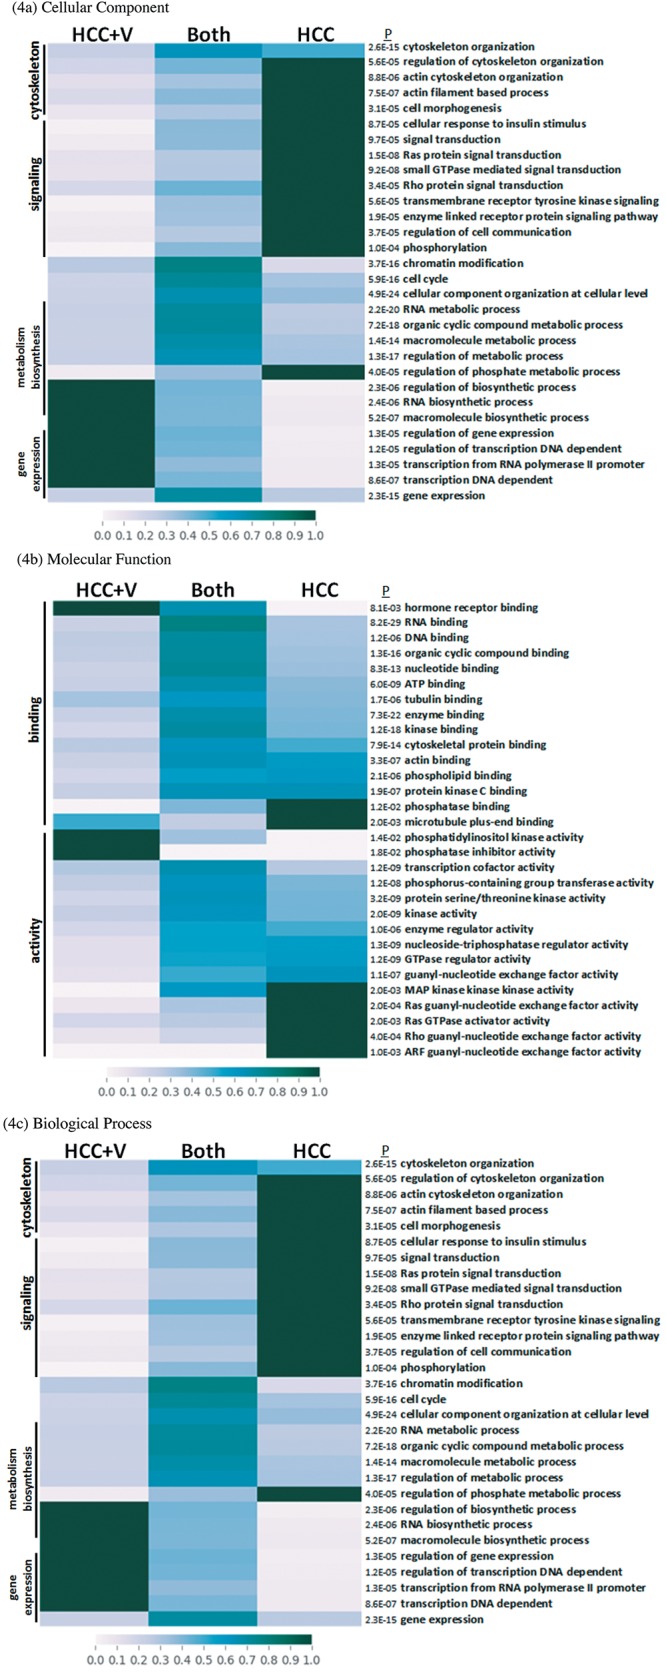
Functional analysis. Shared phosphopeptides were used for gene ontology (GO) enrichment to assess differences in cellular component, biological process, and molecular function. Outcomes of GO analysis are shown and classified into the three abundance groups: ≥1.5-fold in HCC, ≥1.5-fold in HCC+V, and <1.5-fold in HCC and HCC+V. Functional analysis revealed that HCC and HCC+V shared the most resemblance among cellular components (Figure 4a), with one exception being a subset of cytoskeletal categories (i.e. actin cytoskeleton) that were most abundant in HCC. Additionally, the two conditions had several similarities in molecular function (Figure 4b), especially among binding categories. However, the phosphoproteins among signaling categories like Ras/Rho GTPase activity were highest in the HCC abundance group. HCC and HCC+V differed most significantly when comparing biological processes (Figure 4c). The phosphoproteins within many biological process categories were prominent for very specific abundance groups. For instance, cytoskeletal dynamics and signaling transduction (i.e. response to insulin stimulus, Ras/Rho signal transduction) were predominantly enriched in HCC. Conversely, other biological processes such as regulation of gene expression and transcription were notable in HCC+V.
Figure 4. Functional analysis heat map. Comparison of gene ontology analysis organized by abundance groups: (HCC: ≥1.5-fold abundance in HCC, HCC+V: ≥1.5-fold abundance in HCC+V, and Both: <1.5-fold abundance in HCC and HCC+V). The number of phosphoproteins per abundance group is normalized to the total number of category proteins identified from the entire set of shared phosphopeptides. The heat maps with p-values (adjusted for multiple testing) are divided into (a) cellular component (b) molecular function and (4c) biological process.
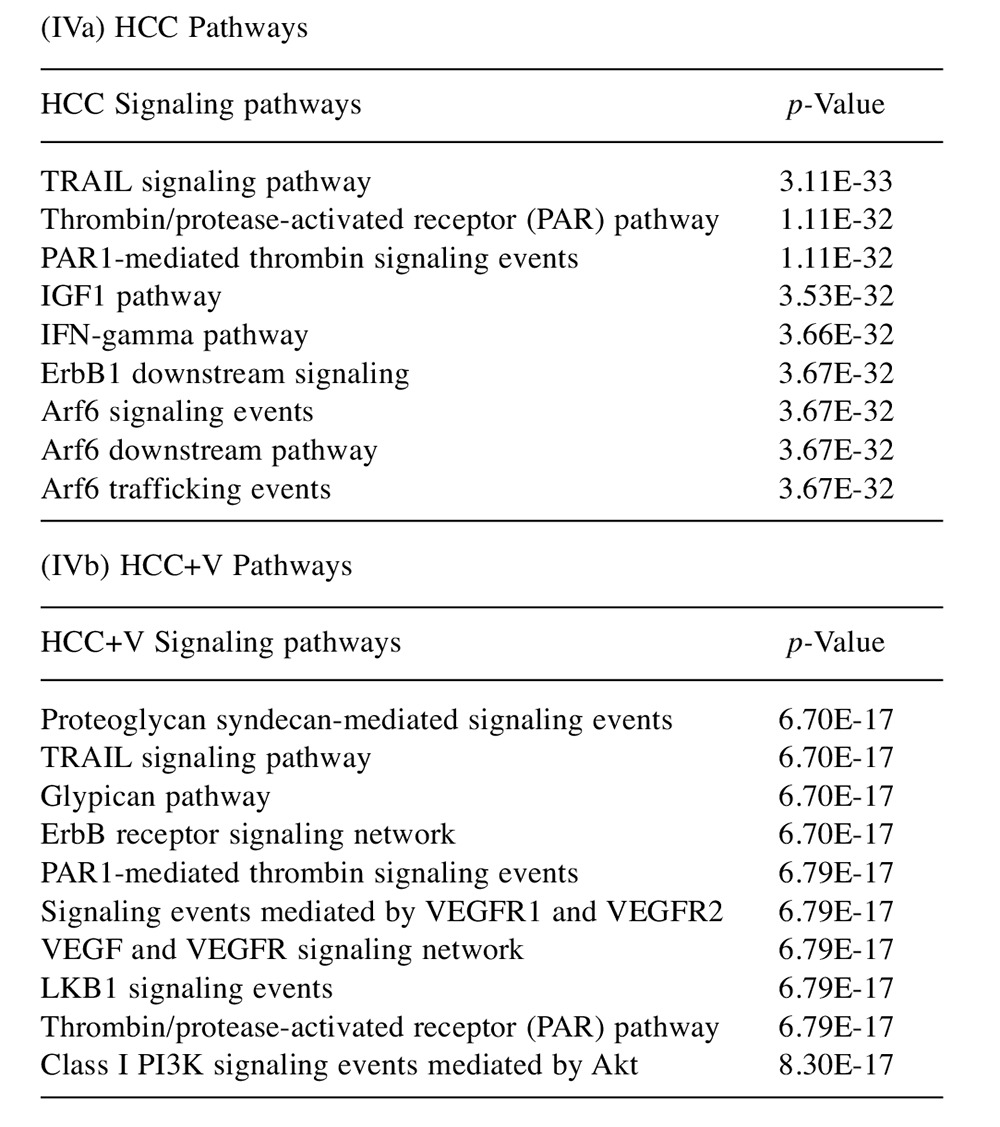
Protein network crosstalk and pathway analysis. The abundance groups were used to identify a defining network of proteins, whose crosstalk activity among signal transduction pathways may depict the cellular dynamics of liver cancer. The protein networks for HCC and HCC+V are composed of a set of 76 and 41 phosphoproteins respectively (Figure 5a and 5b). The network components and their abundances are also provided (Table III). The corresponding pathways that each network could be differentially regulating through phosphorylation are listed (Table IV). The HCC pathways included several Ras/GTPase mediated signaling transduction such as insulin-like growth factor 1 (IGF1) and ADP-ribosylation factor 6 (Arf6) pathways. In comparison, HCC+V pathways included vascular endothelial growth factor (VEGF) and PI3K/AKT signaling events. Additionally, there were certain pathways (TRAIL and PAR1 signaling) that were common to both networks.
Figure 5. Protein networks. Protein networks for (A) HCC and (B) HCC+V. Edges represent the following relationships: genetic interactions (green) physical interactions (red), pathway (light blue), predicted (orange), co-expression (purple), co-localization (dark blue), and shared protein domain (olive).
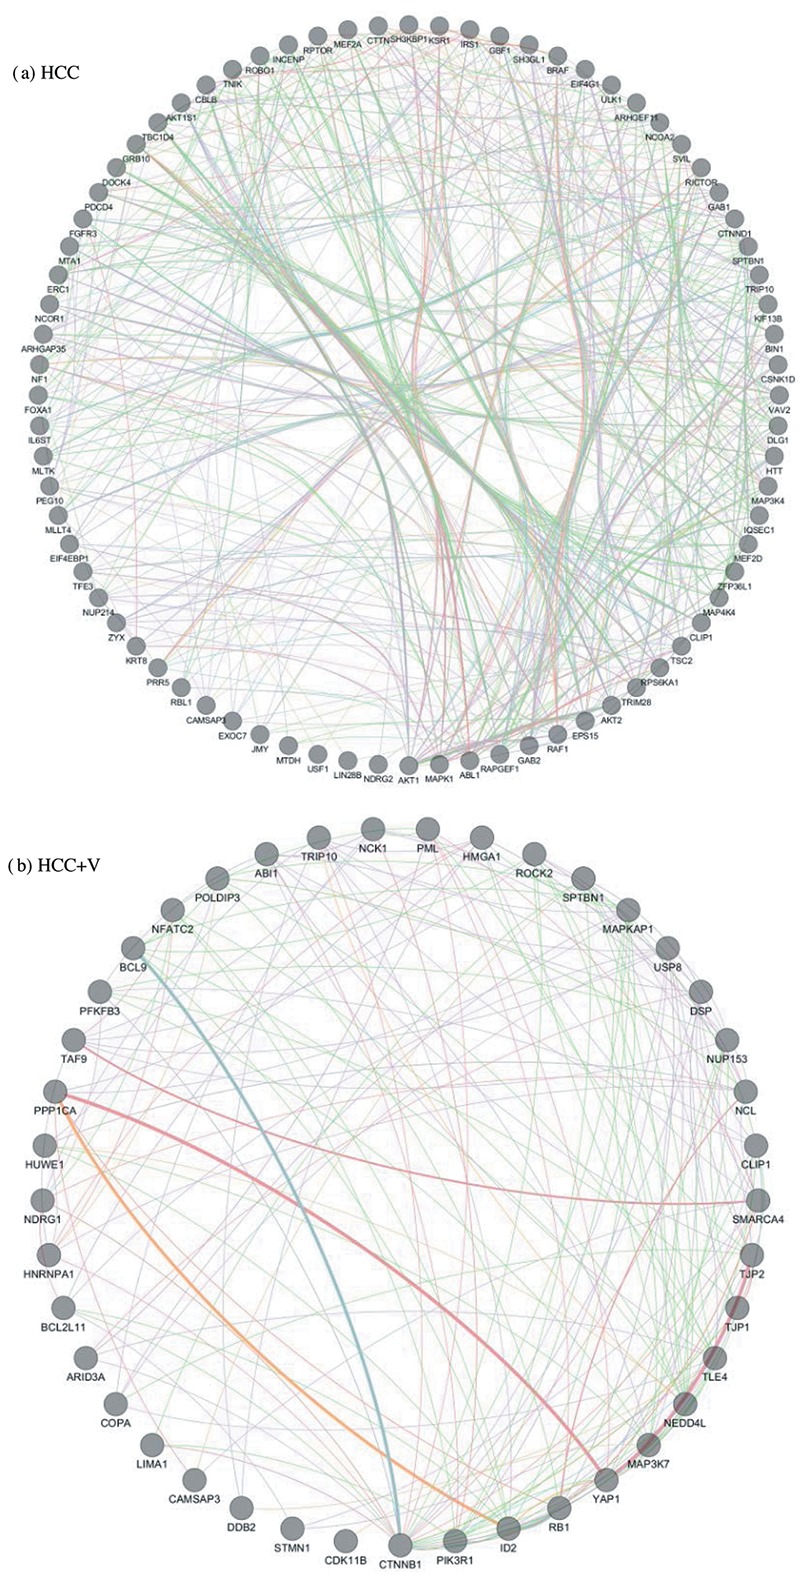
Table III. Phosphoprotein Crosstalk Networks. List of the phosphoprotein crosstalk networks generated from the (IIIa) HCC and (IIIb) HCC+V abundance groups. The abundance groups are gated on a threshold of ≥1.5-fold higher relative abundance.

Table IV. Phosphoprotein Crosstalk Signaling Pathways. List of the top signal transduction pathways effected by the phosphoprotein crosstalk networks with corresponding P-values (adjusted for multiple testing) for (IVa) HCC and (IVb) HCC+V.
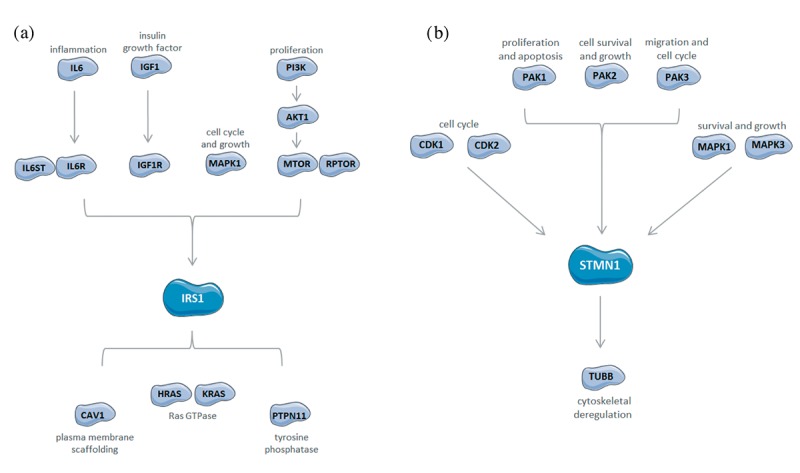
An individual protein was selected from the protein networks for further pathway analysis of upstream kinases and downstream targets to characterize the interactions that could be developed as candidates for further study. From the HCC network, insulin receptor substrate 1 (IRS1) participates in multiple pathways controlling cell growth, proliferation, and inflammatory response (Figure 6a). From the HCC+V network, stathmin (STMN1) is targeted by several kinases in the CDK, MAPK, and PAK families that affect cell proliferation and survival to subsequently induce cytoskeletal deregulation (Figure 6b).
Figure 6. Hypothetical protein targets. Diagrams with associated upstream and downstream effectors for targets of interest selected from the phosphoprotein crosstalk networks. Pathways shown are for (a) the HCC abundant protein IRS1 and (b) the HCC+V abundant protein STMN1.
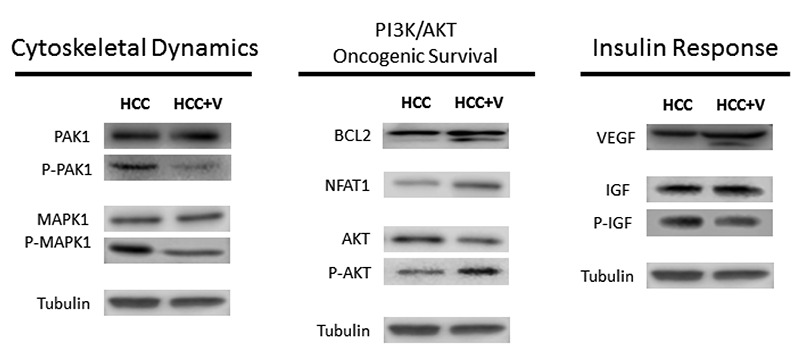
Initial validation. Western blots were performed for preliminary validation of mass spectrometry-quantified proteins and overall functional analysis. All selected proteins on western blot analysis, with the exception of PAK1, were parallel our MS quantitative data (Figure 7). These proteins were chosen for western blot validation based on network and pathway analyses suggesting their pivotal roles in viral or non-viral HCC.
Figure 7. Western blot validation. Pathway and functional analysis validation using western blot with total protein and selective phospho-antibodies. Proteins were sorted into pathway categories based on literature search.
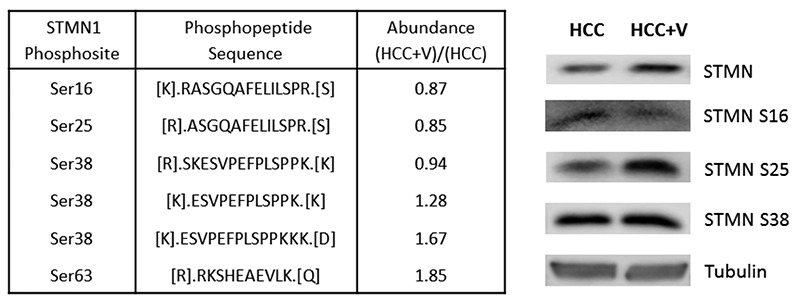
Stathmin. Of the proteins selected in our initial validation, STMN1 appears as a promising candidate for future study (Figure 8). MS data characterizes that HCV potentially controls downstream signals via phosphorylation of STMN1 at multiple serines (16, 25, 38, 63), but most predominantly via S38 and S63. Western blot analysis of phosphorylated STMN1 correlated with MS results for S16. However, western blot findings differed from MS by showing a higher protein expression for P-STMN1 S25 and no notable difference for P-STMN1 S38.
Figure 8. Stathmin phosphorylation comparison. The table shows phosphopeptide sequences and abundances for STMN1’s four phosphorylation sites from MS results, as well as western blot analysis for total STMN1 and its phosphorylated forms.
Discussion
While MS is a powerful tool to study the phosphoproteome and other PTMs, the overwhelming amount of information that can be generated requires a systematic approach to analyze the typically large data sets produced. A simple framework of narrowing-down a global phosphoproteomic screen by focusing on protein function, pathways, and networks, enables us to visualize how HCV may influence cancer growth and identify the protein candidates for future molecular testing. Herein we presented the first study analyzing the phosphorylation landscape of HCC cell lines with or without virus. We demonstrate that an IMAC enrichment technique is successful and suitable for relative phosphoproteomic quantitation. This method strongly detected phosphorylated serine, that could reflect that the natural distribution of phosphorylation sites in vitro is predominantly serine (12). A more selective antibody-based MS technique could overcome this limitation and might be necessary if tyrosine and threonine phosphorylation is of further interest (13,14). Historically, MS has been used for the identification of unmodified proteins. The capabilities of MS are enhanced by adding relative quantitation and focusing on PTMs like phosphorylation to explore the particular proteins that may be involved in differential regulation. This enables MS to more closely capture in vivoconditions that could more easily address clinical challenges such as screening for liver cancer in high risk patient populations. A current hurdle in the field of proteomics lies in the bioinformatics analysis of MS results, as there are numerous and diverse softwares available. In order to capture the dynamic cellular responses, discern relevant signals from noise, and define novel protein interactions, two core concepts facilitated our framework in interpreting the HCC and HCC+V phosphoproteomes. The first important step begins with asking the right questions of interest to guide data analysis. In our experience, having a very specific question can expedite how one strategically processes a large data set. For instance, our main question was to interrogate how HCV can influence liver cancer transformation and subsequently this question determined the various techniques we selected to further examine our data.
To address this question, we initially surveyed the MS results with the most global view of intensity and abundance. An initial assessment of intensity values appears similar for our experimental conditions, given the two cell lines are hepatocyte derived. Furthermore, when intensity values have a large range, differences may be misleadingly depicted as similar. By excluding the extreme intensity values (i.e. lowest and highest 10% values) previously hidden differences between the tested conditions can be unmasked. Looking at intensity could be one option to initially visualize different phosphopeptide molar responses and provide a comparison for quantitation values, as an extended view of intensity would logically progress towards a closer look at different protein abundances.
We began interrogating our results by looking at the 1% (top 30) most abundant hits for each experimental condition. Phosphoproteins pertaining to cytoskeletal dynamics were noted for HCC and phosphoproteins related to apoptosis were identified for HCC+V. Although this cursory examination is a simple step that can be used to start analysis, MS experiments should supplement these results with a more comprehensive look at protein dynamics to find deregulated pathways and functions that cannot be easily derived from the top hits. Given that changes in cellular dynamics may stem from large or small differences in protein levels, analysis should encompass the smaller subset of phosphopeptides with the highest abundance as well as those with lower abundance which may still influence relevant biological functions. Next, to be more inclusive of different protein levels than just the top 1%, we separated our phosphoproteome data into different thresholds of abundance. We focused our subsequent functional analysis on the population of ≥1.5-fold abundant phosphopeptides to narrow down proteins that may have a greater role in cellular dynamics based on this degree of quantitative changes within the cell. Although a threshold of 1.5 fold abundance was chosen for this data set, other studies have implemented a more conservative threshold (2.0-fold) for analysis (15,16). Selection of a more liberal or conservative threshold could be dictated by the total number of peptides obtained from MS. For instance, our abundance threshold (1.5-fold) may be considered more conservative within the context of a smaller data set. This approach is motivated by previous studies noting that significant targets may emerge from the combination of lower abundant proteins that may still be impacting important functional variation, even though their expression may not be the highest (17). By setting a ≥1.5-fold threshold we obtained approximately double the amount of HCC phosphopeptides for analysis compared to HCC+V. The disparity between these two groups could reflect the more limited amount of available MS database information for viral HCC. Furthermore, the smaller amount of HCC+V abundant phosphopeptides may be due to HCV infected hepatocytes predominantly utilizing a different PTM.
To further characterize this global difference between phosphopeptide abundance, our subsequent analysis seeks to investigate the functional features of each ≥1.5-fold abundant population. GO annotation of biological processes, molecular functions, and cellular components enabled us to visualize the functional landscape of each cell line. Given the two cell lines are hepatocyte derived, it is expected that the two cell lines share many similar cellular components of their phosphopeptides. Yet, the presence or absence of the virus has a more distinct impact on the molecular functions and biological processes of the identified phosphopeptides (Figure 4). HCC abundant phosphopeptides were primarily enriched among Ras/Rho signal transduction activity and cytoskeletal organization categories. This suggests that without the virus, HCC is influenced by deregulation of cell growth signaling pathways and cytoskeletal dynamics. In contrast, HCC+V abundant phosphopeptides were highest among certain gene expression categories such as regulation of transcription. The amount of HCC+V-abundant phosphopeptides in these categories could reflect how the virus activates differential pathways within the host cell to promote its own survival. Therefore, hepatocyte transformation and growth could occur through alternate means when cells are infected with hepatitis C.
To further elaborate on biological changes perturbed by the virus, we aimed to look at the signaling events that could be enhanced to examine the possible crosstalk among abundant phosphopeptides in HCC or HCC+V. Analysis identified distinctive protein networks that corresponded with different sets of signaling transduction pathways. While some of these pathways were shared, most were unique, presumably based on the presence or absence of the virus. Investigating the characteristic signaling of an experimental condition could be exploited for diagnostic or therapeutic development in multiple ways. One option is to use this method to identify any previously studied mechanisms that have known available agents, facilitating research of pathway inhibition or excitation. For example, our analysis suggests that the effect of the VEGF pathway (Table IV) in HCC+V could be easily studied by using inhibitors like bevacizumab (Avastin; Genentech Inc., South San Francisco, CA, USA) (18). In addition, this method of analysis can generate individual protein candidates for further research that have not been previously associated with HCC±V. By inspecting the crosstalk protein sets, one can choose a rational target that has both higher abundance and possible functional consequences through the manipulation of multiple pathways. For instance, we selected IRS1 from the HCC phosphoprotein network as a possible new candidate for research (Figure 6a). Similarly, the protein STMN1 was selected from the HCC+V set of crosstalk phosphoproteins as a target of interest for further study of viral infected HCC (Figure 6b).
Our analysis takes into account an inclusive spectrum of: the top 1% most abundant phosphoproteins from MS data, the set of >1.5-fold abundant proteins that could be influencing changes in biological dynamics and signaling pathways of interest, and even those proteins that may not be on the original MS data but are identified after bioinformatics analyses. This comprehensive strategy provides a basic framework for the logical classification of a large proteomic data set. The emphasis of such an approach is on functional changes within each experimental condition that may be driven by any degree of protein abundance. Specifically, if cellular function can be linked in a non-biased fashion to different changes in protein abundances, MS global data analyses would generate hypotheses that can more closely mirror in vivo conditions.
After extensive bioinformatics-driven hypotheses are generated, a second key concept in analyzing MS results must include well thought-out ways to validate the quantitation of the phosphopeptides. We used western blot to demonstrate that the MS results were measurable on the protein level (Figure 7). Western blot analysis was also utilized to validate the functional analysis of HCC and HCC+V. For instance, western blot results supported our signaling pathway analysis (Table IVb) that suggested higher p-AKT expression in HCC+V. The different p-AKT signal for our two cell lines is likely dependent on specific upstream pathways mediated by this kinase. Literature search also provided another component of validation, as other scientific studies supported our hypotheses that deregulation of Rho/GTPase (19), insulin metabolic (20), and PI3K/AKT pathways (21-23) may be responsible for differential growth between HCC and HCC+V.
One particular protein of significant interest after extensive analysis is STMN1. STMN1 is a cytoskeletal protein that regulates microtubule dynamics for cell-cycle, proliferation, and motility (24). Its tightly regulated phosphorylation/dephosphorylation controls cell cycle division and differentiation through inducing depolymerization from the microtubule plus end in a process referred to as “catastrophe” (25). Overexpressed in various cancers including prostate (26,27), breast (28,29), liver (30,31), and oral squamous cell (32,33), STMN1 is associated with increased proliferation, higher invasive potential, and chemo-resistance (34). Patients with endometrial tumors that highly express p-STMN S38 were also reported to have inferior prognosis (35). STMN1’s identification and quantitation on our MS data confirms literature and our hypothesis that this protein plays an important role in viral- mediated liver cancer transformation. MS data show STMN1 regulates HCC+V via all phosphosites (S16, S25, S38, S63) but most predominantly at S38 and S63 (Figure 8). However, this observation was not noted on western blot analysis. This discrepancy between antibody-mediated and mass spectrometry quantitation of protein levels may represent how MS technique has evolved over time to become more sensitive at detecting protein changes (36) . As a result, western blots should serve as a starting point for verification of MS quantitation while other techniques are used concurrently to explore biological/functional dynamics in depth.
Our strategy for the analysis of MS quantitative data is a simple function-focused workflow to investigate differences between two conditions, resulting in hypotheses for future study. These hypotheses can serve as a starting point on which additional experiments can build a more in-depth understanding of the underlying mechanisms that promote HCC with or without virus. However, several factors should be taken into consideration in order to make the most out of future MS experiments. Quantitation of a cell line’s phosphoproteome may be most useful in comparison to that cell line’s global proteome, taken from either pre-published literature or a parallel MS experiment (37). In a similar manner, if comparing the phosphoproteomes of different conditions (i.e. drug treatment) it is indispensable to have a control condition as a baseline for both the quantitation results and subsequent functional analysis (38). Likewise, multiple biological replicates for phosphoproteomic analysis ensure greater confidence in MS results (39). One concern to address when studying PTM like phosphorylation is the transient nature of these modifications, that may require samples from multiple time points to further validate proteomic data. Another limitation to our study is that the HCC+V cell line’s HCV replicon was engineered without certain viral elements that could affect infectivity (40). This may partially explain any discrepancies between the MS results utilizing a replicon in comparison to an unmodified HCV. Another challenge to contemplate is the differences between absolute and relative MS quantitation. In our experiment that compares only two cell lines, relative quantitation was appropriate. However, absolute quantitation may have more versatility in a broader range of experimental situations (41). Furthermore, the bioinformatics analysis of MS data relies on previously established databases, which can limit the scope and accuracy of our analysis. Lastly, proteomic analysis of patient samples could yield more rigorous data, especially when looking at the phospho-proteomic maps across different tissues.
While MS has many basic experimental uses, it also has promising applications in the clinical setting. Recent applications of this technique include utilizing MS for analysis of clinical patient samples and amassing this data into a resource for proteomic profiling to facilitate the prediction of patient survival, prognosis, and effective therapeutics (42). Pioneered at larger cancer centers such as the MD Anderson Hospital, this method of clinical proteomic profiling is growing in popularity and is starting to be implemented at cancer treatment centers worldwide (43). Although more standardized models are necessary, MS proteomics could possibly be combined with metabolomics to create a sophisticated screen to assess for biomarkers pertaining to disease relapse or cancer incidence in high risk patients. In the future, MS could be utilized to evaluate the risk of HCC development in HCV patients by screening for HCC+V characteristic targets or differential protein aggregates. MS would have an advantage over current microarrays and genetic panels used for clinical screening as proteins and their post-translational modifications have closer biological proximity compared to DNA (44). Similarly, the protein abundance detected by MS might not correlate with mRNA/cDNA amounts used in microarray analysis (45). While challenges remain with processing MS extensive datasets and establishing standardized models, MS quantitation is a versatile technique for studying the proteome and has great potential to become an important player in the diagnosis and treatment of HCC. By harnessing the quantitative power of MS to use differential protein abundances for the analysis of function, pathway, and protein networks, one transforms a complex dataset into a meaningful platform to generate future hypotheses.
Acknowledgements
This research utilized core support from the UCSD/UCLA NIDDK Diabetes Research Center P30DK063491. The Authors would like to thank Dr. Asim Dasgupta and Dr. Santanu Raychaudhuri (Department of Microbiology, Immunology, and Molecular Genetics; University of California Los Angeles) for providing us with the HCV replicon cell line. They thank Johnny Lin from the UCLA Statistical Consulting Center (Institute of Digital Research and Education; University of California Los Angeles) for his assistance with R software. They also thank Roxanna Khosravi and Dr. Jane Cox for editing assistance. Finally, they thank Sarah Bassilian for her help.
References
- 1.Whitmore SE, Lamont RJ. Tyrosine phosphorylation and bacterial virulence. Int J Oral Sci. 2012;4:1–6. doi: 10.1038/ijos.2012.6. [DOI] [PMC free article] [PubMed] [Google Scholar]
- 2.Scholz R, Imami K, Scott NE, Trimble WS, Foster LJ, Finlay BB. Novel Host Proteins and Signaling Pathways in Enteropathogenic E. coli Pathogenesis Identified by Global Phosphoproteome Analysis. Mol Cell Proteomics. 2015;14:1927–1945. doi: 10.1074/mcp.M114.046847. [DOI] [PMC free article] [PubMed] [Google Scholar]
- 3.Becker TM, Boyd SC, Mijatov B, Gowrishankar K, Snoyman S, Pupo GM, Scolyer RA, Mann GJ, Kefford RF, Zhang XD, Rizos H. Mutant B-RAF-Mcl-1 survival signaling depends on the STAT3 transcription factor. Oncogene. 2014;33:1158–1166. doi: 10.1038/onc.2013.45. [DOI] [PubMed] [Google Scholar]
- 4.Bouzakri K, Karlsson HK, Vestergaard H, Madsbad S, Christiansen E, Zierath JR. IRS-1 serine phosphorylation and insulin resistance in skeletal muscle from pancreas transplant recipients. Diabetes. 2006;55:785–791. doi: 10.2337/diabetes.55.03.06.db05-0796. [DOI] [PubMed] [Google Scholar]
- 5.Zappacosta F, Scott GF, Huddleston MJ, Annan RS. An optimized platform for hydrophilic interaction chromatography-immobilized metal affinity chromatography enables deep coverage of the rat liver phosphoproteome. J Proteome Res. 2015;14:997–1009. doi: 10.1021/pr501025e. [DOI] [PubMed] [Google Scholar]
- 6.Taus T, Kocher T, Pichler P, Paschke C, Schmidt A, Henrich C, Mechtler K. Universal and confident phosphorylation site localization using phosphoRS. J Proteome Res. 2011;10:5354–5362. doi: 10.1021/pr200611n. [DOI] [PubMed] [Google Scholar]
- 7.Bosch FX, Ribes J, Diaz M, Cleries R. Primary liver cancer: worldwide incidence and trends. Gastroenterology. 2004;127:S5–S16. doi: 10.1053/j.gastro.2004.09.011. [DOI] [PubMed] [Google Scholar]
- 8.Wallace MC, Preen D, Jeffrey GP, Adams LA. The evolving epidemiology of hepatocellular carcinoma: a global perspective. Expert Rev Gastroenterol Hepatol. 2015;9:765–779. doi: 10.1586/17474124.2015.1028363. [DOI] [PubMed] [Google Scholar]
- 9.Wilson-Grady JT, Haas W, Gygi SP. Quantitative comparison of the fasted and re-fed mouse liver phosphoproteomes using lower pH reductive dimethylation. Methods. 2013;61:277–286. doi: 10.1016/j.ymeth.2013.03.031. [DOI] [PubMed] [Google Scholar]
- 10.Rappsilber J, Mann M, Ishihama Y. Protocol for micro-purification, enrichment, pre-fractionation and storage of peptides for proteomics using StageTips. Nat Protoc. 2007;2:1896–1906. doi: 10.1038/nprot.2007.261. [DOI] [PubMed] [Google Scholar]
- 11.Shannon P, Markiel A, Ozier O, Baliga NS, Wang JT, Ramage D, Amin N, Schwikowski B, Ideker T. Cytoscape: a software environment for integrated models of biomolecular interaction networks. Genome Res. 2003;13:2498–2504. doi: 10.1101/gr.1239303. [DOI] [PMC free article] [PubMed] [Google Scholar]
- 12.Nita-Lazar A, Saito-Benz H, White FM. Quantitative phosphoproteomics by mass spectrometry: past, present, and future. Proteomics. 2008;8:4433–4443. doi: 10.1002/pmic.200800231. [DOI] [PMC free article] [PubMed] [Google Scholar]
- 13.Macek B, Mann M, Olsen JV. Global and site-specific quantitative phosphoproteomics: principles and applications. Annu Rev Pharmacol Toxicol. 2009;49:199–221. doi: 10.1146/annurev.pharmtox.011008.145606. [DOI] [PubMed] [Google Scholar]
- 14.van der Mijn JC, Labots M, Piersma SR, Pham TV, Knol JC, Broxterman HJ, Verheul HM, Jimenez CR. Evaluation of different phospho-tyrosine antibodies for label-free phosphoproteomics. J Proteomics. 2015;127:259–263. doi: 10.1016/j.jprot.2015.04.006. [DOI] [PubMed] [Google Scholar]
- 15.Humphrey SJ, Yang G, Yang P, Fazakerley DJ, Stockli J, Yang JY, James DE. Dynamic adipocyte phosphoproteome reveals that Akt directly regulates mTORC2. Cell Metab. 2013;17:1009–1020. doi: 10.1016/j.cmet.2013.04.010. [DOI] [PMC free article] [PubMed] [Google Scholar]
- 16.Nuhse TS, Bottrill AR, Jones AM, Peck SC. Quantitative phosphoproteomic analysis of plasma membrane proteins reveals regulatory mechanisms of plant innate immune responses. Plant J. 2007;51:931–940. doi: 10.1111/j.1365-313X.2007.03192.x. [DOI] [PMC free article] [PubMed] [Google Scholar]
- 17.Huang HL, Cendan CM, Roza C, Okuse K, Cramer R, Timms JF, Wood JN. Proteomic profiling of neuromas reveals alterations in protein composition and local protein synthesis in hyper-excitable nerves. Mol Pain. 2008;4:33. doi: 10.1186/1744-8069-4-33. [DOI] [PMC free article] [PubMed] [Google Scholar]
- 18.Hurwitz H, Fehrenbacher L, Novotny W, Cartwright T, Hainsworth J, Heim W, Berlin J, Baron A, Griffing S, Holmgren E, Ferrara N, Fyfe G, Rogers B, Ross R, Kabbinavar F. Bevacizumab plus irinotecan, fluorouracil, and leucovorin for metastatic colorectal cancer. N Engl J Med. 2004;350:2335–2342. doi: 10.1056/NEJMoa032691. [DOI] [PubMed] [Google Scholar]
- 19.Wong CM, Yam JW, Ching YP, Yau TO, Leung TH, Jin DY, Ng IO. Rho GTPase-activating protein deleted in liver cancer suppresses cell proliferation and invasion in hepatocellular carcinoma. Cancer Res. 2005;65:8861–8868. doi: 10.1158/0008-5472.CAN-05-1318. [DOI] [PubMed] [Google Scholar]
- 20.Tovar V, Alsinet C, Villanueva A, Hoshida Y, Chiang DY, Sole M, Thung S, Moyano S, Toffanin S, Minguez B, Cabellos L, Peix J, Schwartz M, Mazzaferro V, Bruix J, Llovet JM. IGF activation in a molecular subclass of hepatocellular carcinoma and pre-clinical efficacy of IGF-1R blockage. J Hepatol. 2010;52:550–559. doi: 10.1016/j.jhep.2010.01.015. [DOI] [PMC free article] [PubMed] [Google Scholar]
- 21.Mannova P, Beretta L. Activation of the N-Ras-PI3K-Akt-mTOR pathway by hepatitis C virus: control of cell survival and viral replication. J Virol. 2005;79:8742–8749. doi: 10.1128/JVI.79.14.8742-8749.2005. [DOI] [PMC free article] [PubMed] [Google Scholar]
- 22.Liu Z, Tian Y, Machida K, Lai MM, Luo G, Foung SK, Ou JH. Transient activation of the PI3K-AKT pathway by hepatitis C virus to enhance viral entry. J Biol Chem. 2012;287:41922–41930. doi: 10.1074/jbc.M112.414789. [DOI] [PMC free article] [PubMed] [Google Scholar]
- 23.Cheng D, Zhang L, Yang G, Zhao L, Peng F, Tian Y, Xiao X, Chung RT, Gong G. Hepatitis C virus NS5A drives a PTEN-PI3K/Akt feedback loop to support cell survival. Liver Int. 2015;35:1682–1691. doi: 10.1111/liv.12733. [DOI] [PubMed] [Google Scholar]
- 24.Belletti B, Nicoloso MS, Schiappacassi M, Berton S, Lovat F, Wolf K, Canzonieri V, D'Andrea S, Zucchetto A, Friedl P, Colombatti A, Baldassarre G. Stathmin activity influences sarcoma cell shape, motility, and metastatic potential. Mol Biol Cell. 2008;19:2003–2013. doi: 10.1091/mbc.E07-09-0894. [DOI] [PMC free article] [PubMed] [Google Scholar]
- 25.Rubin CI, Atweh GF. The role of stathmin in the regulation of the cell cycle. J Cell Biochem. 2004;93:242–250. doi: 10.1002/jcb.20187. [DOI] [PubMed] [Google Scholar]
- 26.Friedrich B, Gronberg H, Landstrom M, Gullberg M, Bergh A. Differentiation-stage specific expression of oncoprotein 18 in human and rat prostatic adenocarcinoma. Prostate. 1995;27:102–109. doi: 10.1002/pros.2990270207. [DOI] [PubMed] [Google Scholar]
- 27.Ghosh R, Gu G, Tillman E, Yuan J, Wang Y, Fazli L, Rennie PS, Kasper S. Increased expression and differential phosphorylation of stathmin may promote prostate cancer progression. Prostate. 2007;67:1038–1052. doi: 10.1002/pros.20601. [DOI] [PubMed] [Google Scholar]
- 28.Curmi PA, Nogues C, Lachkar S, Carelle N, Gonthier MP, Sobel A, Lidereau R, Bieche I. Overexpression of stathmin in breast carcinomas points out to highly proliferative tumours. Br J Cancer. 2000;82:142–150. doi: 10.1054/bjoc.1999.0891. [DOI] [PMC free article] [PubMed] [Google Scholar]
- 29.Golouh R, Cufer T, Sadikov A, Nussdorfer P, Usher PA, Brunner N, Schmitt M, Lesche R, Maier S, Timmermans M, Foekens JA, Martens JW. The prognostic value of Stathmin-1, S100A2, and SYK proteins in ER-positive primary breast cancer patients treated with adjuvant tamoxifen monotherapy: an immunohistochemical study. Breast Cancer Res Treat. 2008;110:317–326. doi: 10.1007/s10549-007-9724-3. [DOI] [PubMed] [Google Scholar]
- 30.Yuan RH, Jeng YM, Chen HL, Lai PL, Pan HW, Hsieh FJ, Lin CY, Lee PH, Hsu HC. Stathmin overexpression cooperates with p53 mutation and osteopontin overexpression, and is associated with tumour progression, early recurrence, and poor prognosis in hepatocellular carcinoma. J Pathol. 2006;209:549–558. doi: 10.1002/path.2011. [DOI] [PubMed] [Google Scholar]
- 31.Hsieh SY, Huang SF, Yu MC, Yeh TS, Chen TC, Lin YJ, Chang CJ, Sung CM, Lee YL, Hsu CY. Stathmin1 overexpression associated with polyploidy, tumor-cell invasion, early recurrence, and poor prognosis in human hepatoma. Mol Carcinog. 2010;49:476–487. doi: 10.1002/mc.20627. [DOI] [PubMed] [Google Scholar]
- 32.Kouzu Y, Uzawa K, Koike H, Saito K, Nakashima D, Higo M, Endo Y, Kasamatsu A, Shiiba M, Bukawa H, Yokoe H, Tanzawa H. Overexpression of stathmin in oral squamous-cell carcinoma: correlation with tumour progression and poor prognosis. Br J Cancer. 2006;94:717–723. doi: 10.1038/sj.bjc.6602991. [DOI] [PMC free article] [PubMed] [Google Scholar]
- 33.Harada K, Ferdous T, Harada T, Ueyama U. High expression of stathmin 1 is a strong prognostic marker in oral squamous cell carcinoma patients treated by docetaxel-containing regimens. Clin Exp Med. 2015 doi: 10.1007/s10238-015-0403-0. [DOI] [PubMed] [Google Scholar]
- 34.Kavallaris M. Microtubules and resistance to tubulin-binding agents. Nat Rev Cancer. 2010;10:194–204. doi: 10.1038/nrc2803. [DOI] [PubMed] [Google Scholar]
- 35.Wik E, Birkeland E, Trovik J, Werner HM, Hoivik EA, Mjos S, Krakstad C, Kusonmano K, Mauland K, Stefansson IM, Holst F, Petersen K, Oyan AM, Simon R, Kalland KH, Ricketts W, Akslen LA, Salvesen HB. High phospho-Stathmin(Serine38) expression identifies aggressive endometrial cancer and suggests an association with PI3K inhibition. Clin Cancer Res. 2013;19:2331–2341. doi: 10.1158/1078-0432.CCR-12-3413. [DOI] [PubMed] [Google Scholar]
- 36.Mann M. Can proteomics retire the western blot? J Proteome Res. 2008;7:3065. doi: 10.1021/pr800463v. [DOI] [PubMed] [Google Scholar]
- 37.Wu R, Dephoure N, Haas W, Huttlin EL, Zhai B, Sowa ME, Gygi SP. Correct interpretation of comprehensive phospho-rylation dynamics requires normalization by protein expression changes. Mol Cell Proteomics. 2011;10:M111 009654. doi: 10.1074/mcp.M111.009654. [DOI] [PMC free article] [PubMed] [Google Scholar]
- 38.Bennetzen MV, Marino G, Pultz D, Morselli E, Faergeman NJ, Kroemer G, Andersen JS. Phosphoproteomic analysis of cells treated with longevity-related autophagy inducers. Cell Cycle. 2012;11:1827–1840. doi: 10.4161/cc.20233. [DOI] [PubMed] [Google Scholar]
- 39.Karp NA, Lilley KS. Design and analysis issues in quantitative proteomics studies. Proteomics. 2007;7(Suppl 1):42–50. doi: 10.1002/pmic.200700683. [DOI] [PubMed] [Google Scholar]
- 40.Bartenschlager R. Hepatitis C virus replicons: potential role for drug development. Nat Rev Drug Discov. 2002;1:911–916. doi: 10.1038/nrd942. [DOI] [PubMed] [Google Scholar]
- 41.Kirkpatrick DS, Gerber SA, Gygi SP. The absolute quantification strategy: a general procedure for the quantification of proteins and post-translational modifications. Methods. 2005;35:265–273. doi: 10.1016/j.ymeth.2004.08.018. [DOI] [PubMed] [Google Scholar]
- 42.Yuan Y, Van Allen EM, Omberg L, Wagle N, Amin-Mansour A, Sokolov A, Byers LA, Xu Y, Hess KR, Diao L, Han L, Huang X, Lawrence MS, Weinstein JN, Stuart JM, Mills GB, Garraway LA, Margolin AA, Getz G, Liang H. Assessing the clinical utility of cancer genomic and proteomic data across tumor types. Nat Biotechnol. 2014;32:644–652. doi: 10.1038/nbt.2940. [DOI] [PMC free article] [PubMed] [Google Scholar]
- 43.MD Anderson named as one of two Genome Characterization Centers. MD Anderson News Release. 2015 [Google Scholar]
- 44.Witze ES, Old WM, Resing KA, Ahn NG. Mapping protein post-translational modifications with mass spectrometry. Nat Methods. 2007;4:798–806. doi: 10.1038/nmeth1100. [DOI] [PubMed] [Google Scholar]
- 45.Margolin AA, Califano A. Theory and limitations of genetic network inference from microarray data. Ann NY Acad Sci. 2007;1115:51–72. doi: 10.1196/annals.1407.019. [DOI] [PubMed] [Google Scholar]


