Abstract
Goal
Abnormalities of microvascular morphology have been associated with tumor angiogenesis for more than a decade, and are believed to be intimately related to both tumor malignancy and response to treatment. However, the study of these vascular changes in-vivo has been challenged due to the lack of imaging approaches which can assess the microvasculature in 3-D volumes non-invasively. Here, we use contrast-enhanced “acoustic angiography” ultrasound imaging to observe and quantify heterogeneity in vascular morphology around solid tumors.
Methods
Acoustic angiography, a recent advance in contrast-enhanced ultrasound imaging, generates high resolution microvascular images unlike anything possible with standard ultrasound imaging techniques. Acoustic angiography images of a genetically engineered mouse breast cancer model were acquired to develop an image acquisition and processing routine that isolated radially expanding regions of a 3-D image from the tumor boundary to the edge of the imaging field for assessment of vascular morphology of tumor and surrounding vessels.
Results
Quantitative analysis of vessel tortuosity for the tissue surrounding tumors 3 to 7 mm in diameter revealed that tortuosity decreased in a region 6 to 10 mm from the tumor boundary, but was still significantly elevated when compared to control vasculature.
Conclusion
Our analysis of angiogenesis-induced changes in the vasculature outside the tumor margin reveals that the extent of abnormal tortuosity extends significantly beyond the primary tumor mass.
Significance
Visualization of abnormal vascular tortuosity may make acoustic angiography an invaluable tool for early tumor detection based on quantifying the vascular footprint of small tumors and a sensitive method for understanding changes in the vascular microenvironment during tumor progression.
Index Terms: Acoustic angiography, angiogenesis, spatial heterogeneity, tortuosity, ultrasound
I. INTRODUCTION
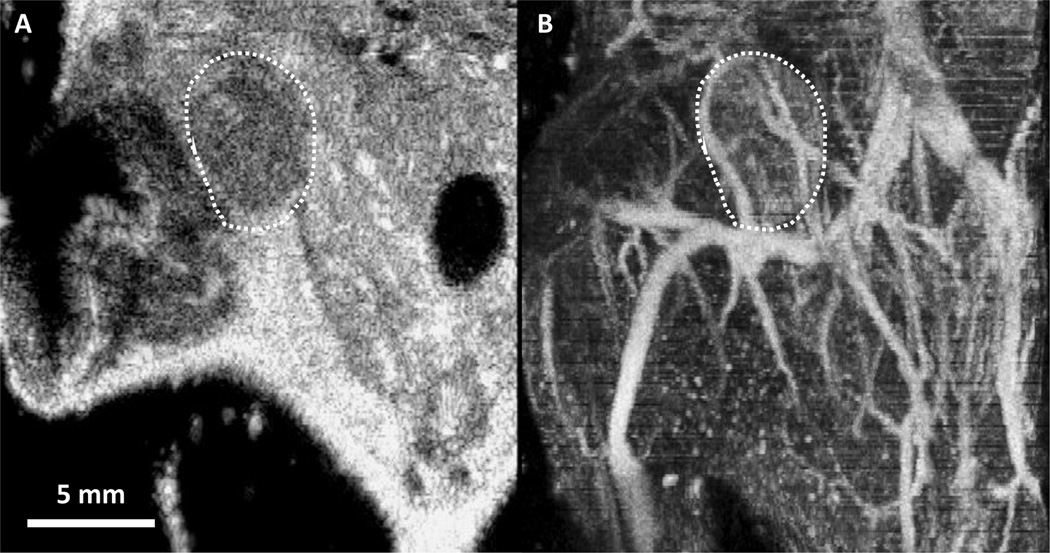
Acoustic angiography is a novel microvascular imaging technique that uses prototype dual frequency transducer technology to enable non-invasive, in vivo imaging of microbubble contrast agents [1, 2]. Using a low frequency transmit element (4 MHz) coupled with a high frequency receive element (25 MHz), high resolution images of vasculature are generated by isolating the broadband superharmonic microbubble response and eliminating lower frequency tissue response [3]. This imaging system can resolve blood vessels at scales not possible with standard ultrasound or conventional contrast imaging techniques (approximately 100–200 µm in diameter), and with minimal background signal from tissue [1]. The ability to image in high resolution, with excellent contrast specificity, enables resolution of small vessels and segmentation of individual vessels for further morphological analysis. Figure 1 shows a conventional ultrasound image in panel A, in comparison with a maximum-intensity projected image of three-dimensional (3-D) acoustic angiography image data showing microvasculature without tissue background in panel B.
Figure 1.
(A) 2-D frame of a traditional ultrasound B-mode image in the coronal plane, through the center of a mouse mammary pad tumor delineated by the white dashed outline. (B) Maximum intensity projection of a 3-D acoustic angiography image volume containing the tumor and surrounding tissue corresponding to panel A. This comparison illustrates the unique capability of acoustic angiography to depict in-vivo microvasculature
Cancer angiogenesis results in abnormal vascular networks including characteristically bent and twisted, “tortuous”, blood vessels, as well as chaotic branching patterns and increased vessel size, density, and permeability [4]. Recent acoustic angiography studies have characterized the tortuosity of tumor vasculature and found it to be significantly higher than that of control tissue [5, 6]. However the presence of a tumor and its effect on the 3-D morphology and spatial variability of surrounding vasculature has not yet been characterized quantitatively using ultrasound. By combining acoustic angiography with an image processing technique that isolates concentric regions of a volumetric image data set with increasing radii, we are able to systematically analyze the heterogeneity in vascular structure within a single image volume. This algorithm enabled us to characterize the tortuosity of blood vessels in near-spherical tissue regions including the tumor mass itself and larger regions encompassing tissue at a distance three to four times the radius of the tumor region.
While the gold standard for tissue microvascular analysis, histology, has shown destabilization of vascular tissue distal to a tumor mass, this technique is limited in application because the tissue of interest must be excised, making it difficult to analyze continuously varying spatial relationships in microvasculature [10]. However, imaging techniques such as intravital microscopy enable longitudinal characterization of tumor vascular morphology at very high resolutions. Previous work in intravital microscopy has attempted to characterize the heterogeneity of vasculature surrounding a tumor and identified distinct regions of tissue directly adjacent to the tumor that exhibit different vascular morphologies [7, 8]. While intravital imaging has very high spatial resolution, the tumor tissue must be exposed through an invasive procedure and the field of view is on the order of 1 mm [9], thus limiting the scope of applications to very small tumor models. Ex vivo studies of tumor angiogenesis have utilized vessel casting followed by micro-computed tomography (µCT) or micro-magnetic resonance imaging (µMRI) to characterize morphological properties such as vessel size, vessel branching, vascular density, and tortuosity [10, 11]. Through vessel casting and µCT imaging of a carcinoma xenograft tumor model, the tortuosity of the vessels surrounding the tumor mass was found to increase as the tumor progressed [10]. Much like histology, µMRI and µCT vessel imaging require the excision of the vascular tissue mass and do not allow for longitudinal analysis within the same specimen. Furthermore, the high cost of µMRI and the potential for radiation exposure when using µCT limit the utility of these imaging modalities for large studies.
Acoustic angiography offers a non-invasive method for quantitative characterization of vasculature, allowing longitudinal monitoring of vascular structure within and surrounding a tumor mass. Given this advantage, the combination of acoustic angiography and the proposed image processing and analysis technique will be useful in understanding the dynamics of the tumor environment, observing the effects of a tumor mass on the proximal and distal tissue vasculature, and monitoring therapeutic tumor response. We hypothesize that by using this novel technique we can observe tissue vasculature directly surrounding tumors to be highly tortuous, while the vasculature distal to the tumor but within the same field of view, is expected to exhibit significantly decreased vessel tortuosity with increasing distance from the tumor margin.
II. METHODS
A. Image Acquisition
All protocols were approved by the University of North Carolina Institutional Animal Care and Use Committee. The animal model used for this study was a genetically engineered C3(1)/Tag mouse model of basal breast cancer that develops spontaneous tumors in the mammary pad [12]. A modified Vevo 770 ultrasound scanner (VisualSonics, Toronto, CA) was used with an custom dual frequency transducer for acoustic angiography imaging [1]. Two sets of images of the inguinal mammary pads were acquired for each mouse: the conventional brightness modulated (B-mode) images were obtained using the high frequency element, and acoustic angiography images were acquired using dual frequency mode by transmitting with the low frequency element and receiving with the high frequency element. During the acoustic angiography imaging session a lipid-encapsulated microbubble contrast agent made in-house similar to DEFINITY® (Lantheus Medical Imaging, Inc.) was infused through a 27 gauge tail-vein catheter at a rate of 1.5 × 10⁸ microbubbles/minute, and a 3-D motion stage was utilized to acquire 2-D images with an interframe step size of 100 µm, across a distance spanning approximately 3 cm. In order to assess the effects of a tumor on the surrounding microvasculature, 10 acoustic angiography image volumes, each containing a single tumor between 3 to 7 mm in diameter, were selected from 9 animals. In one animal, a single tumor was present in both the left and right inguinal mammary pads. Each tumor was imaged separately for inclusion in this study and were considered independent because the tumors occurred in different mammary pads and data was acquired in different image volumes. Additionally, 10 age-matched, healthy littermates without tumors were selected as controls, yielding 20 image volumes of abdominal vasculature containing the left and right mammary pads.
B. Image Processing
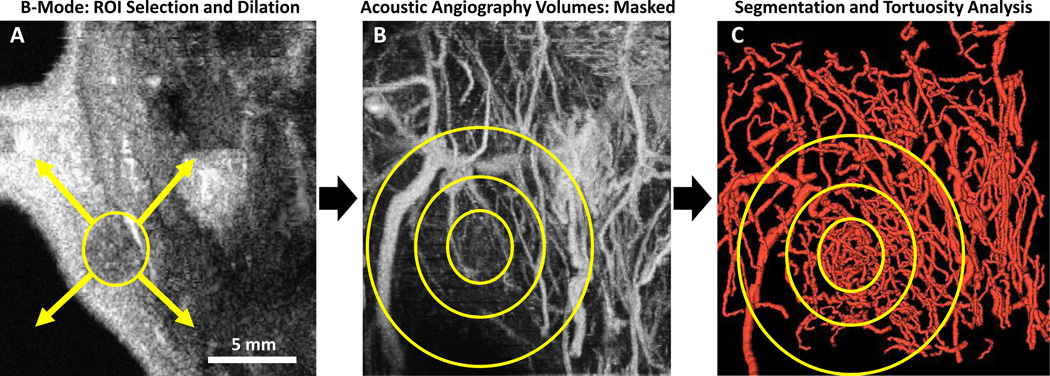
Images were resampled using linear interpolation in MATLAB (The MathWorks Inc., Natick, MA) to create isotropic voxels within the 25×25×30 mm (width × depth × scan length) field of view. A MATLAB analysis routine was developed to isolate concentric regions with increasing size in order to quantify vascular tortuosity proximal and distal to a tumor mass. First the tumor region of interest (ROI) was manually defined across the 3-D image volume using polygonal ROIs defined in each 2-D plane. The 3-D tumor ROI was dilated using a spherical structuring element to create multiple binary masks with increasing size. The masks were then applied to the acoustic angiography image volumes, as depicted in Figure 2, and image masks were gradually enlarged by 2 mm in every direction until the edge of the acoustic angiography image volume was reached. Manual segmentations are naturally user-dependent and potential variability in ROIs could be mitigated by employing more automated segmentation methods. However, the current method ensures that tumors are completely contained by the smallest ROI analyzed by dilating the manually-defined ROI by 2 mm before vessel segmentation. Due to the nature of a maximum intensity projection image (seen in Figure 2B), some overlapping blood vessels may be obscured in the projected image but are present in the 3-D image data and visible in the segmented vessel rendering (Figure 2C).
Figure 2.
(A) Standard B-mode image (2-D) in the coronal plane, reconstructed from 3-D image data. Illustration depicts an idealized section of a 3-D tumor ROI and dilation in all directions to larger ROIs for selection of the concentric tissue regions isolated for vessel segmentation. (B) Acoustic Angiography image (maximum intensity projection of a 3-D image volume) of the tumor and surrounding tissue, with simplified representations of growing ROIs used to mask the acoustic angiography image volume. (C) Rendering of vessels segmented from each ROI, with representative analysis regions overlaid for explanation. All image acquisition, ROI selection, and analysis was performed in 3-D. ROI outlines are for illustration purposes.
C. Vessel Segmentation
The vessels in each concentric region were segmented using multi-scale ridge regression with manually defined seed points [13]. In order to account for the tortuosity at the tumor boundary and to increase the number of vessel samples in the smallest ROIs, the tumor region was defined as the tumor mass and 2 mm of surrounding tissue. Each subsequent region of tissue for analysis was formed by increasing the boundary of the prior region radially by 2 mm. As the region of interest grew radially from the tumor, vessels across regions were concatenated. In control images, vessels were segmented from the entire image volume with no preference to vessel location.
D. Tortuosity Analysis
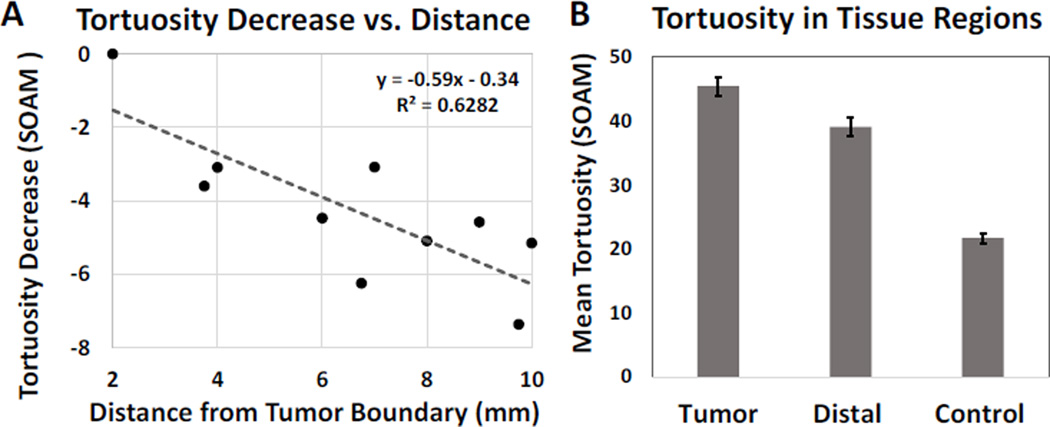
The sum of angles metric (SOAM) measures the total sum of curvature over the path length of an unbranched vessel segment by measuring the angle between successive trios of points defining the vessel centerline and normalizing by the path length [14], resulting in a metric with units of radians/cm. This tortuosity metric best quantifies vascular morphology of high frequency oscillations in the form of tight coils and sinuous curves [14]. In the vessel segmentation process, inaccurate vessel segmentations were occasionally observed visually. These artifacts were removed from the data sets by calculating the ratio between the length of the vessel and the distance between vessel endpoints, and eliminating vessels in which this ratio exceeded 2, a value determined empirically. The mean sum of angles metric was calculated for the vessels in each region, and tortuosity for all regions of each tumor were normalized by subtracting the mean SOAM value of the tumor ROI. Figure 3 shows summary plot of normalized tortuosity vs. distance from tumor to illustrate the decrease in tortuosity associated with distance from the tumor boundary. Segmented vessels were also rendered and color coded by SOAM tortuosity (Figure 4) using custom code integrated with VesselView (www.tubetk.org).
Figure 3.
(A) Mean sum of angles metric (SOAM) for distances 2–10 mm from tumor margin and fitted linear regression model. Tortuosity values were normalized to the tumor region via subtraction of the mean, and averaged across regions defined by their radial distance from the tumor boundary. Vessel tortuosity decreases significantly with increasing distance from the tumor region, with R2>0.5 and p=0.002. (B) Mean and standard error of SOAM tortuosity values of the tumor, distal and control tissue regions. Each group is statistically different from the others based on ANOVA and Tukey HSD tests, with p<0.01 for all tests.
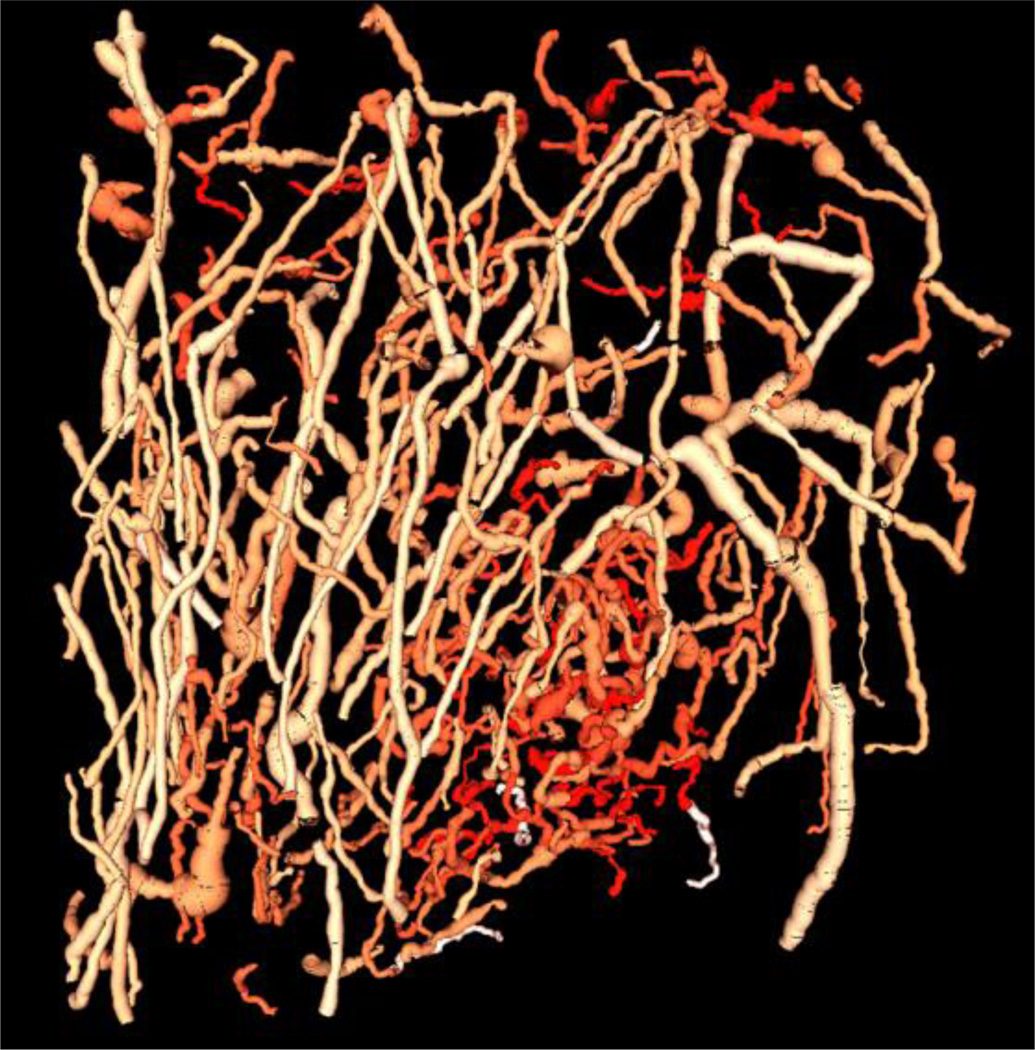
Figure 4.
Color map rendering of the SOAM values for each blood vessel isolated from the acoustic angiography image volume. Intense reds indicate higher SOAM values which are concentrated in the tumor region, while less intense red colors indicate lower SOAM values. This image was generated in VesselView (www.tubetk.org) using custom code provided by Kitware Medical Imaging (Carrboro, NC).
E. Statistical Analysis
A least-squares linear regression model was applied to the tortuosity vs. distance data for each tumor, and the slope values were collected in order to assess a correlation between the tortuosity metric (SOAM) and distance from the tumor. A two-tailed t-test was performed using the slope data set to test significance of the correlation. In order to compare the three tissue regions (tumor, distal and control) to each other and determine statistical difference between the groups, ANOVA and Tukey Honest Significance Difference tests were performed. These two tests enabled us to statistically observe the heterogeneity in tortuosity values for the vasculature surrounding a tumor mass and compare these to mean tortuosity values of control animal vasculature.
III. RESULTS
The largest tissue regions had 217 ± 29 segmented vessels each, with approximately 40–50 vessels attributed to each 2 mm increase in ROI size beyond the original tumor ROI. Based on the t-test analysis, the slopes of the SOAM linear regressions were found to be negative, with p=0.002. Additionally, the magnitude of the mean slope for the normalized SOAM, −0.59 ± 0.34 radians/cm per millimeter increment away from the tumor, demonstrated a drastic decrease in tortuosity within the imaging field. Figure 4 illustrates this trend by displaying renderings of the segmented vessels with a color map indicating the SOAM value for each vessel for an example tumor. The vessels shown in the most saturated reds indicate the highest tortuosity values and are visibly localized to the tumor located in the lower portion of the image. Less intense reds correspond to lower tortuosity values, and more of these vessels can be seen away from the tumor.
By isolating vessels within the tumor and in distal tissue regions, as well as in control images, we were able to delineate the tortuosity profiles in these distinct regions. For this analysis, tumor regions included tumors and 2 mm of surrounding tissue, and distal tissue regions included vasculature between 6 to 10 mm from tumor boundaries. Analysis using ANOVA and Tukey Honest Significance Difference tests revealed that the tortuosity values of the three vascular regions were statistically different from each other (p=2×10⁻¹⁶), including each pairing of the 3 groups (see Figure 3B). As expected, the greatest difference in tortuosity is between the tumor and the control vessels (23.81 ± 1.79, difference and standard error). The mean and standard error of the SOAM of the distal tissue region was 6.41 ± 2.07 lower than that of the tumor region. However, when compared to the control tissue, the distal tissue region had 17.40 ± 1.79 higher tortuosity (p=1×10⁻⁸), indicating that the within the imaging field, the tortuosity decreases significantly, but does not reach normal tortuosity levels that are observed in control animals.
IV. DISCUSSION
While changes in vascular structure have been directly linked to the progression of a tumor in many qualitative histology studies, only recently have studies characterized the vessel morphology in a tumor microenvironment using quantitative imaging modalities such as contrast enhanced MRI and X-ray imaging [15–17]. Acoustic angiography, a non-invasive and high resolution imaging technique, provides near real time capabilities for visualizing vascular architecture, as well as the opportunity for further quantitative analysis of morphology, such as the work described here. This novel contrast-enhanced ultrasound technique has recently been used to show differences in 3-D vessel morphology between tumor models and controls [6]. However, it has not yet been used to characterize the spatial dependence of vessel tortuosity with respect to the tumor mass. The image processing method described in this work has demonstrated that acoustic angiography is a valuable tool for detecting decreasing vessel tortuosity within 10 mm of the tumor boundary, as seen by the negative correlation observed between tortuosity and distance from the tumor in Figure 2A. Although the tortuosity decreased significantly 6 to 10 mm from the tumor boundary, the surrounding vasculature still exhibited elevated tortuosity when compared to control tissue; thus the vascular footprint of a tumor extends far beyond the immediate tumor margin. Previous studies analyzing vascular tortuosity surrounding tumors using other methods have characterized tumor and transitional vessel structure within 1 mm of the tumor boundary [7, 8]. The data and analysis presented in this paper has demonstrated that similar vascular profiles can be identified non-invasively using acoustic angiography, and exist at a scale an order of magnitude larger, across 1 cm of surrounding tissue.
The vascular maps generated using acoustic angiography could be utilized to detect changes in vascular tortuosity due to differential expression of various angiogenic factors [18, 19] or to identify the morphological vessel pathogenesis of preclinical cancer models. In the clinical setting, this technique could be used to delineate the tissue regions affected by the presence of a tumor in order to aid in tumor detection and monitoring. The main limitations of acoustic angiography are the limited depth of penetration and the frame rate, which are currently limited by mechanical scanning in the prototype dual-single element design. Future dual-frequency transducer arrays will improve imaging depth and frame rate, but imaging will still be limited to superficial targets (a few cm, depending on choice of imaging frequencies) in clinical imaging. Despite these limitations, the image acquisition and processing method described here is optimized for small animal imaging and can be a valuable tool in investigating the tumor environment.
V. CONCLUSION
While acoustic angiography alone generates high-resolution images of vasculature, the combined method of imaging and image processing described in this paper enables the isolation and morphological analysis of specific vessels in the image volume. Advances in cancer therapeutics rely on a comprehensive understanding of the underlying mechanics influencing the tumor environment and are thus dependent on the degree to which tumor response can be observed and analyzed. Acoustic angiography fulfills this need by providing a non-invasive method of investigating one of the main components of the tumor environment: microvascular networks, and enables imaging of cancer based on its microvascular signature alone. The method described in this paper expands the analytical capacities of this new technology and will enable researchers to characterize changes in vascular structure in longitudinal in vivo studies of tumor models.
Acknowledgments
We would like to thank J. Rojas for MATLAB code for 3D ROI selection. Special thanks to S.R. Aylward, M. Heitz, and J. Andruejol for their work on customized vessel displays in VesselView, and to F.S. Foster, E. Cherin, and M. Lee for fabrication of dual frequency transducers. Funding was provided by the National Institutes of Health 1R01CA170665 and 1R43CA165621, P30CA16086, and T32HL069768. P.A.D. declares that he has an equity interest in SonoVol, Inc., a company which has licensed technology described in this manuscript.
Footnotes
DISCLOSURES
Dr. Dayton discloses that he is a co-inventor on a patent describing technology described here, and has an equity interest in SonoVol, LLC, a company which has licensed the microvessel imaging technology described here.
REFERENCES
- 1.Gessner R, Lukacs M, Lee M, Cherin E, Foster FS, Dayton PA. High-resolution, high-contrast ultrasound imaging using a prototype dual-frequency transducer: in vitro and in vivo studies. IEEE Trans Ultrason Ferroelectr Freq Control. 2010 Aug;57:1772–1781. doi: 10.1109/TUFFC.2010.1615. [DOI] [PMC free article] [PubMed] [Google Scholar]
- 2.Gessner RC, Frederick CB, Foster FS, Dayton PA. Acoustic angiography: a new imaging modality for assessing microvasculature architecture. Int J Biomed Imaging. 2013;2013:936593. doi: 10.1155/2013/936593. [DOI] [PMC free article] [PubMed] [Google Scholar]
- 3.Kruse DE, Ferrara KW. A new imaging strategy using wideband transient response of ultrasound contrast agents. IEEE Trans Ultrason Ferroelectr Freq Control. 2005 Aug;52:1320–1329. doi: 10.1109/tuffc.2005.1509790. [DOI] [PMC free article] [PubMed] [Google Scholar]
- 4.Jain RK. Normalization of tumor vasculature: an emerging concept in antiangiogenic therapy. Science. 2005 Jan 7;307:58–62. doi: 10.1126/science.1104819. [DOI] [PubMed] [Google Scholar]
- 5.Gessner RC, Aylward SR, Dayton PA. Mapping microvasculature with acoustic angiography yields quantifiable differences between healthy and tumor-bearing tissue volumes in a rodent model. Radiology. 2012 Sep;264:733–740. doi: 10.1148/radiol.12112000. [DOI] [PMC free article] [PubMed] [Google Scholar]
- 6.Shelton SE, Lee YZ, Lee M, Cherin E, Foster FS, Aylward SR, et al. Quantification of microvascular tortuosity during tumor evolution utilizing acoustic angiography. Ultrasound in Medicine & Biology. 2015 doi: 10.1016/j.ultrasmedbio.2015.02.012. In Press. [DOI] [PMC free article] [PubMed] [Google Scholar]
- 7.Manning CS, Jenkins R, Hooper S, Gerhardt H, Marais R, Adams S, et al. Intravital imaging reveals conversion between distinct tumor vascular morphologies and localized vascular response to Sunitinib. IntraVital. 2013 Jan;2:e24790. [Google Scholar]
- 8.Pathak AP, Kim E, Zhang JY, Jones MV. Three-Dimensional Imaging of the Mouse Neurovasculature with Magnetic Resonance Microscopy. Plos One. 2011 Jul;6 doi: 10.1371/journal.pone.0022643. [DOI] [PMC free article] [PubMed] [Google Scholar]
- 9.Niesner RA, Hauser AE. Recent Advances in Dynamic Intravital Multi-Photon Microscopy. Cytometry Part A. 2011 Oct;79A:789–798. doi: 10.1002/cyto.a.21140. [DOI] [PubMed] [Google Scholar]
- 10.Lee S, Barbe MF, Scalia R, Goldfinger LE. Three-Dimensional Reconstruction of Neovasculature in Solid Tumors and Basement Membrane Matrix Using Ex Vivo X-ray Microcomputed Tomography. Microcirculation. 2014 Feb;21:159–170. doi: 10.1111/micc.12102. [DOI] [PMC free article] [PubMed] [Google Scholar]
- 11.Ehling J, Lammers T, Kiessling F. Non-invasive imaging for studying anti-angiogenic therapy effects. Thrombosis and Haemostasis. 2013 Mar;109:375–390. doi: 10.1160/TH12-10-0721. [DOI] [PMC free article] [PubMed] [Google Scholar]
- 12.Duncan JS, Whittle MC, Nakamura K, Abell AN, Midland AA, Zawistowski JS, et al. Dynamic Reprogramming of the Kinome in Response to Targeted MEK Inhibition in Triple-Negative Breast Cancer. Cell. 2012 Apr;149:307–321. doi: 10.1016/j.cell.2012.02.053. [DOI] [PMC free article] [PubMed] [Google Scholar]
- 13.Aylward SR, Bullitt E. Initialization, noise, singularities, and scale in height ridge traversal for tubular object centerline extraction. IEEE Trans Med Imaging. 2002 Feb;21:61–75. doi: 10.1109/42.993126. [DOI] [PubMed] [Google Scholar]
- 14.Bullitt E, Muller KE, Jung I, Lin W, Aylward S. Analyzing attributes of vessel populations. Med Image Anal. 2005 Feb;9:39–49. doi: 10.1016/j.media.2004.06.024. [DOI] [PMC free article] [PubMed] [Google Scholar]
- 15.Yang XY, Knopp MV. Quantifying Tumor Vascular Heterogeneity with Dynamic Contrast-Enhanced Magnetic Resonance Imaging: A Review. Journal of Biomedicine and Biotechnology. 2011 doi: 10.1155/2011/732848. [DOI] [PMC free article] [PubMed] [Google Scholar]
- 16.Chien CC, Chen HH, Lai SF, Wu KC, Cai XQ, Hwu YK, et al. Gold nanoparticles as high-resolution X-ray imaging contrast agents for the analysis of tumor-related micro-vasculature. Journal of Nanobiotechnology. 2012 Mar;10 doi: 10.1186/1477-3155-10-10. [DOI] [PMC free article] [PubMed] [Google Scholar]
- 17.Gazit Y, Baish JW, Safabakhsh N, Leunig M, Baxter LT, Jain RK. Fractal characteristics of tumor vascular architecture during tumor growth and regression. Microcirculation-London. 1997 Dec;4:395–402. doi: 10.3109/10739689709146803. [DOI] [PubMed] [Google Scholar]
- 18.Grunstein J, Masbad JJ, Hickey R, Giordano F, Johnson RS. Isoforms of vascular endothelial growth factor act in a coordinate fashion To recruit and expand tumor vasculature. Mol Cell Biol. 2000 Oct;20:7282–7291. doi: 10.1128/mcb.20.19.7282-7291.2000. [DOI] [PMC free article] [PubMed] [Google Scholar]
- 19.Lee S, Jilani SM, Nikolova GV, Carpizo D, Iruela-Arispe ML. Processing of VEGF-A by matrix metalloproteinases regulates bioavailability and vascular patterning in tumors. J Cell Biol. 2005 May;169:681–691. doi: 10.1083/jcb.200409115. [DOI] [PMC free article] [PubMed] [Google Scholar]


