

Abstract
Study Objectives:
Short sleep duration and poor sleep quality are associated with adverse cardiovascular outcomes. Potential pathophysiological mechanisms include sleep-associated alterations in the autonomic nervous system. The objective of this study was to examine the associations of shorter sleep duration and poorer sleep quality with markers of autonomic tone: heart rate (HR), high-frequency HR variability (HF-HRV) and salivary amylase.
Methods:
Cross-sectional analysis of data from actigraphy-based measures of sleep duration and efficiency and responses to a challenge protocol obtained from 527 adult participants in the Multi-Ethnic Study of Atherosclerosis.
Results:
Participants who slept fewer than 6 h per night (compared to those who slept 7 h or more per night) had higher baseline HR (fully adjusted model 0.05 log beats/min, 95% confidence interval [CI] 0.01, 0.09) and greater HR orthostatic reactivity (fully adjusted model 0.02 log beats/min, 95% CI 0.002, 0.023). Participants who slept 6 to less than 7 h/night (compared to those who slept 7 h or more per night) had lower baseline HF-HRV (fully adjusted model −0.31 log msec2, 95% CI −0.60, −0.14). Participants with low sleep efficiency had lower baseline HF-HRV than those with higher sleep efficiency (fully adjusted model −0.59 log msec2, 95% CI −1.03, −0.15). Participants with low sleep efficiency had higher baseline levels of amylase than those with higher sleep efficiency (fully adjusted model 0.45 log U/mL, 95% CI 0.04, 0.86).
Conclusions:
Short sleep duration, low sleep efficiency, and insomnia combined with short sleep duration were associated with markers of autonomic tone that indicate lower levels of cardiac parasympathetic (vagal) tone and/or higher levels of sympathetic tone.
Citation:
Castro-Diehl C, Roux AV, Redline S, Seeman T, McKinley P, Sloan R, Shea S. Sleep duration and quality in relation to autonomic nervous system measures: the Multi-Ethnic Study of Atherosclerosis (MESA). SLEEP 2016;39(11):1927–1940.
Keywords: sleep duration, sleep efficiency, insomnia, HF-HRV and salivary amylase
Significance.
This study describes the associations between habitual sleep duration and sleep quality with measures of cardiac autonomic modulation in an attempt to improve understanding of the mechanisms of cardiovascular events in individuals with insufficient sleep. We investigated these associations in a sub-cohort of a large population-based sample, the Multi-ethnic Study of Atherosclerosis (MESA), in which its participants had autonomic functional testing and objective measures of sleep duration and sleep quality during the MESA 5 examination from participants of three MESA field centers. The question examined in this article is of importance both clinically and in terms of public health because these findings indicate that short sleep duration and low sleep quality are associated with alterations of autonomic system modulation.
INTRODUCTION
Several large epidemiological studies have found that short sleep duration and poor sleep quality are associated with cardiovascular disease (CVD). For example, short sleep duration and difficulty falling asleep were predictors of incident myocardial infarction (MI) among women,1 sleep difficulty was associated with coronary heart disease (CHD) mortality among men,2 and insomnia symptoms predicted increased risk for acute MI in a large cohort of men and women3 and CVD mortality in a cohort of men.4 Short sleep duration has also been associated with higher risk of coronary artery calcification,5 and both short sleep duration and poor sleep quality have been associated with CVD risk factors including hypertension,6,7 diabetes,8 and obesity.9
One pathophysiological mechanism that may explain these observations is alteration of the autonomic nervous system (ANS) with greater sympathetic activation and/or parasympathetic suppression. Studies with small samples of young volunteers have shown that sleep influences sympathetic activity. Circulating levels of norepinephrine and epinephrine were lower during sleep than during wakefulness10–12 as were heart rate and blood pressure.12 Insomnia has been associated with abnormalities in autonomic modulation13; however there are few studies of the relationship between sleep duration, especially under habitual conditions, and autonomic modulation. For example, in one study of 338 individuals between 20 and 66 y old, participants who slept fewer than 6 h per night had higher resting heart rate (HR) when awake than those who slept 6 h or more.14 In another study, heart rate variability (HRV) measures were decreased in chronic sleep deprivation in a sample of 30 healthy college students.15
HR is influenced by the combined effects of both branches of the ANS, the sympathetic and parasympathetic nervous system. HRV measurements provide information about the function of the ANS16 and are derived from mathematical analyses of the R-R intervals during normal sinus rhythm in the electrocardiogram (ECG). High-frequency HRV (HF-HRV) measures represent parasympathetic influences under normal circumstances,16 whereas low-frequency HRV (LF-HRV) measures represent both sympathetic and parasympathetic modulation.17 Decreased parasympathetic modulation has been associated with an increased risk for CVD and early mortality in a community sample,18 and mortality after MI.19
Studies have also linked cardiovascular reactivity to stressors to cardiovascular outcomes. Exaggerated blood pressure reactivity during psychological stress has been shown to predict hypertension20 and the presence of coronary artery calcium21 and carotid atherosclerosis.22 Delayed blood pressure recovery from mental stress has also been associated with carotid atherosclerosis.23 In addition, epidemiological studies have shown that increased heart rate, both at rest and in response to exercise, are associated with cardiovascular mortality,24,25 whereas slow heart rate recovery immediately after exercise has been associated with higher risk of total mortality.26
Despite evidence linking sleep to sympathetic and para-sympathetic activity, only a few small experimental studies have examined how sleep affects cardiovascular reactivity to a stress challenge. Some have found associations between sleep deprivation and cardiovascular reactivity27–29 but others have not.30 To our knowledge, only one study has evaluated the effect of habitual short sleep duration on subsequent HR and HRV responses to a stress challenge,31 but this study was restricted to a small sample of young adults.
Salivary alpha-amylase (sAA), a marker of sympathetic activity, has also been studied in psychophysiological research.32,33 sAA increases immediately after stress and returns to baseline levels within 10 to 20 min.34 Associations have been reported between sAA reactivity to mental and physical stress and plasma norepinephrine,35 and shortened cardiac preejection period.36 sAA has also been found to be correlated with HR37 and with LF-HRV/HF-HRV ratio, which reflects sympathovagal balance.34 A few studies have examined the association of sleep with sAA responses to mental stress, but these have been restricted to children38 or healthy young adults.39 No reported study to our knowledge has evaluated the association of habitual sleep characteristics with sAA responses to mental stress in a population-based sample.
We hypothesized that: (1) participants whose sleep was of short duration or poor quality would have higher baseline (prestress challenge) HR, higher level of amylase, and lower HF-HRV compared to individuals who slept longer or better; (2) participants whose sleep was of short duration or of poor quality would have greater HR, HF-HRV, and amylase reactivity to mental and orthostatic stress challenges compared to individuals who slept longer or better; (3) participants whose sleep was of short duration or of poor quality would have slower HR, HF-HRV, and amylase recovery from stress compared to individuals who slept longer or better.
METHODS
Participants
The Multi-Ethnic Study of Atherosclerosis (MESA) is a longitudinal study designed to investigate risk factors for sub-clinical CVD. At baseline (Exam 1) in 2000–2002, MESA recruited 6,814 men and women who were 45 to 84 y old, free of clinical CVD, and from six US communities.40 MESA was approved by the institutional review board at each field center, and all participants gave written informed consent at each examination. Our sample was recruited at MESA Exam 5 (2010–2012) at three of the six MESA field centers, namely Columbia, University of California, and John Hopkins, where both the challenge test protocol (stress study) and sleep assessments (sleep study) were conducted. The stress study excluded participants with night shift jobs. The sleep study excluded subjects if they used oral airway support devices, nocturnal oxygen, or nightly continuous positive airway pressure. We also excluded from analysis participants who slept fewer than 3 h per night (n = 11) and participants who slept 9 h or more per night (n = 11).
In the cardiovascular (HR and HRV) part of the challenge test, a total of 1,119 participants were enrolled. We excluded 230 participants because of missing HR values data at all measurements in the protocol, failure to complete both mental stress tasks, or color blindness. We further excluded 362 additional participants who did not have actigraphy-based measures of sleep duration and efficiency. Our final analytic data for HR/HRV was based on 527 persons with 3,450 HR/HRV measures.
In the hormonal (amylase) part of the challenge test, a total of 1,040 participants were enrolled, providing 4,040 salivary samples. We excluded participants who were missing all 4 saliva amylase values (n = 18) or whose values were in the top 1% of the baseline sample because they were considered extreme values (n = 10 observations). We then excluded participants who were color blind or failed to complete both mental tasks (n = 35), or who did not have actigraphy-based measures of sleep duration and efficiency (n = 424). Given that beta adrenergic antagonists reduce the secretion of alpha amylase,33 we further excluded participants who used beta blockers (n = 104). Additionally, we excluded participants who used oral steroids (n = 5). Our final analytic data for amylase was based on 454 persons with 1,736 amylase measures.
Sleep Protocol
The MESA Sleep Protocol included 7-day actigraphy (Actiwatch Spectrum, Philips Respironics, Murrysville, PA), 1-night home polysomnography, a sleep diary, and a sleep questionnaire. Actigraphic data during 30-sec epochs were scored as sleep or wake by Actiware-Sleep v.5.59 analysis software (Mini Mitter Co., Inc., Bend, OR) after manually editing the sleep period using sleep diary data and event and light markers. A validated algorithm41 was used to calculate the activity count for each epoch. Intrascorer intraclass correlation coefficients for average sleep duration and sleep efficiency were 0.91 and 0.97, respectively.
Sleep variables were averaged across all nights that the actigraph was worn. Sleep duration was defined as the average duration of sleep between sleep onset (sleep start time) and morning wakening (sleep end time) while in bed after lights off. It was calculated by dividing the sum of the recorded minutes of sleep by the total number of main sleep periods. We categorized sleep duration as 3 or more or less than 6 h per night, 6 to 6.9 h per night, and 7 to 8.9 h per night (reference group). In an extended analysis, sleep duration was also analyzed using a cut point of 7 h consistent with previous studies.42 Both cut points were examined because there is no consensus on the definition of short sleep duration. Sleep efficiency was defined as the percentage of time in bed after lights off spent sleeping. It was calculated by dividing the sum of sleep minutes by the sum of minutes after lights off during main sleep intervals recorded, and multiplying by 100. Sleep efficiency was categorized as low sleep efficiency (< 85%) or higher sleep efficiency (≥ 85%) consistent with previous studies.43,44 Insomnia, a subjective measure of sleep quality, was assessed based on self-report using the Women's Health Insomnia Rating Scale (WHIIRS), a 5-item questionnaire design to evaluate insomnia symptoms. The summary score ranged from 0 to 20. A score of 9 or higher is considered clinically significant insomnia.45 In an extended analysis, we investigated the joint effect of sleep duration and insomnia, for which we constructed the following categories: 3 to 6.9 h/night with insomnia (< 7 h with insomnia), 3 to 6.9 h/night with no insomnia (< 7 h with no insomnia), 7 to 8.9 h/night with insomnia (≥ 7 h with insomnia), and 7 to 8.9 h/night with no insomnia (≥ 7 h with no insomnia) (reference group).
Stress Challenge Protocol (Mental and Orthostatic Stress)
Participants were asked to minimize physical exercise during the hour preceding the test and not to consume large meals, drink coffee, or smoke. After arriving at the laboratory and receiving instructions, each participant was connected to physiological monitors.
Two mental stress tasks were administered via computer during a standard laboratory psychophysiology protocol while participants were in the seated position. For both tasks, participants were told their performance on the tasks would be evaluated for both speed and accuracy. The protocol began with a resting baseline (11 min) followed by two mental stress tasks (6 min each) and a corresponding recovery period after each mental task (6 min each). Mental stress task presentation order was counterbalanced between subjects to minimize order effects. Responses to the tasks were captured on a keypad. Participants were instructed to remain silent throughout the protocol.
Mental Stressors
Tasks were presented on a computer monitor; participants entered responses on a numeric keypad with their dominant hand. Tasks administration timing was controlled and synchronized to the physiological data acquisition via microcomputer. The Morgan and Turner Hewitt (MATH) task46 involved the presentation on a computer screen for 1.5 sec of pairs of numbers to be added or subtracted. Then, the word “equals” for 1.0 sec; followed by a possible answer to the problem for 1.0 sec, during which the participant used a keypad to indicate whether the presented solution was correct or not. Problems were ranked along five difficulty levels; response accuracy on each trial adjusted the difficulty of the next trial. A modified version of the Stroop color-word conflict task involved the presentation of one of four-color name words (blue, green, yellow, or red) on a screen in a font color that either did or did not match the color name. When the color name stimulus appeared on the screen, the participant had to press the key on a keypad corresponding to the color of the font. To standardize the level of engagement, the presentation rate increased with better performance and decreased with poorer performance.
Each mental stress was followed by a 6-min recovery, in which participants remained sitting quietly. Following the mental tasks and their recovery periods, participants completed a 6-min physical challenge test (orthostatic stress) that consisted of assuming and holding a standing position. This last period was followed by a 30-min recovery period. Participants were continuously monitored by ECG to collect HR and HRV data throughout the challenge protocol (Figure 1).
Figure 1.

Representation of time course of heart rate (HR), high-frequency heart rate variability (HF-HRV), and amylase measurements during the Stress Challenge. Red lines represent 300 second interval. MS, mental stressor; R, recovery; U, orthostatic stressor.
HR and HRV
Continuous measures of ECG were recorded during each period in the protocol (Figure 1). The beat-to-beat intervals derived from the ECG waveforms during each period were used to calculate average HR and HRV for each period. Average HR and HRV during mental stress was calculated as the average of the two averages for the stress periods (MS1 and MS2 in Figure 1), and similarly for during recovery (periods R1 and R2 in Figure 1). ECG electrodes were placed on the left and right shoulders, and in the left lower quadrant. Stretch bands were placed around the participant's chest and abdomen to measure respiration. Analog ECG signals were digitized at 500 Hz by a Datacq9 cardiopulmonary monitor (Medelex, Inc., New York, NY) and passed to a microcomputer for R-wave detection implemented by custom-written software (Graphical Acquisition, and Marking; Author: Delano MacFarlane, PhD), resulting in an RR interval time series. Errors in marking of R-waves were corrected interactively.47,48
Mean HR and spectral power in the high frequency band (0.15–0.40 Hz [HF]) were computed from up to 5-min epochs using an interval method for computing Fourier transforms.49 Prior to analysis, the RR interval was filtered using a Hanning window,50 and power in the HF and LF bands was summed and adjusted for attenuation produced by the filter.50
Saliva Collection
Four saliva samples were collected using a cotton oral swab during the challenge protocol. After participants entered the examination they were asked to rest in a sitting position while receiving instructions and were connected to the various physiological monitors. Samples were collected after this resting period of approximately 13 min (Sample 1); immediately after the completion of the mental tasks and their respective recovery periods (Sample 2), around 38 min after Sample 1; after completion of the orthostatic stress (Sample 3), around 17 min after Sample 2; and after the 30-min recovery period at the end of the stress challenge protocol (Sample 4), around 30 min after Sample 3 (Figure 1). Saliva samples were stored at −20° C until analyses. After thawing, salivettes were centrifuged at 3,000 rpm for 5 min. Concentrations of alpha-amylase in saliva were measured using an enzyme kinetic method.33 Intravariability and intervariability coefficient of variation for the amylase of the assay were < 8% and < 12%.
Covariates
Covariates Used for Analysis of HR and HRV
Models of the association of sleep with HR/HRV were adjusted for factors known to affect heart rate,51 specifically age, sex, race/ethnicity (African American, Hispanic, or white [reference]), income-wealth index, body mass index (kg/m2), smoking status, and alcohol consumption as of MESA Exam 5. Smoking status was categorized as current and recent smoker (quit less than 1 y ago), past smoker (quit more than 1 y ago), or never smoker. Alcohol consumption was classified as yes/ no. Other covariates were diabetes and use of medications. Diabetes mellitus status was categorized according to the 2003 criteria of the American Diabetes Association as normal, impaired fasting glucose, untreated diabetes, and treated diabetes. We also classified diabetes status as no (normal) versus yes (treated or untreated diabetes and impaired fasting glucose). Use of medications was categorized as yes if the participant used anti-hypertensive medications, medications for sleep and mood, or sympathomimetic medications; or no if the participant did not use those specific medications. Analyses were also adjusted for sleep efficiency when the main predictor was sleep duration and for sleep duration when sleep efficiency was the main predictor. Additionally, we adjusted for the apneahypopnea index (AHI) and for average time spent in daytime naps. Overnight polysomnography was performed at the participants home as described before,52 and provided the AHI, which represents the sum of all apneas and hypopneas associated with ≥ 3% desaturation per hour of sleep. Naps were assessed from the actigraphy data and defined as the average sleep time in naps of 15 min or more per day across all days.
Covariates Used for Analysis of Amylase
For amylase, we adjusted for sleep duration or sleep efficiency, and for the AHI and same covariates (demographics, lifestyle behaviors and medical problems) as above. Given the potential for amylase to be influenced by several medications, we adjusted for medications that we found were the most influential in responses to stress when we compared participants who used that medication with those who did not, and those medications were inhaled steroids, hormone replacement therapy and antipsychotic medications. Beta-blockers and oral steroids were also very influential and we excluded participants using them as mentioned above.
Statistical Analyses
We examined participant characteristics by categories of sleep duration and efficiency. Differences in outcome variables and covariates by these categories were evaluated by analysis of variance, Kruskal-Wallis test, or chi-square tests. HR, HRV, and amylase were transformed using the natural logarithm because of skewed distributions. We used linear mixed effect models to account for the intra-individual correlation of the repeated measures of the outcomes.
Modeling HR and HRV
Linear mixed-effects models were used to estimate associations of sleep with HR and HRV at baseline and in responses to the stress challenge. In these models repeated measures of the outcomes were modeled as a function of stress task period, sleep, and interactions of sleep with time period in order to estimate associations of sleep with stress reactivity and recovery. Stress task period was modeled using three dummy variables representing three periods (with baseline period as reference group): mental stress task, recovery from mental stress, and orthostatic stress task (the last period in the procedure) (Figure 1). Up to seven repeated measures were available for each individual (two at baseline, one during each of the mental stress periods, one during each of the recovery periods from mental stress, and one during the orthostatic challenge). Models included a random intercept for each person (to account for correlation between repeated measures over time within a person) and random slope of mental stress task indicator to allow for interindividual variability in reactivity. Robust standard errors were reported. Covariates were entered in the models as main effects and as two-way interaction terms with each of the stress task periods.
HR and HRV responses to stress challenge analyzed were: (1) mental stress reactivity responses (HR/HRV at stress task – HR/HRV at baseline); (2) recovery from stress task response (HR/HRV at recovery − HR/HRV at stress task); (3) orthostatic reactivity response (HR/HRV at orthostatic – HR/ HRV at baseline). A more positive value of the HR stress reactivity response meant greater HR reactivity. A more negative value of the HRV stress reactivity response meant greater HRV reactivity during the stress challenge task(s). A more negative value of the HR recovery response meant greater HR recovery. A more positive value of the HRV recovery response meant greater HRV recovery from the stress challenge task(s) (Figure 2).
Figure 2.

Mean and standard deviation (SD) of log-transformed heart rate (HR), log-transformed high-frequency heart rate variability (HF-HRV) and log-transformed amylase for the whole population during the MESA Stress Protocol.
A sequence of models was run with various adjustments. Model 1 was adjusted for age as a continuous variable, sex, race/ethnicity, income-wealth, and respiratory rate (for HFHRV as the outcome). Model 2 included covariates in model 1 plus sleep efficiency (for sleep duration as the main predictor) or sleep duration (for sleep efficiency as the main predictor) and body mass index, smoking, alcohol use, diabetes, and medications (antihypertensive medications, antidepressants, sympathomimetic medications, and medications for sleep and mood). Model 3 was further adjusted for covariates included in model 2 plus sleep apnea. Model 4 was adjusted for covariates included in model 3 plus naps (h/day). We adjusted for naps because of reported benefit among young adults and the elderly,53 although studies have also reported that naps increase cardiovascular mortality in the elderly.54
From HR and HR variability modeling, we obtained mean differences in log transformed HR/HRV at baseline and mean differences in response to stress challenge classified by sleep duration, sleep efficiency and insomnia symptoms.
Modeling Amylase
As mentioned before, salivary amylase during the stress protocol was assessed at time points as opposed to HR/HRV measures that were assessed continuously; therefore, to analyze the associations of sleep measures with amylase at baseline and in responses to the stress challenge we simultaneously modeled the responses of amylase to the entire stress challenge protocol using piecewise mixed models with two knots. This modeling used all four salivary samples, and the knots were chosen based on the time when second and third samples were collected (on average 38 min and 55 min after the start of the stress challenge protocol). The model estimates associations of predictors with baseline amylase level and change in amylase level over each response over the entire examination period. Models also included individual random intercept and random slopes on the first and third spline of time. All covariates were entered in the models as main effects and as two-way interaction terms with the three spline pieces. Robust standard errors are reported.
Amylase responses to stress challenge analyzed in this study were: (1) mental stress reactivity response (second sample – first sample); (2) orthostatic reactivity response (third sample – first sample); and (3) recovery from stress task response (fourth sample – second sample). A more positive value of the stress reactivity response meant that amylase levels rose sharply after the stress challenge task(s). A more negative value of the recovery response meant that amylase levels fell sharply after the stress challenge (Figure 2).
A similar sequence of models was used as discussed, except that we adjusted for hormone replacement therapy and inhaled steroids, and we did not adjust for naps.
From amylase modeling, we obtained mean differences in log transformed amylase at baseline and mean differences in response to stress challenge by sleep duration, and sleep efficiency.
RESULTS
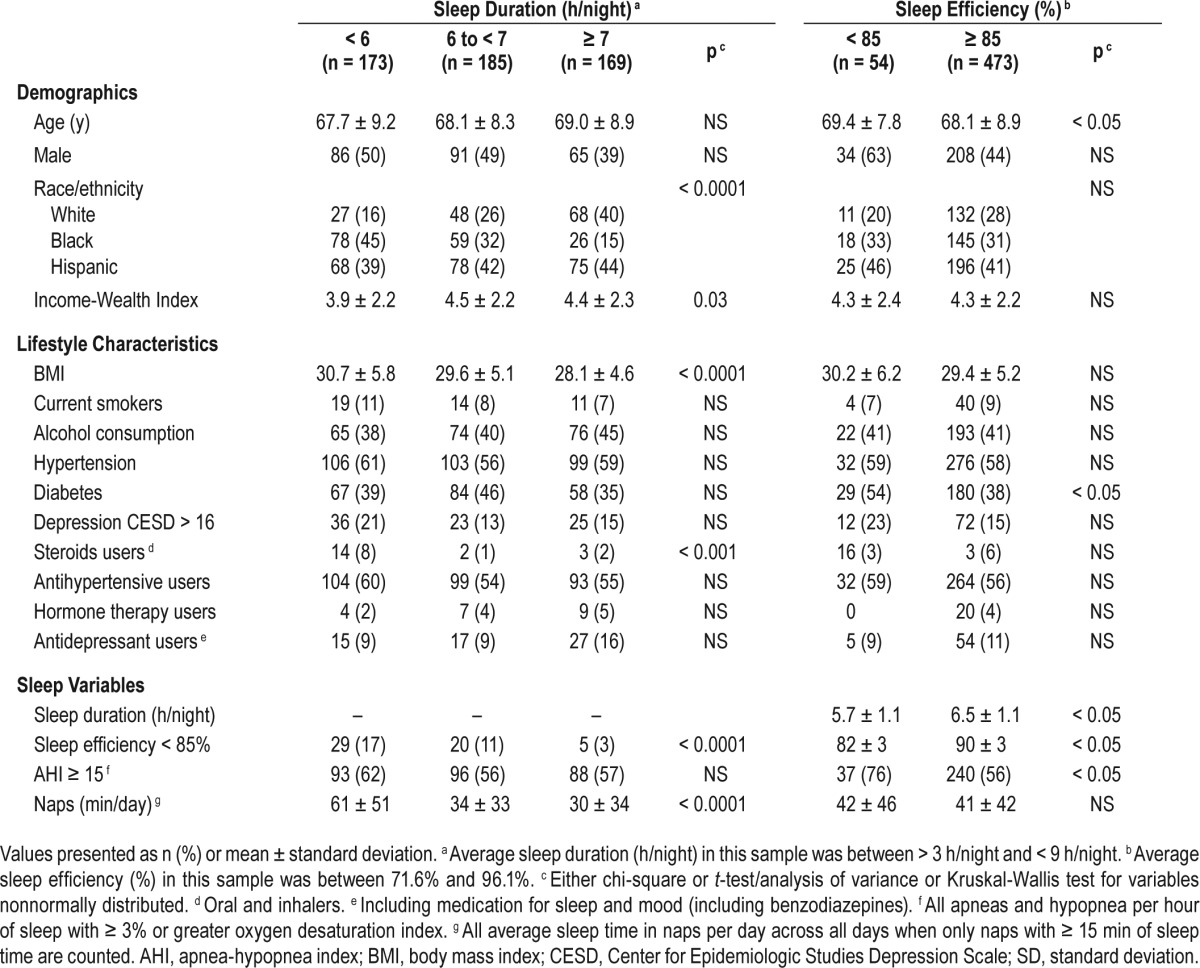
The 527 participants included 285 women and 242 men from three different race/ethnic backgrounds, Hispanic (42%), African-American (31%), and white (27%). Participant characteristics classified according to sleep duration and sleep efficiency are shown in Table 1. Participants with insomnia symptom (Women's Health Initiative Insomnia Rating Scale (WHIIRS) = 13 ± 3) and participants without insomnia symptoms (WHIIRS = 5 ± 2, P < 0.0001) did not differ in terms of sleep duration, sleep efficiency, sleep apnea, or naps. Pearson correlation coefficients among the sleep parameters are shown in Table S1 in the supplemental material.
Table 1.
Characteristics of participants (n = 527) by sleep duration and sleep efficiency, MESA.
Consistent with expectation, heart rate and amylase increased with mental and orthostatic stress and declined during recovery, whereas HF-HRV decreased with mental and orthostatic stress and increased during recovery (Figure 2).
Sleep Duration and HR and HF-HRV at Rest and in Response to Challenge
Table 2 shows mean differences in log-transformed heart rate in beats/min and 95% confidence intervals (CIs) at baseline and mean differences in response to the stress challenge comparing participants who slept fewer than 6 h per night and those who slept 6 to 6.9 h per night to those who slept 7 to 8.9 h per night (reference group). At baseline, participants who slept fewer than 6 h per night had higher levels of HR than those who slept 7 to 8.9 h per night in models 1, 3 and 4 (mean difference at fully adjusted model 0.05 log beats/min, 95% CI 0.01, 0.09 or 5% difference in HR [beats/min], 95% CI 0.6, 90). This is interpreted as those who slept fewer than 6 h per night had 5% higher baseline HR (beats/min) than those who slept 7 to 8.9 h per night. Compared to those who slept 7 to 8.9 h per night, participants who slept fewer than 6 h per night had greater HR reactivity to mental stress in models 1 and 2, but the association was not significant after adjustment for sleep apnea (model 3) and sleep apnea and naps (model 4). Participants who slept fewer than 6 hours per night also had greater HR orthostatic reactivity than those who slept 7 to 8.9 h per night only in models 3 and 4 (mean difference at fully adjusted model 0.013 log beats/min, 95% CI 0.002, 0.023) (Table 2). Participants who slept 6 to 6.9 h per night did not differ from those who slept 7 to 8.9 h per night in levels of HR at baseline or in response to challenge (Table 2).
Table 2.
Mean differences in log-transformed heart rate at baseline and mean differences in responses to stress challenge by sleep duration at less than 6 hours (173 participants) and 6 to 6.9 hours (185 participants) versus 7 to 8.9 hours or more (169 participants).

When we explored 7 h per night as a cut point for sleep duration, participants who slept fewer than 7 h per night had greater HR reactivity to the stress challenge than participants who slept 7 h or more per night in models 2 and 3 but not in model 4 (after adjustment for naps) (Table S2 in the supplemental material).
When we excluded 34 participants who had any CVD event (definitive angina pectoris, definitive myocardial infarction, percutaneous transluminal coronary angioplasty, coronary bypass graft or stroke) prior to MESA Exam 5, when the sleep data were collected, participants who slept fewer than 6 h per night had higher baseline values of HR and greater HR orthostatic reactivity than those who slept 7 to 8.9 h per night. In general, the estimates (and significance) obtained after excluding participants with any CVD event were a little larger that estimates before excluding them (Table S3 in the supplemental material).
Table 3 shows mean differences in log transformed HFHRV (log (msec2) and 95% CIs at baseline and mean differences in response to the stress challenge comparing participants who slept fewer than 6 h per night and those who slept 6 to 6.9 h per night to those who slept 7 to 8.9 h per night (reference group). Participants who slept fewer than 6 h per night did not differ from those who slept 7 to 8.9 h per night in levels of HF-HRV at baseline or in response to challenge (Table 3). At baseline, participants who slept 6 to 6.9 h per night had lower levels of HF-HRV than those who slept 7 to 8.9 h per night in all four models (mean difference at fully adjusted model −0.31 log msec2 95% CI −0.60, −0.01). Participants who slept 6 to 6.9 h per night did not differ from those who slept 7 to 8.9 h per night in levels of HF-HRV in response to challenge (Table 3).
Table 3.
Mean differences in log-transformed high-frequency heart rate variability at baseline and mean differences in responses to stress challenge by sleep duration at 6 hours or less (173 participants) and 6 to 6.9 hours (185 participants) vs. ≥ 7 to 8.9 hours (169 participants).

When we explored 7 h per night as a cut point for sleep duration, participants who slept fewer than 7 h per night had significantly lower HF-HRV levels at baseline in all models, and greater increase in HF-HRV during recovery from mental stress in all models compared to those who slept 7 h or more per night (Table S3). The findings at baseline were consistent with the findings when sleep duration was categorized as fewer than 6 h per night, 6 to 6.9 h per night and 7 h or more per night. The greater increase in HF-HRV during recovery for those who slept fewer than 7 h per night may be explained because the change in value of HF-HRV between recovery and mental stress was larger in those who slept fewer than 7 h per night compared to those who slept 7 h or more per night.
Sleep Efficiency and HR and HF-HRV at Rest and in Response to Challenge
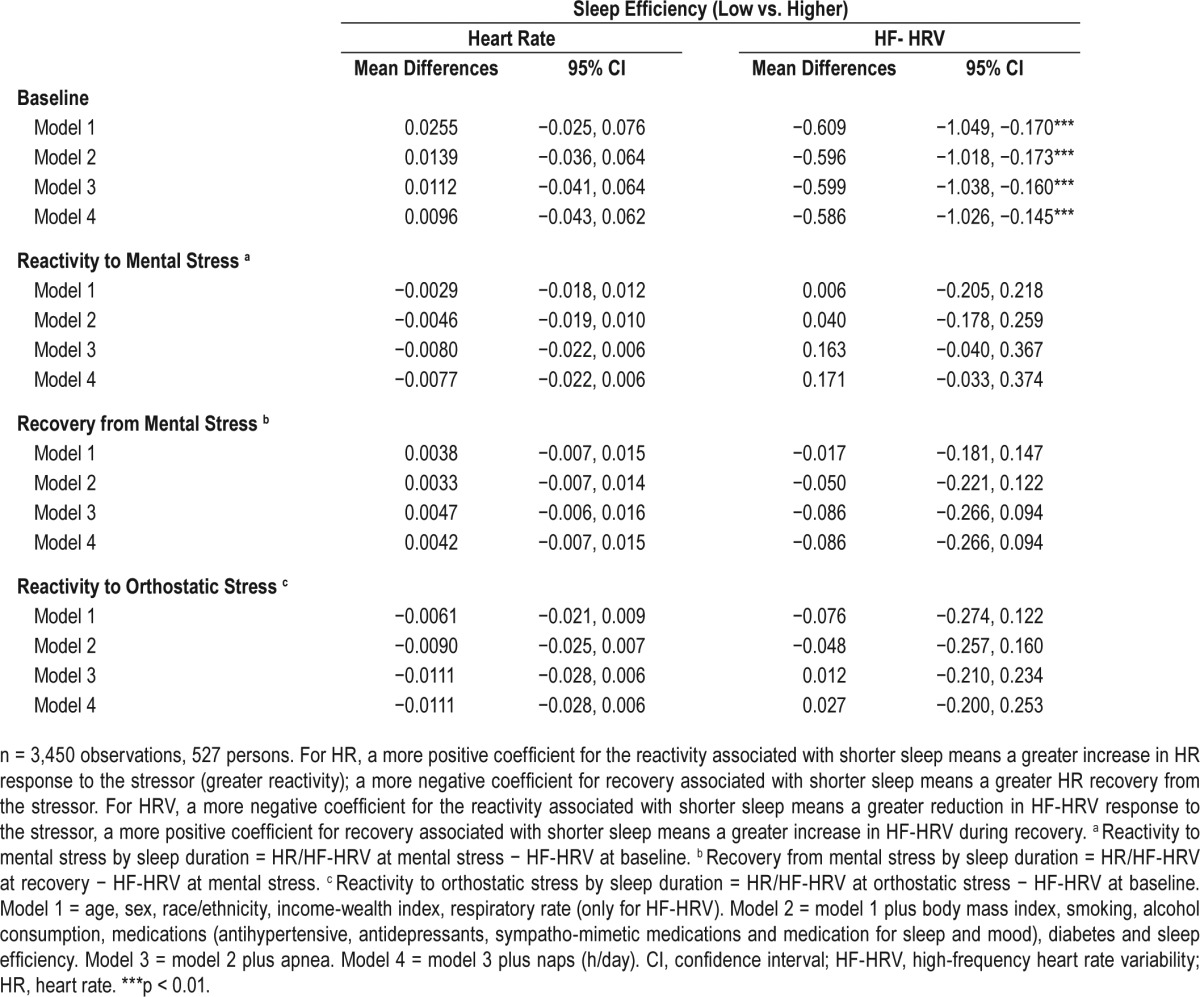
Table 4 shows mean differences in log-transformed HR (beats/ min) and HF-HRV (msec2) and 95% CIs at baseline and mean differences in response to the stress challenge comparing low versus higher sleep efficiency. Participants with low sleep efficiency did not differ from those with higher sleep efficiency in levels of HR at baseline or in response to challenge (Table 4). For HF-HRV, at baseline, participants with low sleep efficiency had lower levels of HF-HRV than those with higher sleep efficiency (mean difference at fully adjusted model −0.59 log msec2, 95% CI −1.03, −0.15). Low sleep efficiency was not associated with HF-HRV responses to the stress challenge (Table 4).
Table 4.
Mean differences in log-transformed heart rate (log (beats/min) and high-frequency heart rate variability (log (msec2)) at baseline and mean differences in responses to stress challenge by sleep efficiency.
When we excluded 34 participants with CVD events, the estimates and significance of the results (Table S4 in the supplemental material) did not different significantly for the results showed in Table 4.
Joint Effect of Sleep Duration and Insomnia
Participants who slept fewer than 7 h per night and who reported insomnia had greater HR orthostatic reactivity compared to those who slept 7 h or more per night with no insomnia (reference group) in all models (mean difference at fully adjusted model 0.02 (log [beats/min]), 95% CI 0.006, 0.029) (Table S5 in the supplemental material).
Participants who slept fewer than 7 h per night who reported insomnia had greater HF-HRV mental reactivity compared to those who slept 7 h or more per night with no insomnia in all models (mean difference at fully adjusted model −0.29 log msec2, 95% CI −0.50, −0.07), and a greater increase in HF-HRV during recovery in all models (mean difference at fully adjusted model 0.25 log msec2, 95% CI 0.04, 0.47), compared to those who slept 7 h or more per night with no insomnia (reference group) (Table S6 in the supplemental material).
Sensitivity Analysis
Within each period of the challenge protocol, HR/HRV data was obtained at epoch duration between 180 and 300 seconds. We included 102 observations with epoch duration different than 300 sec (180 or 240 sec) in which HR/HRV data was collected. Estimates obtained after excluding observations based on data obtained from only epoch duration 300 sec did not differ from the estimates obtained without excluding those observations.
Sleep Duration and Sleep Efficiency and Amylase at Rest and in Response to Challenge
Table 5 shows the estimates and 95% CIs in amylase at baseline and responses to the stress challenge by sleep duration and sleep efficiency. At baseline, there were no differences in levels of salivary amylase between participants who slept fewer than 6 h than those who slept 6 h or more a night. Short sleep duration was not associated with salivary amylase responses to stress challenge (Table 5). At baseline, participants with low sleep efficiency had higher levels of amylase than those with high sleep efficiency in models 2–4 (mean difference at fully adjusted model 0.45 log U/mL; 95% CI 0.04, 0.86). However, sleep efficiency was not associated with amylase responses to mental or orthostatic challenge (Table 5).
Table 5.
Mean differences in log-transformed amylase ((log (u/ml)) at baseline and mean differences in responses to stress challenge by sleep duration and sleep efficiency.

DISCUSSION
In a population-based sample, we found that participants who slept < 6 hours/night had higher baseline values of HR than those who slept 7 h or more per night by approximately 5%. Participants who slept fewer than 6 h per night had also greater HR orthostatic reactivity that those who slept 7 h or more per night. Participants who slept between 6 and less than 7 h per night had lower baseline values of HF-HRV than those who slept 7 h or more per night. We also found that participants with low sleep efficiency had lower baseline values of HF-HRV than those with higher sleep efficiency. Finally, low sleep efficiency but not short sleep duration was associated with higher baseline levels of amylase.
Our data provide some support for the hypothesis that insufficient sleep influences autonomic modulation. Although we did not find strong differences in the responses to stress for the reactivity measures, we did find differences in HR, HF-HRV and amylase at baseline in those with short versus longer sleep duration and low versus higher sleep efficiency.
HRV is modulated by the parasympathetic nervous system and may reflect the effect of acute and/or chronic stress.16 Decreased parasympathetic modulation has been associated with increased risk of morbidity18 and mortality in post-MI patients19 as well as in the general population.18 Few studies have studied the association of sleep parameters and cardiovascular responses to a stress challenge. A study with 20 young volunteers examined cardiovascular reactivity to a stress challenge test involving a Stroop color task and speech task. The speech task had a greater effect on systolic blood pressure reactivity when subjects had had a night of total sleep deprivation compared to a night of normal sleep.28 HR reactivity did not differ across the two sleep situations for any of the stress tasks. In another study with 28 subjects, mental stress was linked to greater HR reactivity to and slower HR recovery from the stressors after 24 h of total sleep deprivation.29 Although these studies have limited generalizability because of small sample sizes, and because they included only young volunteers and were not done under habitual sleep conditions and tested extreme sleep deprivation, they are among the few existing studies of this question available.
Only one previous study has investigated these associations without imposing sleep deprivation. In that study, 79 healthy men aged 18 to 30 y underwent actigraphy for 1 w before a stress protocol that involved three tasks: Stroop color-word interference, a multisource interference task, and a speech preparation and delivery task, all of them followed by a period of recovery. The study found an association of short sleep duration (< 5.5 h) with decreased HF-HRV during the stress task and slower HR recovery.31 In our data, we found that participants who slept between 6 and less than 7 h per night (compared to those who slept 7 h or more per night) had decreased values of HF-HRV at baseline but there were no differences in reactivity to challenge. HF-HRV recovery from mental stress was greater in the short sleep duration (< 7 h per night) group compared to the longer sleep duration (≥ 7 h per night) when we dichotomized sleep duration at 7 h.
We also found that those participants who slept less than 7 h per night had greater HR reactivity to mental stress compared to those who slept 7 h or more per night in a model that included demographics, behavioral factors, medications, and sleep apnea, but this association was attenuated when we further adjusted for daytime nap time. There is an inverse correlation between sleep duration (hours) and nap time (R = −0.35, P < 0.0001) in the overall sample, which is driven by the correlation between sleep duration and nap time of those who slept less than 6 h per night (R = −0.35, P < 0.0001). Beneficial effects of naps have been reported, especially among younger adults. In young volunteers, at least one study55 has shown the countereffect on immune function from 30-min midday nap in subjects with sleep deprivation the night before. In more recent studies also in young volunteers, 30-min naps after sleep restriction in a laboratory setting restored urinary norepinephrine levels,56 and 45- to 60-min naps facilitated blood pressure recovery from mental stressors.57 We did not find an interaction effect between sleep duration and naptime.
The influence of sleep characteristics on hormonal (i.e. cortisol, amylase) responses to stressors has been examined in animals58 and in restricted human population samples, only children38,59 or only women.60 In a more recent study39 with 108 young adults ages 17 to 22 y, sleep restriction was imposed on the participants before a social stressor task. The study found differences in sAA at baseline but no differences in the response to the stress task in the two groups (with sleep restriction versus without). Ours is the first study to examine the influence of habitual sleep characteristics on sAA responses in a population-based sample. We did not find an association of sleep duration or quality with amylase responses, but we found higher amylase level at baseline in the group with lower sleep efficiency.
Our study has several limitations. First, we may have missed a greater effect of short sleep duration and an effect of low sleep efficiency on the neuroendocrine responses to a stress challenge protocol because of lack of power. In our sample, i.e. only 10% of participants had low (< 85%) sleep efficiency. Second, 88% of our study participants were taking at least one prescribed medication and 42% were taking 5 or more prescribed medications at the time of the MESA examination. We attempted to address medication use by either excluding or adjusting for medications thought to interact with HR/HRV response or the secretion of amylase. Third, we may have missed the amylase response to each mental stress and orthostatic stress because the second salivary amylase sample was assessed after the two mental stressors and their respective recovery period whereas the third sample, which was collected at the end of the orthostatic task and at approximately 17 min of recovery from the previous task, may be an accumulation of mental stress and orthostatic stress. Fourth, many participants may not have minded the mental stressors as much as participants in other studies. Fifth, our study is cross-sectional with respect to the association between sleep parameters and responses to the stress challenge. Sixth, we have made multiple comparisons. We also did not account for stressful events preceding the stress challenge that may have affected its response. Finally, we used a self-report measure of insomnia symptoms, and it is known that some individuals with insomnia experience less insomnia during objective polysomnography sleep monitoring.61 Thus, it is possible that alterations in sleep duration or architecture may have been under-estimated by a single night study. We cannot assess whether our sample included a group with “sleep state misperception insomnia.”
Our study also has several strengths. First, the MESA Study is an epidemiological study of a population-based sample with heterogeneous background, among whom we collected cardiovascular measures and salivary amylase in response to a standardized stress challenge protocol in a large sample of subjects with protocol-based objective sleep data. Second, we have objective measures of sleep, collected under “normal” circumstances at home without imposing sleep restriction. Third, we included in our models an objective measure of sleep apnea. Fourth, the MESA cohort is exceptionally well characterized with respect to covariates. Our analytic models took into account of all of the data from the various time segments of the stress challenge test.
In summary, we found in a community-based sample, that short sleep duration, low sleep efficiency, and insomnia combined with short sleep efficiency were associated with measures of autonomic modulation that indicate lower levels of cardiac vagal regulation and higher levels of sympathetic function measured as salivary alpha amylase.
DISCLOSURE STATEMENT
This was not an industry supported study. This work was supported by R01 HL076831 (PI: Ana V. Diez Roux) and by R01 HL098433 (PI: Susan Redline). MESA was supported by contracts N01-HC-95159, N01-HC-95160, N01-HC-95161, N01-HC-95162, N01-HC-95163, N01-HC-95164, N01-HC-95165, N01-HC-95166, N01-HC-95167, N01-HC-95168 and N01-HC-95169 from the National Heart, Lung, and Blood Institute and by grants UL1-TR-000040 and UL1-TR-001079 from NCRR. Dr. Redline has received research support from Jazz. The other authors have indicated no financial conflicts of interest. This work was performed at the following MESA Field centers: Columbia University Medical Center, New York, John Hopkins Hospital, Maryland, and University of California, CA.
ACKNOWLEDGMENTS
The authors thank the other investigators, the staff, and the participants of the MESA study for their valuable contributions. A full list of participating MESA investigators and institutions can be found at http://www.mesa-nhlbi.org.
REFERENCES
- 1.Meisinger C, Heier M, Lowel H, Schneider A, Doring A. Sleep duration and sleep complaints and risk of myocardial infarction in middle-aged men and women from the general population: the MONICA/KORA Augsburg cohort study. Sleep. 2007;30:1121–7. doi: 10.1093/sleep/30.9.1121. [DOI] [PMC free article] [PubMed] [Google Scholar]
- 2.Mallon L, Broman JE, Hetta J. Sleep complaints predict coronary artery disease mortality in males: a 12-year follow-up study of a middle-aged Swedish population. J Intern Med. 2002;251:207–16. doi: 10.1046/j.1365-2796.2002.00941.x. [DOI] [PubMed] [Google Scholar]
- 3.Laugsand LE, Vatten LJ, Platou C, Janszky I. Insomnia and the risk of acute myocardial infarction: a population study. Circulation. 2011;124:2073–81. doi: 10.1161/CIRCULATIONAHA.111.025858. [DOI] [PubMed] [Google Scholar]
- 4.Li Y, Zhang X, Winkelman JW, et al. Association between insomnia symptoms and mortality: a prospective study of U.S. men. Circulation. 2014;129:737–46. doi: 10.1161/CIRCULATIONAHA.113.004500. [DOI] [PMC free article] [PubMed] [Google Scholar]
- 5.King CR, Knutson KL, Rathouz PJ, Sidney S, Liu K, Lauderdale DS. Short sleep duration and incident coronary artery calcification. JAMA. 2008;300:2859–66. doi: 10.1001/jama.2008.867. [DOI] [PMC free article] [PubMed] [Google Scholar]
- 6.Gangwisch JE, Heymsfield SB, Boden-Albala B, et al. Short sleep duration as a risk factor for hypertension: analyses of the first National Health and Nutrition Examination Survey. Hypertension. 2006;47:833–9. doi: 10.1161/01.HYP.0000217362.34748.e0. [DOI] [PubMed] [Google Scholar]
- 7.Gottlieb DJ, Redline S, Nieto FJ, et al. Association of usual sleep duration with hypertension: the Sleep Heart Health Study. Sleep. 2006;29:1009–14. doi: 10.1093/sleep/29.8.1009. [DOI] [PubMed] [Google Scholar]
- 8.Ayas NT, White DP, Al-Delaimy WK. A prospective study of self-reported sleep duration and incident diabetes in women. Diabetes Care. 2003;26:380–4. doi: 10.2337/diacare.26.2.380. [DOI] [PubMed] [Google Scholar]
- 9.Chaput JP, Despres JP, Bouchard C, Tremblay A. The association between sleep duration and weight gain in adults: a 6-year prospective study from the Quebec Family Study. Sleep. 2008;31:517–23. doi: 10.1093/sleep/31.4.517. [DOI] [PMC free article] [PubMed] [Google Scholar]
- 10.Irwin M, Thompson J, Miller C, Gillin JC, Ziegler M. Effects of sleep and sleep deprivation on catecholamine and interleukin-2 levels in humans: clinical implications. J Clin Endocrinol Metab. 1999;84:1979–85. doi: 10.1210/jcem.84.6.5788. [DOI] [PubMed] [Google Scholar]
- 11.Dodt C, Breckling U, Derad I, Fehm HL, Born J. Plasma epinephrine and norepinephrine concentrations of healthy humans associated with nighttime sleep and morning arousal. Hypertension. 1997;30:71–6. doi: 10.1161/01.hyp.30.1.71. [DOI] [PubMed] [Google Scholar]
- 12.Rasch B, Dodt C, Molle M, Born J. Sleep-stage-specific regulation of plasma catecholamine concentration. Psychoneuroendocrinology. 2007;32:884–91. doi: 10.1016/j.psyneuen.2007.06.007. [DOI] [PubMed] [Google Scholar]
- 13.Bonnet MH, Arand DL. Heart rate variability in insomniacs and matched normal sleepers. Psychosom Med. 1998;60:610–5. doi: 10.1097/00006842-199809000-00017. [DOI] [PubMed] [Google Scholar]
- 14.Barnett KJ, Cooper NJ. The effects of a poor night sleep on mood, cognitive, autonomic and electrophysiological measures. J Integr Neurosci. 2008;7:405–20. doi: 10.1142/s0219635208001903. [DOI] [PubMed] [Google Scholar]
- 15.Takase B, Tasshi A, Satomura K, et al. Effects of chronic sleep deprivation on autonomic activity by examining heart rate variability, plasma catecholamine,and intracellular magnesium levels. Biomed Pharmacother. 2004;58:S35–9. doi: 10.1016/s0753-3322(04)80007-6. [DOI] [PubMed] [Google Scholar]
- 16.Stein PK, Pu Y. Heart rate variability, sleep and sleep disorders. Sleep Med Rev. 2012;16:47–66. doi: 10.1016/j.smrv.2011.02.005. [DOI] [PubMed] [Google Scholar]
- 17.Kleiger RE, Stein PK, Bigger JT. Heart rate variability: measurement and clinical utility. Ann Noninvasive Electrocardiol. 2005;10:88–101. doi: 10.1111/j.1542-474X.2005.10101.x. [DOI] [PMC free article] [PubMed] [Google Scholar]
- 18.Wulsin LR, Horn PS, Perry JL, Massaro JM, D'Agostino RB. Autonomic imbalance as a predictor of metabolic risks, cardiovascular disease, diabetes, and mortality. J Clin Endocrinol Metab. 2015;100:2443–8. doi: 10.1210/jc.2015-1748. [DOI] [PubMed] [Google Scholar]
- 19.Cripps TR, Malik M, Farrell TG, Camm AJ. Prognostic value of reduced heart rate variability after myocardial infarction: clinical evaluation of a new analysis method. Br Heart J. 1991;65:14–9. doi: 10.1136/hrt.65.1.14. [DOI] [PMC free article] [PubMed] [Google Scholar]
- 20.Carroll D, Smith GD, Shipley MJ, Steptoe A, Brunner EJ, Marmot MG. Blood pressure reactions to acute psychological stress and future blood pressure status: a 10-year follow-up of men in the Whitehall II study. Psychosom Med. 2001;63:737–43. doi: 10.1097/00006842-200109000-00006. [DOI] [PubMed] [Google Scholar]
- 21.Matthews KA, Zhu S, Tucker DC, Whooley MA. Blood pressure reactivity to psychological stress and coronary calcification in the Coronary Artery Risk Development in Young Adults Study. Hypertension. 2006;47:391–95. doi: 10.1161/01.HYP.0000200713.44895.38. [DOI] [PubMed] [Google Scholar]
- 22.Jennings JR, Kamarck TW, Everson-Rose SA, Kaplan GA, Manuck SB, Salonen JT. Exaggerated blood pressure responses during mental stress are prospectively related to enhanced carotid atherosclerosis in middle-aged Finnish men. Circulation. 2004;110:2198–203. doi: 10.1161/01.CIR.0000143840.77061.E9. [DOI] [PubMed] [Google Scholar]
- 23.Steptoe A, Donald AE, O'Donnell K, Marmot M, Deanfield JE. Delayed blood pressure recovery after psychological stress is associated with carotid intima-media thickness: Whitehall psychobiology study. Arterioscler Thromb Vasc Biol. 2006;26:2547–51. doi: 10.1161/01.ATV.0000242792.93486.0d. [DOI] [PubMed] [Google Scholar]
- 24.Mensink GB, Hoffmeister H. The relationship between resting heart rate and all-cause, cardiovascular and cancer mortality. Eur Heart J. 1997;18:1404–10. doi: 10.1093/oxfordjournals.eurheartj.a015465. [DOI] [PubMed] [Google Scholar]
- 25.Sandvik L, Erikssen J, Ellestad M, et al. Heart rate increase and maximal heart rate during exercise as predictors of cardiovascular mortality: a 16-year follow-up study of 1960 healthy men. Coronary Artery Dis. 1995;6:667–79. doi: 10.1097/00019501-199508000-00012. [DOI] [PubMed] [Google Scholar]
- 26.Cole CR, Blackstone EH, Pashkow FJ, Snader CE, Lauer MS. Heart-rate recovery immediately after exercise as a predictor of mortality. N Engl J Med. 1999;341:1351–7. doi: 10.1056/NEJM199910283411804. [DOI] [PubMed] [Google Scholar]
- 27.Zhong X, Hilton HJ, Gates GJ, et al. Increased sympathetic and decreased parasympathetic cardiovascular modulation in normal humans with acute sleep deprivation. J Appl Physiol. 2005;98:2024–32. doi: 10.1152/japplphysiol.00620.2004. [DOI] [PubMed] [Google Scholar]
- 28.Franzen PL, Gianaros PJ, Marsland AL, et al. Cardiovascular reactivity to acute psychological stress following sleep deprivation. Psychosom Med. 2011;73:679–82. doi: 10.1097/PSY.0b013e31822ff440. [DOI] [PMC free article] [PubMed] [Google Scholar]
- 29.Yang H, Durocher JJ, Larson RA, DellaValla JP, Carter JR. Total sleep deprivation alters cardiovascular reactivity to acute stressors in humans. J Appl Physiol. 2012;113:903–8. doi: 10.1152/japplphysiol.00561.2012. [DOI] [PMC free article] [PubMed] [Google Scholar]
- 30.Kato M, Phillips BG, Sigurdsson G, Narkiewicz K, Pesek CA, Somers VK. Effects of sleep deprivation on neural circulatory control. Hypertension. 2000;35:1173–5. doi: 10.1161/01.hyp.35.5.1173. [DOI] [PubMed] [Google Scholar]
- 31.Mezick EJ, Matthews KA, Hall MH, Richard Jennings J, Kamarck TW. Sleep duration and cardiovascular responses to stress in undergraduate men. Psychophysiology. 2014;51:88–96. doi: 10.1111/psyp.12144. [DOI] [PMC free article] [PubMed] [Google Scholar]
- 32.Rohleder N, Nater UM, Wolf JM, Ehlert U, Kirschbaum C. Psychosocial stress-induced activation of salivary alpha-amylase: an indicator of sympathetic activity? Ann N Y Acad Sci. 2004;1032:258–63. doi: 10.1196/annals.1314.033. [DOI] [PubMed] [Google Scholar]
- 33.Rohleder N, Nater UM. Determinants of salivary alpha-amylase in humans and methodological considerations. Psychoneuroendocrinology. 2009;34:469–85. doi: 10.1016/j.psyneuen.2008.12.004. [DOI] [PubMed] [Google Scholar]
- 34.Nater UM, La Marca R, Florin L, et al. Stress-induced changes in human salivary alpha-amylase activity -- associations with adrenergic activity. Psychoneuroendocrinology. 2006;31:49–58. doi: 10.1016/j.psyneuen.2005.05.010. [DOI] [PubMed] [Google Scholar]
- 35.Chatterton RT, Jr., Vogelsong KM, Lu YC, Ellman AB, Hudgens GA. Salivary alpha-amylase as a measure of endogenous adrenergic activity. Clin Physiol. 1996;16:433–48. doi: 10.1111/j.1475-097x.1996.tb00731.x. [DOI] [PubMed] [Google Scholar]
- 36.Bosch JA, De Geus EJC, Veerman ECI, Hoogstraten J, Amerongen AVN. Innate secretory immunity in response to laboratory stressors that evoke distinct patterns of cardiac autonomic activity. Psychosom Med. 2003;65:245–58. doi: 10.1097/01.psy.0000058376.50240.2d. [DOI] [PubMed] [Google Scholar]
- 37.Nater UM, Rohleder N, Gaab J, et al. Human salivary alpha-amylase reactivity in a psychosocial stress paradigm. Int J Psychophysiol. 2005;55:333–42. doi: 10.1016/j.ijpsycho.2004.09.009. [DOI] [PubMed] [Google Scholar]
- 38.Raikkonen K, Matthews KA, Pesonen AK, et al. Poor sleep and altered hypothalamic-pituitary-adrenocortical and sympatho-adrenal-medullary system activity in children. J Clin Endocrinol Metab. 2010;95:2254–61. doi: 10.1210/jc.2009-0943. [DOI] [PubMed] [Google Scholar]
- 39.O'Leary ED, Siobhan H, Hughes BM, James Je. Salivary-alpha-amylase reactivity to laboratory social stress with and without acute sleep restriction. J Psychophysiol. 2015;29:55–63. [Google Scholar]
- 40.Bild DE, Bluemke DA, Burke GL, et al. Multi-Ethnic Study of Atherosclerosis: objectives and design. Am J Epidemiol. 2002;156:871–81. doi: 10.1093/aje/kwf113. [DOI] [PubMed] [Google Scholar]
- 41.Oakley NR. Bend, OR: Mini Mitter, Cambridge Neurotechnology; 1997. Validation with polysomnography of the sleepwatch sleep/wake scoring algorithm used by the actiwatch activity monitoring system. [Google Scholar]
- 42.Stone KL, Ancoli-Israel S, Blackwell T, et al. Actigraphy-measured sleep characteristics and risk of falls in older women. Arch Intern Med. 2008;168:1768–75. doi: 10.1001/archinte.168.16.1768. [DOI] [PubMed] [Google Scholar]
- 43.Quan SF, Griswold ME, Iber C, et al. Short-term variability of respiration and sleep during unattended nonlaboratory polysomnography--the Sleep Heart Health Study. [corrected] Sleep. 2002;25:843–9. [PubMed] [Google Scholar]
- 44.Ross AJ, Yang H, Larson RA, Carter JR. Sleep efficiency and nocturnal hemodynamic dipping in young, normotensive adults. Am J Physiol Regul Integr Comp Physiol. 2014;307:R888–92. doi: 10.1152/ajpregu.00211.2014. [DOI] [PubMed] [Google Scholar]
- 45.Levine DW, Dailey ME, Rockhill B, Tipping D, Naughton MJ, Shumaker SA. Validation of the Women's Health Initiative Insomnia Rating Scale in a multicenter controlled clinical trial. Psychosom Med. 2005;67:98–104. doi: 10.1097/01.psy.0000151743.58067.f0. [DOI] [PubMed] [Google Scholar]
- 46.Turner JR, Hewitt JK, Morgan RK, Sims J, Carroll D, Kelly KA. Graded mental arithmetic as an active psychological challenge. Int J Psychophysiol. 1986;3:307–9. doi: 10.1016/0167-8760(86)90039-5. [DOI] [PubMed] [Google Scholar]
- 47.Berntson GG, Q K, Lang JF, Boysen ST. An approach to artifact identification: application to heart period data. Psychophysiology. 1990;27:586–98. doi: 10.1111/j.1469-8986.1990.tb01982.x. [DOI] [PubMed] [Google Scholar]
- 48.Dykes FD, A P, Baldzer K, Carrigan TA, Kitney RI, Giddens DP. Breath amplitude modulation of heart rate variability in normal full term neonates. Pediatr Res. 1986;20:301. doi: 10.1203/00006450-198604000-00005. [DOI] [PubMed] [Google Scholar]
- 49.DeBoer RW, K J, Strackee J. Comparing spectra of a series of point events, particularly for heart rate variability spectra. IEEE Trans Biomed Eng. 1984;31:384–7. doi: 10.1109/TBME.1984.325351. [DOI] [PubMed] [Google Scholar]
- 50.Harris F. On the use of windows for harmonic analysis with the discrete Fourier transform. Proc IEEE. 1978;66:51–83. [Google Scholar]
- 51.Valentini M, Parati G. Variables influencing heart rate. Prog Cardiovasc Dis. 2009;52:11–9. doi: 10.1016/j.pcad.2009.05.004. [DOI] [PubMed] [Google Scholar]
- 52.Chen X, Wang R, Zee P, et al. Racial/ethnic differences in sleep disturbances: the Multi-Ethnic Study of Atherosclerosis (MESA) Sleep. 2015;38:877–88. doi: 10.5665/sleep.4732. [DOI] [PMC free article] [PubMed] [Google Scholar]
- 53.Milner CE, Cote KA. Benefits of napping in healthy adults: impact of nap length, time of day, age, and experience with napping. J Sleep Res. 2009;18:272–81. doi: 10.1111/j.1365-2869.2008.00718.x. [DOI] [PubMed] [Google Scholar]
- 54.Stone KL, Ewing SK, Ancoli-Israel S, et al. Self-reported sleep and nap habits and risk of mortality in a large cohort of older women. J Am Geriatr Soc. 2009;57:604–11. doi: 10.1111/j.1532-5415.2008.02171.x. [DOI] [PMC free article] [PubMed] [Google Scholar]
- 55.Faraut B, Boudjeltia KZ, Dyzma M, et al. Benefits of napping and an extended duration of recovery sleep on alertness and immune cells after acute sleep restriction. Brain Behav Immun. 2011;25:16–24. doi: 10.1016/j.bbi.2010.08.001. [DOI] [PubMed] [Google Scholar]
- 56.Faraut B, Nakib S, Drogou C, et al. Napping reverses the salivary interleukin-6 and urinary norepinephrine changes induced by sleep restriction. J Clin Endocrinol Metab. 2015;100:E416–26. doi: 10.1210/jc.2014-2566. [DOI] [PubMed] [Google Scholar]
- 57.Brindle RC, Conklin SM. Daytime sleep accelerates cardiovascular recovery after psychological stress. Int J Behav Med. 2012;19:111–4. doi: 10.1007/s12529-011-9150-0. [DOI] [PubMed] [Google Scholar]
- 58.Meerlo P, Sgoifo A, Suchecki D. Restricted and disrupted sleep: effects on autonomic function, neuroendocrine stress systems and stress responsivity. Sleep Med Rev. 2008;12:197–210. doi: 10.1016/j.smrv.2007.07.007. [DOI] [PubMed] [Google Scholar]
- 59.Capaldi Ii VF, Handwerger K, Richardson E, Stroud LR. Associations between sleep and cortisol responses to stress in children and adolescents: a pilot study. Behav Sleep Med. 2005;3:177–92. doi: 10.1207/s15402010bsm0304_1. [DOI] [PubMed] [Google Scholar]
- 60.Wright C, Valdimarsdottir H, Erblich J, Bovbjerg D. Poor sleep the night before an experimental stress task is associated with reduced cortisol reactivity in healthy women. Biol Psychol. 2007;74:319–327. doi: 10.1016/j.biopsycho.2006.08.003. [DOI] [PubMed] [Google Scholar]
- 61.Buysse DJ, Ancoli-Israel S, Edinger JD, Lichstein KL, Morin CM. Recommendations for a standard research assessment of insomnia. Sleep. 2006;29:1155–73. doi: 10.1093/sleep/29.9.1155. [DOI] [PubMed] [Google Scholar]
Associated Data
This section collects any data citations, data availability statements, or supplementary materials included in this article.