Abstract
Estimating organ dose for clinical patients requires accurate modeling of the patient anatomy and the dose field of the CT exam. The modeling of patient anatomy can be achieved using a library of representative computational phantoms (Samei et al 2014 Pediatr. Radiol. 44 460–7). The modeling of the dose field can be challenging for CT exams performed with a tube current modulation (TCM) technique. The purpose of this work was to effectively model the dose field for TCM exams using a convolution-based method. A framework was further proposed for prospective and retrospective organ dose estimation in clinical practice.
The study included 60 adult patients (age range: 18–70 years, weight range: 60–180 kg). Patient-specific computational phantoms were generated based on patient CT image datasets. A previously validated Monte Carlo simulation program was used to model a clinical CT scanner (SOMATOM Definition Flash, Siemens Healthcare, Forchheim, Germany). A practical strategy was developed to achieve real-time organ dose estimation for a given clinical patient. CTDIvol-normalized organ dose coefficients (hOrgan) under constant tube current were estimated and modeled as a function of patient size. Each clinical patient in the library was optimally matched to another computational phantom to obtain a representation of organ location/distribution. The patient organ distribution was convolved with a dose distribution profile to generate (CTDIvol)organ, convolution values that quantified the regional dose field for each organ. The organ dose was estimated by multiplying (CTDIvol)organ, convolution with the organ dose coefficients (hOrgan). To validate the accuracy of this dose estimation technique, the organ dose of the original clinical patient was estimated using Monte Carlo program with TCM profiles explicitly modeled. The discrepancy between the estimated organ dose and dose simulated using TCM Monte Carlo program was quantified. We further compared the convolution-based organ dose estimation method with two other strategies with different approaches of quantifying the irradiation field.
The proposed convolution-based estimation method showed good accuracy with the organ dose simulated using the TCM Monte Carlo simulation. The average percentage error (normalized by CTDIvol) was generally within 10% across all organs and modulation profiles, except for organs located in the pelvic and shoulder regions.
This study developed an improved method that accurately quantifies the irradiation field under TCM scans. The results suggested that organ dose could be estimated in real-time both prospectively (with the localizer information only) and retrospectively (with acquired CT data).
Keywords: CT, computed tomography, Monte Carlo, organ dose, tube current modulation, patient specific
1. Introduction
Substantial technical improvements have led to the expanding use of computed tomography (CT) in clinical practice (McCollough et al 2012, Miglioretti et al 2013). Although CT use is usually well justified by its significant medical benefits, concerns have been raised regarding CT radiation exposure at the population level (Brenner and Hall 2007). Thus, within the CT community, it is well agreed that radiation dose should be closely managed and optimized (ICRP 2007a, Singh et al 2014, Trattner et al 2014). As a fundamental step in achieving dose management, it is crucial to accurately quantify patient dose. Such quantification can aid in improved dose recording and monitoring programs by including information pertaining to the specific patient, in individualized patient imaging management decisions, and in the assessment and improvement of CT protocols.
Organ dose is generally regarded as one of the most appropriate quantities for characterizing patient radiation burden (Costello et al 2013). Precise estimation of organ dose requires effective modeling of the patient anatomy. Over the decades, various research groups have made efforts to develop anthropomorphic phantoms to effectively model patient anatomy for organ dose estimation. The first attempt could be dated back to dose estimation software based on mathematical phantoms in the 1980s (CT Imaging6, ImPact7, CT-Expo8). Recent work includes the organ dose simulation on voxelized or hybrid computation phantoms. Several recent studies have demonstrated the feasibility of using a large library of computational phantoms and quantifying patient anatomical factors with a database of protocol-, patient-, and organ-specific CTDIvol-normalized-organ dose coefficients (Li et al 2011, Turner et al 2011, Geyer et al 2014, Sahbaee et al 2014, Tian et al 2014).
Beyond effective modeling of the patient anatomy, organ dose estimation further requires accurate modeling of the irradiation conditions of the CT system. This is particularly challenging for CT examinations performed with TCM. The central challenge is to quantify the dose field under TCM and model its impact on organ dose. The traditional way of quantifying irradiation field using CTDIvol for the TCM examination is highly limited since it is estimated using the average tube current of the whole exam and cannot reflect the local dose field for each organ (Li et al 2014a). Several studies have used the concept of ‘CTDIvol per slice’ proposed by the International Electrotechnical Commission (IEC), which is defined as the CTDIvol value proportional to the tube current at each slice (IEC 2009). However, as illustrated by Dixon and Boone (Dixon and Boone 2013), such ‘CTDIvol per slice’ provides little information about the local dose field as it can not account for the long reach of scatter tail from adjacent slices, which has a large impact on the local dose distribution.
The limitations associated with the scanner-reported and slice-based CTDIvol have a large impact on organ dose estimation for TCM examinations. Currently, organ dose under TCM is assessed with the following typical process: (1) organ dose under constant tube current is simulated and normalized by the examination CTDIvol to obtain organ dose coefficients; (2) a value is derived to quantify the TCM dose field; (3) the is multiplied with organ dose coefficients to estimate TCM organ dose. Due to the aforementioned limitations of these two quantities (scanner-reported and slice-based CTDIvol), the accuracy of such dose estimation strategies is largely limited.
In this study, we address this limitation by modeling the dose profile associated with a TCM scan using a convolution-based technique. The dose profile information was combined with a validated Monte Carlo simulation and a library of computational phantoms to establish a framework for organ dose estimation under TCM. The accuracy of the proposed organ dose estimation method was validated.
2. Materials and methods
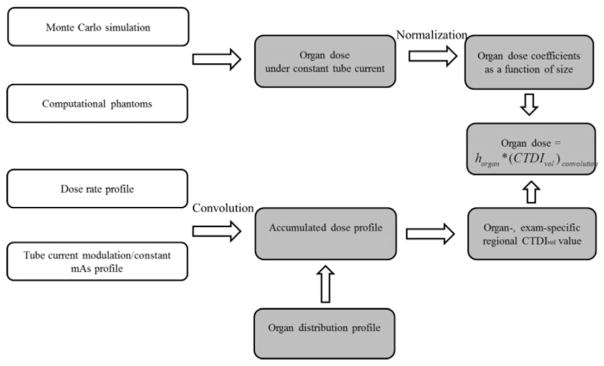
Organ dose is primarily determined by two factors, namely, the patient anatomy and the dose field. In this study, a systematic method was developed to model both factors (figure 1).
Figure 1.
Schematic diagram of the proposed organ dose estimation method for TCM scans.
The patient anatomy modeling must reflect the anatomical diversity and complexity of the patient population. To achieve this diversity, we developed a library of computational phantoms with representative ages, sizes, and genders. The computational phantoms were further combined with a validated Monte Carlo (MC) simulation program to estimate organ dose under constant tube current conditions. Such organ dose values were normalized by CTDIvol and modeled as a function of patient size to derive the so-called hOrgan, which can be regarded as a factor that relates the organ dose values to patient anatomy under a unified dose field (constant tube current condition). It is thus used as the basis to estimate organ dose under an arbitrary dose field depending on the detailed TCM profile.
The dose field modeling needs to effectively quantify the heterogeneous dose distribution created by dynamic tube current changes. The dose spread function of a thin beam (38.4 mm full-width) was generated by Monte Carlo simulation, depicting the dose distribution for an infinitely long CTDI phantom. The dose spread function was convolved with the TCM and constant tube current profiles to generate the 3D accumulated dose distributions for TCM and constant tube current examinations. The difference between the accumulated dose distributions under TCM and constant tube current conditions was determined and overlaid with the patient organ distribution. Based on this information, a regional CTDIvol value was calculated for each organ to account for the local dose field.
2.1. Patient-specific computational models and matching technique
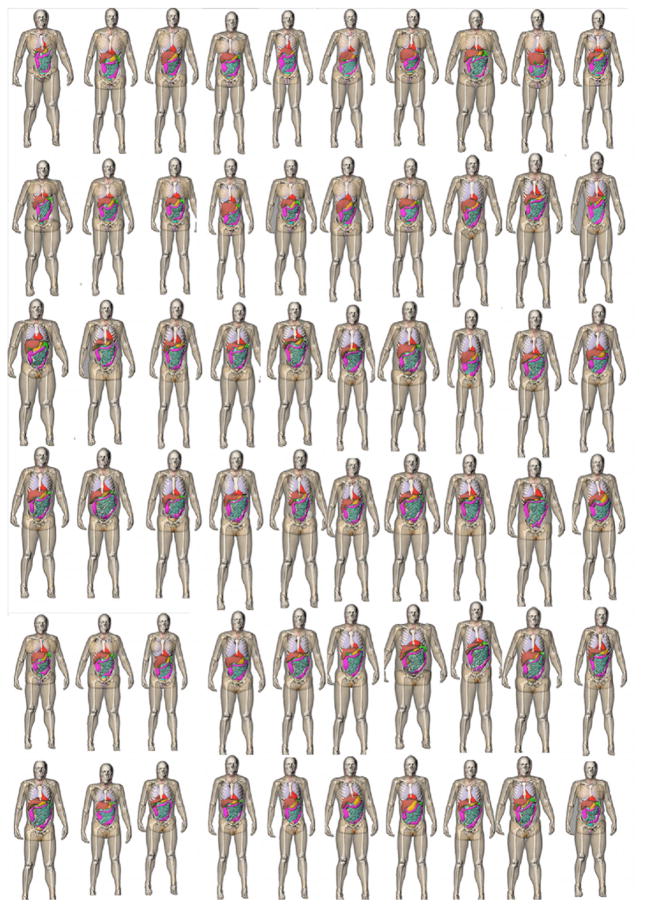
Sixty adult patients (age range, 18–78 years; weight range, 57–180 kg) were included in this study (figure 2). With the institutional review broad approval, they were retrospectively selected from our clinical database and covered a wide distribution of ages/body mass index (BMI) values. The distribution of patient ages, heights/weights, and BMI values are provided in table 1.
Figure 2.
3D frontal views of the series of patient models used in this study. All the arms were raised for simulation of body scans.
Table 1.
Distributions of the patient ages, heights/weights, and BMI values.
| Range | 10 percentile | 50 percentile | 90 percentile | |
|---|---|---|---|---|
| Age | 18–78 | 32 | 52 | 67 |
| Height (cm) | 156–191 | 166 | 176 | 182 |
| Weight (kg) | 57.5–117 | 62.5 | 80.7 | 106.5 |
| BMI | 18.2–39.8 | 20.8 | 26.7 | 33.8 |
Each patient received a chest, abdominopelvic, or chest-abdominal-pelvic scan at our institution for clinical purposes. Based on the clinical CT images, whole-body computational models were created using methods described previously (Segars et al 2010, 2013). In summary, large organs within the CT image volume were segmented into 3D triangulated polygon models. The segmented datasets were further imported into a 3D fitting program (Rhinoceros, www.rhino3d.com) to build 3D non-uniform rational B-spline (NURBS) surfaces. Other organs and structures that were not covered within the image volume were defined by mapping the organs/structures from existing male and female template XCAT models to the segmented patient framework using the multichannel large deformation diffeomorphic metric mapping (MC-LDDMM) technique (Segars et al 2010). The PeopleSize program was used to ensure the size of the organs/structures was properly adjusted (www.openerg.com/psz/index.html). The full-body patient models consisted of 43 and 44 organs for male and female patients, respectively, including most of the radiosensitive organs defined by ICRP publication 103 (ICRP 2007b, Li et al 2011). For the radiosensitive organs that were not explicitly modeled in the phantom (extrathoracic region (ET), salivary glands, and oral mucosa), we used the neighboring organs (pharynx and larynx) to approximate the organ dose values. All models were voxelized into a 3.45 mm resolution for input into the Monte Carlo simulation program (PENELOPE, version 2006, Universitat de Barcelona, Spain) (Baro et al 1995, Sempau 2003).
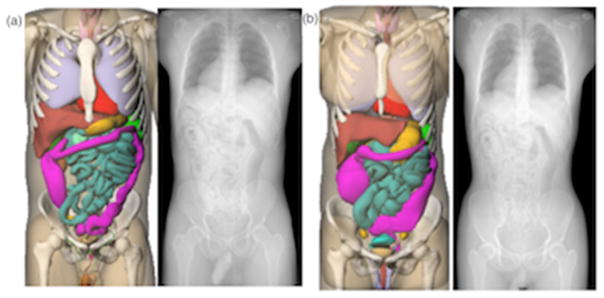
With an atlas of computational phantoms that covers a broad range of human anatomy, a new clinical patient can be matched to a corresponding model that closely resembles the patient in terms of major organ locations. In this study, such strategy was performed for all the patients in the library. The patient trunk height was measured from the topogram image of the patient and matched against XCAT phantoms in the library (Whalen et al 2008). The trunk height is defined as the distance between the top of clavicle to the end of pelvic region. Figure 3 shows two pairs of matched models (male and female patients at 50% height and weight). It should be noted that the purpose of patient matching is to obtain information about the patient’s z dimensional organ distribution prior to the CT examination. Such information will be used to quantify regional irradiation field corresponding to the specific organ as illustrated in section 2.3. Since only the trunk height was used as the matching indicator, matched computational phantom may not have a similar body shape and size with regards to the target patient. The impact of patient size is be reflected by the CTDIvol-normalized-organ dose coefficients as illustrated in section 2.2.
Figure 3.
Example patient-model matching pairs as determined by trunk height. (a) 50th percentile male, (b) 50th percentile male.
2.2. CTDIvol — normalized-organ dose coefficients
Organ dose coefficients under constant tube current condition were estimated using Monte Carlo simulation program as the estimation basis. The simulation program was developed based on a benchmarked Monte Carlo subroutine package for photon transport (PENELOPE, version 2006, Universitat de Barcelona, Spain) (Baro 1995, Sempau 2003). The study modeled the scanning system of a commercial CT scanner (SOMATOM Definition Flash, Siemens Healthcare, Forcheim, Germany). The accuracy of the Monte Carlo simulation was validated against physical measurements as reported previously (Tian et al 2014).
A clinical chest and abdominopelvic scan was simulated for each patient model. For chest exam, the image coverage was defined from 1 cm superior the top of the lung to 1 cm anterior the bottom of the lung. For abdominopelvic exam, the image coverage was defined from 1 cm above the top of the liver to 1 cm below the lowest aspect of the ischium. The scan was performed at tube voltage of 120 kVp, pitch of 0.8, 38.4 mm collimation, standard bowtie filter, and constant tube current condition. Organ dose was estimated by tallying the energy deposited in each organ. Each simulation was performed with 8 × 10⁷ photon histories so that relative errors of less than 1% were achieved for organs inside the field-of-view.
The organ dose was further normalized by the CTDIvol value to obtain the so-called horgan dose coefficient. The 32 cm-dimeter CTDI phantom was used in the study. Further, exponential regression models between horgan and patient body diameter were established as
| (1) |
and
| (2) |
where dchest and dabdo denote the average chest and abdominopelvic diameter, respectively. The average chest diameter was calculated for each model as
| (3) |
where H is the chest region height and V is the chest region volume. A similar method was used to calculate average abdominopelvic diameter for abdominopelvic CT.
These organ dose coefficients model the organ dose as a function of patient size under a simple radiation condition (constant tube current). It serves the basis for the organ dose estimation under an arbitrary dose field.
2.3. Estimation of organ-specific CTDIvol under TCM
This section illustrates a four-step process to generate organ-specific CTDIvol to account for the heterogeneous distribution of the dose field under TCM schemes.
First, the tube current profiles were determined for each computational phantom (Li et al 2014a). In clinical CT systems, the exact TCM principles employed by the manufacturers are generally proprietary. However, a previous study provided information about the general TCM principles across various CT manufacturers (Keat 2005). The tube current modulation for some scanners aims to achieve constant noise levels across patient sizes and body regions (generally GE scanners). Thus, the tube current values are exponentially related to patient attenuation for these scanners. The tube current modulation for other scanners allows for higher noise in high-attenuating body regions and larger patients (generally Siemens scanners). Further, the modulation strength can be adjusted to three levels (weak, average, and strong) to control the tube current depending on patient attenuation. To resemble clinical TCM profiles, a computer program was written to calculate patient attenuation at each projection (Matlab, R2010A; Mathworks, Natick, MA) (Li et al 2014a). The program takes into account the geometry of the CT system, the poly-energetic x-ray energy spectrum, and the attenuation through both the bowtie filter and the patient. The logarithm of tube current is modeled as a function of patient attenuation as
| (4) |
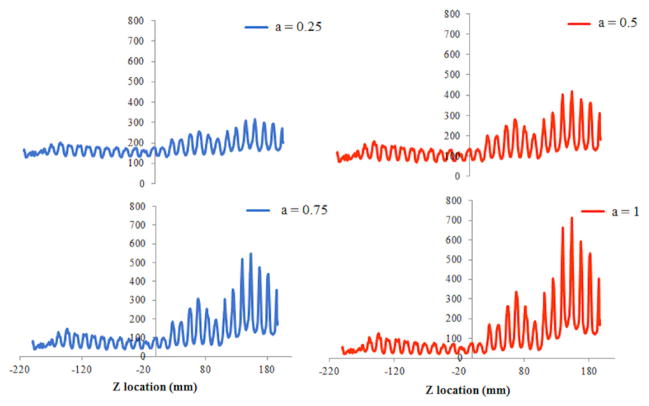
where μd denotes the phantom attenuation, α denotes the modulation strength, and mAo corresponds to the constant tube current, non-modulation DC level. The TCM profiles with α = 1 results in consistent noise level in all measured CT projections, while the TCM profiles with α ranging from 0 to 1 represents TCM profiles with different strength levels (figure 4). The minimum and maximum tube current was set to 10 and 700 mAs to model the tube current range of clinical scanners. It should be noted that this study does not require the simulated mAs profiles to precisely model the actual mAs profiles, which are usually proprietary and vary across vendors. Rather, the purpose is to generate generalized and reasonable tube current profiles based on the principle of TCM.
Figure 4.
Examples of tube current modulation profiles at four modulation strengths (0.25, 0.5, 0.75, and 1). The x axis represents the z dimensional location (in the unit of mm). The y axis represents the tube current value (in the unit of mAs).
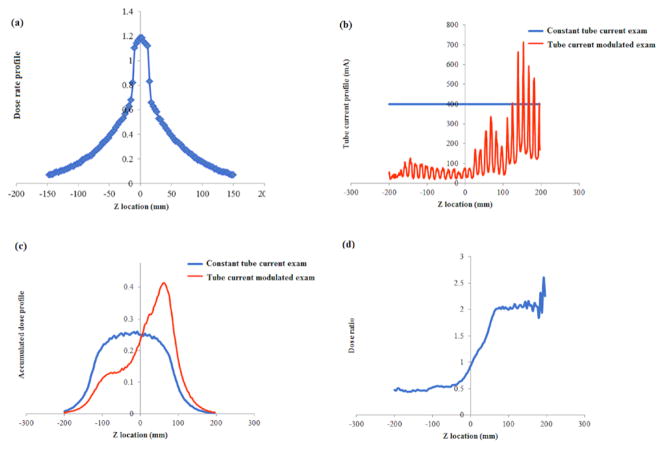
Second, a dose spread function that represents the dose distribution of a thin beam (38.4 mm full width) across an infinitely long CTDI phantom was generated by Monte Carlo simulation (figure 5(a)).
Figure 5.
(a) Dose spread function over an infinitely long CTDI phantom for a thin beam (38.4 mm full width) generated by the Monte Carlo simulation. (b) Example tube current profiles of TCM and constant tube current scans. (c) Accumulated dose profile for TCM and constant tube current scan derived by convolving the dose spread function with tube current profiles. (d) Dose ratio derived by dividing the accumulated dose profile of TCM scan by constant tube current scan.
Third, the dose spread function was convolved with the x-y-z TCM profile to generate the 3D accumulated dose distribution (DCTDI, TCM) of the entire CT exam across an infinitely long CTDI phantom. The accumulated dose distribution of the same exam under constant tube current (DCTDI, Fixed) was also generated by convolving the dose spread function with the constant tube current function. The irradiation fields under both conditions were modeled to be sufficiently long to account for the scattered dose distributed by slices outside the scan coverage.
Fourth, the accumulated dose profile under TCM (DCTDI, TCM) was divided by the accumulated dose profile under constant tube current conditions (DCTDI, Fixed), deriving a function denoted as dose ratio
| (5) |
This dose ratio function describes the difference in the dose field between TCM and constant tube current scans. Since horgan is derived under constant current condition, the dose ratio essentially describes how the specific TCM dose field is different from the dose field from which horgan is derived. Then, the dose ratio function is overlaid with the patient organ distribution to derive the organ-specific CTDIvol value.
The organ-specific CTDIvol factor was computed as
| (6) |
and
| (7) |
where CTDIvol refers to the CTDIvol reported on the CT scanner console, which is derived using the average mAs of the CT exam. Rorgan represents the dose field difference between the specific TCM exam and the constant mAs condition. Dose ratioz is the dose ratio value at location z, and N is the number of organ voxels in the axial slice at location z. Such organ-specific CTDIvol can be regarded as a regional CTDIvol that reflects the difference of the strength of dose field between TCM and constant mAs for a specific organ. It is used as an adjustment factor to account for the regional dose field.
2.4. Organ dose estimation and validation
Using the regional CTDIvol factor to account for local dose field, the organ dose under TCM, denoted as Horgan, can be estimated as
| (8) |
To illustrate the advantages of the proposed convolution-based technique for organ dose estimation, we used two alternative metrics to quantify the irradiation field. The first metric approximated the irradiation field using the scanner-reported CTDIvol, which was estimated using the average tube current value of the TCM examination. The organ dose under TCM was further estimated as
| (9) |
where CTDIvol is the CTDIvol value displayed on the CT scanner console for a TCM scan, which is determined based on the average tube current value of the entire exam.
The second metric used the concept of ‘CTDIvol-per-slice’ proposed by IEC to approximate the local dose field for a specific organ (IEC 2009). The organ dose under TCM was estimated as
| (10) |
where (CTDIvol)organ, weighted is the CTDIvol computed from the weighted average mAs values of all the axial slices containing the organ, i.e. where mAz is the tube current value at location z and Vz is the organ volume in the axial slice at location z. This method approximates the local dose field using the weighted average mAs value at the location of the organ. Furthermore, it took the organ shape into consideration by weighing the tube current value according to the volume of the organ at each slice. However, it assumed the z dimensional dose field can be well represented using the tube current of the slice and neglected the effect of scatter radiation. As demonstrated in prior work, due to portion of scattered radiation from nearby slices, such approximation may result in over or underestimation of the actual dose field (Dixon and Boone 2013).
The accuracy of the three proposed estimation methods are evaluated using the following process: tube current modulation was incorporated into the Monte Carlo program and organ dose was estimated across the 60 patient models as the gold standard. As noted earlier, each patient case was matched to an XCAT model based on trunk height. The organ dose was then estimated using the proposed patient matching and convolution method under five modulation strengths. The estimated doses were compared to the simulated gold standard.
3. Results
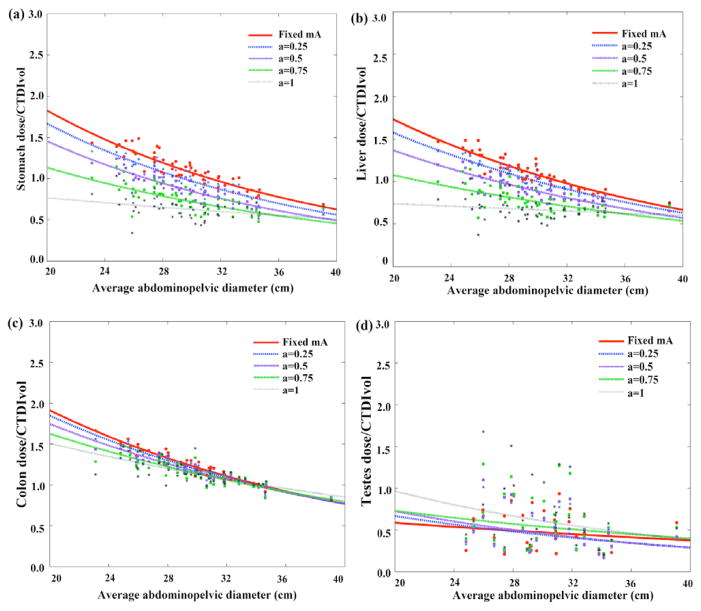
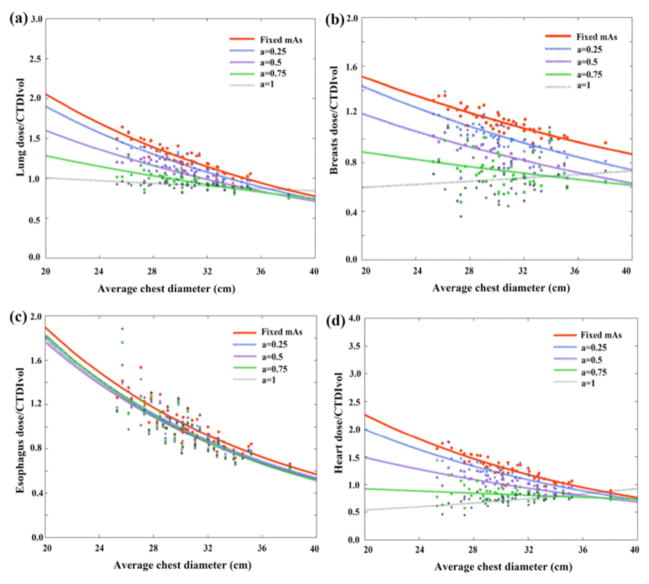
Figures 6 and 7 illustrate the CTDIvol-normalized-organ dose at five modulation strengths based on Monte Carlo simulation across 60 computational models for abdominopelvic and chest exams. Among the five curves, the organ dose coefficients estimated under constant tube current condition were used as the estimation basis. The other four curves, which were estimated by incorporating the detailed TCM profile into the Monte Carlo simulation, were used as the gold standard dose value for each patient.
Figure 6.
Example CTDIvol-normalized-organ dose coefficients for abdominopelvic scans plotted against the average abdominopelvic diameter at five modulation strengths. Among the five curves, the CTDIvol-normalized-organ dose at constant tube current condition (α = 0) was used as the prediction basis. The other four curves were used as the gold standard for the prediction.
Figure 7.
Example CTDIvol-normalized-organ dose coefficients for chest scans plotted against the average abdominopelvic diameter at five modulation strengths. Among the five curves, the CTDIvol-normalized-organ dose at constant tube current condition (a = 0) was used as the prediction basis. The other four curves were used as the gold standard for the prediction.
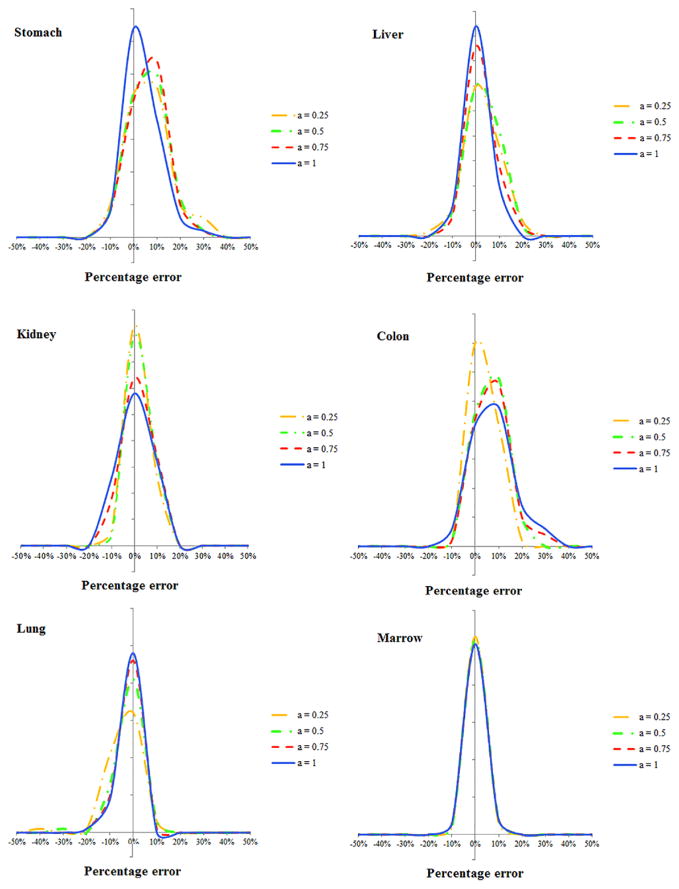
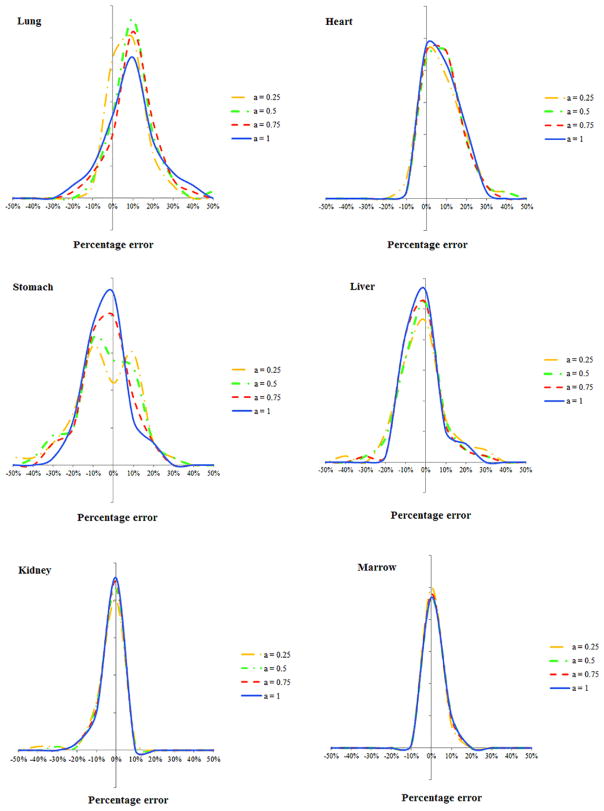
Comparing the results of equation (6) and full Monte Carlo simulation, figures 8 and 9 illustrate the estimation accuracy of organ dose at five modulation strengths using the convolution technique. The histograms of estimation errors for six organs were plotted for abdominopelvic and chest exams. The errors were further normalized by CTDIvol so that the accuracy of a given CT exam can be estimated. As tabulated in tables 2 and 3, the average percentage error of organ dose estimation was generally within 10% across all organs and modulation profiles, except for organs located in the pelvic and shoulder regions.
Figure 8.
Histogram of error in predicting organ dose for the abdominopelvic scans. The x axis is the difference between the estimated and actual organ doses normalized by the CTDIvol of the exam.
Figure 9.
Histogram of error in predicting organ dose for the chest scans. The x axis is determined as the difference between the estimated and actual organ doses normalized by the CTDIvol of the exam.
Table 2.
Mean and standard deviation of differences between organ dose simulated by Monte Carlo (gold standard) and estimated by convolution method for abdominopelvic scans. The difference was normalized by the CTDIvol of the exam to derive the percentage difference.
|
a = 1
|
a = 0.75
|
a = 0.5
|
a = 0.25
|
|||||
|---|---|---|---|---|---|---|---|---|
| Avg (%) | Std (%) | Avg (%) | Std (%) | Avg (%) | Std (%) | Avg (%) | Std (%) | |
| Kidneys | 5.4 | 3.6 | 4.7 | 3.3 | 3.9 | 3.0 | 3.4 | 2.9 |
| Liver | 4 | 3.1 | 4.6 | 3.5 | 5.4 | 4.0 | 5.8 | 4.4 |
| Gall bladder | 7.1 | 5.3 | 7.0 | 5.0 | 7.0 | 4.9 | 6.7 | 4.8 |
| Spleen | 5.5 | 4.4 | 5.1 | 4.3 | 5.5 | 3.9 | 6.1 | 4.2 |
| Stomach | 6.5 | 5.6 | 7.6 | 6 | 8.5 | 6.4 | 8.4 | 6.7 |
| Large intestine | 9.2 | 7.8 | 8.4 | 6.6 | 6.9 | 5.2 | 4.8 | 3.7 |
| Pancreas | 5.2 | 4.3 | 6.1 | 4.5 | 6.5 | 4.4 | 5.7 | 4.2 |
| Prostate | 18.6 | 16.9 | 15.2 | 11.6 | 11.6 | 8.9 | 7.8 | 6.4 |
| Adrenals | 4.1 | 3.4 | 4.5 | 3.7 | 4.8 | 4.1 | 4.6 | 3.8 |
| Small intestine | 10 | 7.9 | 9.9 | 6.6 | 8.7 | 5.0 | 6.0 | 3.6 |
| Ovaries | 17 | 11.7 | 12.5 | 8.1 | 8.7 | 5.5 | 4.8 | 3.5 |
| Uterus | 20.3 | 13.8 | 15.0 | 10.0 | 11.0 | 8.4 | 6.5 | 5.7 |
| Vagina | 22.1 | 18.5 | 15.7 | 13.4 | 11.7 | 11.6 | 8.0 | 10.9 |
| Bladder | 22.1 | 18.0 | 21.9 | 15 | 18.3 | 12.7 | 11.9 | 9.6 |
| Testes | 29.9 | 24.4 | 25.6 | 17.9 | 20.7 | 13.2 | 19 | 12.3 |
| Breasts | 3.2 | 4.8 | 3.6 | 5.1 | 4.3 | 5.8 | 5.0 | 6.9 |
| Heart | 5.4 | 4.6 | 6.2 | 5.3 | 7.2 | 6.6 | 8.1 | 8.1 |
| Lungs | 3.1 | 2.8 | 3.6 | 3.5 | 4.3 | 4.6 | 5.5 | 5.9 |
| Thymus | 1.4 | 1.9 | 1.7 | 2.5 | 2.1 | 3.4 | 2.6 | 4.4 |
| Esophagus | 3.1 | 3.1 | 3.6 | 3.6 | 4.5 | 4.4 | 5.5 | 5.5 |
| Thyroid | 1.1 | 0.5 | 0.9 | 0.6 | 0.8 | 0.6 | 0.8 | 0.7 |
| Bones | 4.9 | 4.4 | 4.2 | 3.9 | 3.8 | 3.5 | 3.6 | 3.3 |
| Skin | 1.6 | 1.2 | 1.5 | 1.2 | 1.5 | 1.2 | 1.5 | 1.2 |
| Marrow | 2.4 | 2 | 2.4 | 1.9 | 2.4 | 1.7 | 2.4 | 1.7 |
Table 3.
Mean and standard deviation of differences between organ dose simulated by Monte Carlo (gold standard) and estimated by convolution method for chest scans. The difference was normalized by the CTDIvol of the exam to derive the percentage difference.
|
a = 1
|
a = 0.75
|
a = 0.5
|
a = 0.25
|
|||||
|---|---|---|---|---|---|---|---|---|
| Avg (%) | Std (%) | Avg (%) | Std (%) | Avg (%) | Std (%) | Avg (%) | Std (%) | |
| Kidneys | 3.5 | 3.3 | 3.8 | 3.9 | 4.3 | 5.0 | 4.9 | 6.4 |
| Liver | 6.9 | 5.7 | 7.3 | 6.2 | 8.1 | 7.2 | 9.2 | 8.7 |
| Gall bladder | 5.9 | 7.4 | 6.3 | 7.7 | 7.0 | 8.4 | 7.9 | 9.9 |
| Spleen | 14.1 | 9.1 | 14.6 | 9.3 | 15.7 | 10.3 | 16.7 | 11.4 |
| Stomach | 8.8 | 7.2 | 9.5 | 7.7 | 10.9 | 8.6 | 12.3 | 10.0 |
| Brain | 0.7 | 1.2 | 0.6 | 1.1 | 0.5 | 0.8 | 0.4 | 0.7 |
| Bladder | 0.0 | 0.0 | 0.0 | 0.0 | 0.1 | 0.1 | 0.1 | 0.1 |
| Large intestine | 2.3 | 2.5 | 2.3 | 2.5 | 2.6 | 2.7 | 2.8 | 2.8 |
| Pancreas | 5.7 | 5.8 | 6.1 | 6.3 | 6.9 | 7.4 | 7.8 | 8.8 |
| Prostate | 0.0 | 0.0 | 0.0 | 0.0 | 0.0 | 0.0 | 0.0 | 0.0 |
| Adrenals | 5.7 | 5.6 | 6.2 | 6.5 | 7.3 | 8.1 | 8.5 | 10.5 |
| Testes | 0.0 | 0.0 | 0.0 | 0.0 | 0.0 | 0.0 | 0.0 | 0.0 |
| Eyes | 0.6 | 0.8 | 0.6 | 0.7 | 0.4 | 0.6 | 0.3 | 0.5 |
| Small intestine | 1.9 | 1.9 | 2.0 | 2.0 | 2.3 | 2.3 | 2.5 | 2.6 |
| Ovaries | 0.1 | 0.1 | 0.1 | 0.1 | 0.1 | 0.1 | 0.1 | 0.1 |
| Uterus | 0.1 | 0.1 | 0.1 | 0.1 | 0.1 | 0.1 | 0.1 | 0.1 |
| Vagina | 0.0 | 0.0 | 0.0 | 0.0 | 0.0 | 0.0 | 0.0 | 0.0 |
| Breasts | 21.9 | 17.2 | 18.9 | 13.2 | 14.6 | 8.6 | 9.5 | 4.5 |
| Heart | 8.6 | 7.2 | 8.9 | 7.4 | 9.8 | 8.1 | 9.3 | 8.1 |
| Lungs | 13.8 | 13.3 | 13.0 | 11.5 | 11.4 | 8.8 | 9.0 | 6.6 |
| Thyroid | 48.1 | 34.6 | 44.9 | 31.9 | 35.6 | 24.0 | 25.1 | 15.5 |
| Thymus | 21.9 | 19.8 | 19.6 | 17.3 | 16.9 | 13.0 | 13.1 | 9.5 |
| Esophagus | 22.7 | 20.6 | 20.6 | 17.4 | 15.6 | 12.1 | 10.7 | 8.0 |
| Bones | 6.9 | 5.7 | 6.0 | 4.6 | 4.8 | 3.3 | 4.3 | 2.9 |
| Marrow | 2.8 | 2.6 | 2.7 | 2.6 | 2.7 | 2.5 | 2.4 | 2.1 |
| Skin | 1.8 | 1.4 | 1.7 | 1.4 | 1.7 | 1.3 | 1.7 | 1.3 |
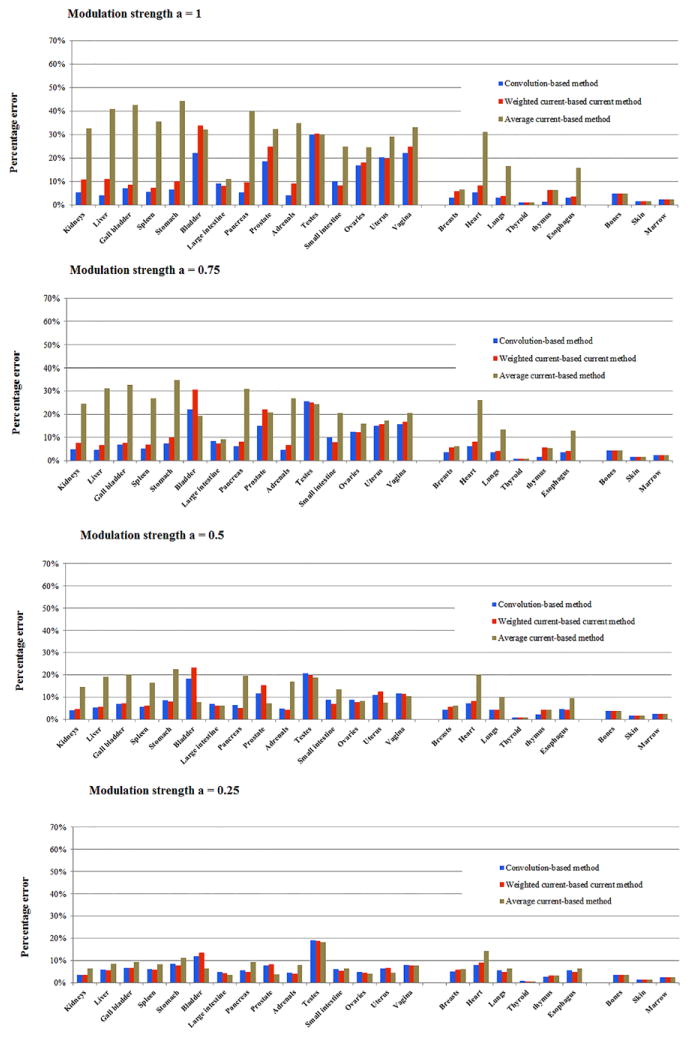
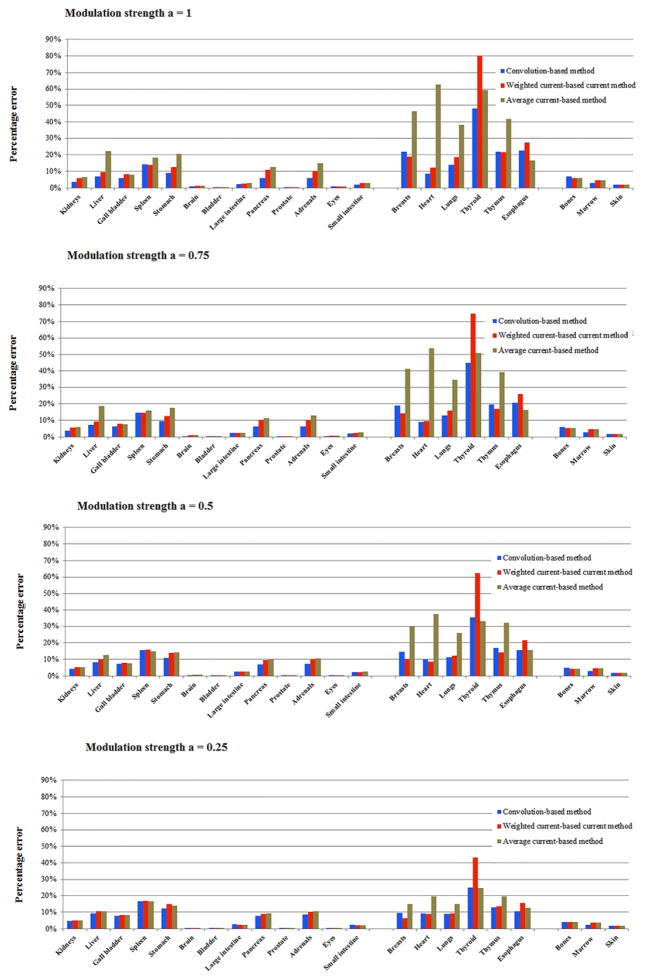
Figures 10 and 11 illustrate the accuracy of the three organ dose estimation strategies for the 60 patients across different modulation strengths. The organ dose estimated by TCM Monte Carlo simulation was used as the gold standard. In general, the approximation method using CTDIvol based on the average mAs of entire exam is a poor estimation of organ dose, with the maximum error above 50%. In comparison, the approximation method using (CTDIvol)organ, weighted significantly improves the accuracy of dose estimation. However, the error is still relatively large for the full modulation case. In general, the estimation method based on (CTDIvol)organ, convolution provided the most accurate estimation across patient models and modulation strengths since it accurately modeled the exact dose distribution at the organ location.
Figure 10.
Average percentage error (normalized by CTDIvol) of the three estimation strategies across four modulation strengths for abdominopelvic scans. Convolution-based method refers to the method using (CTDIvol)organ, convolution to model the local dose field. Weighted current-based method refers to the method using (CTDIvol)organ, weighted to model the dose field. Average current-based method refers to the method using the CTDIvol of entire exam to model the local dose field.
Figure 11.
Average percentage error (normalized by CTDIvol) of the three estimation strategies across four modulation strengths for chest scans. Convolution-based method refers to the method using (CTDIvol)organ, convolution to model the local dose field. Weighted current-based method refers to the method using (CTDIvol)organ, weighted to model the dose field. Average current-based method refers to the method using the CTDIvol of entire exam to model the local dose field.
4. Discussion
Considering the urgent demand for managing and optimizing CT radiation dose, there has been a growing need to assess the level of radiation dose for individual patients in clinical practice. Although previous studies have demonstrated the feasibility of estimating organ dose through either Monte Carlo simulation or physical measurement, there exists a gap when implementing such techniques in clinical practice. The main challenges rely on two facts: (1) organ dose is strongly dependent on patient anatomy, specifically the organ position in the body and the organ position with respect to the radiation source, and (2) organ dose is further strongly dependent on the dose field created by the scanner output. For CT exams performed with the TCM technique, the heterogeneous dose field may not be accurately represented using CTDIvol or other proposed tube current-based quantities. In this study, we demonstrated a framework for estimating organ dose under TCM for clinical CT exams. The patient anatomy was modeled using a library of computational phantoms with anatomical variety and an atlas-based patient-matching technique. The dose field was quantified using a convolution technique that effectively models the primary and scatter radiation dose.
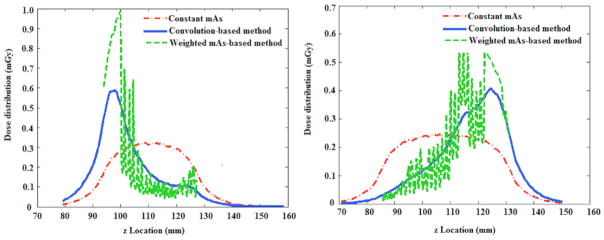
Figure 12 illustrates the quantification of the dose distribution over an infinitely long CTDI phantom using the three methods proposed in this study ((CTDIvol)average, (CTDIvol)organ, weighted,(CTDIvol)organ, convolution). Two specific CT examinations were considered, with one using the TCM profile of a chest CT exam and one using the TCM profile of an abdominopelvic CT exam. The green curve depicts the dose distribution quantified using (CTDIvol)organ, convolution. In this method, the primary and scatter radiation were explicitly modeled with the convolution-based technique. The effect of organ geometrical distribution is further modeled using a weighted function during organ dose estimation process. The red curve depicts the dose distribution approximated using (CTDIvol)average, which is derived using the average tube current of the CT exam. In particular, this method neglects the variation of dose distribution across different body regions and thus leads to large discrepancies for organ dose estimation. The blue curve illustrates the dose field approximated using (CTDIvol)organ, weighted. The weighted method assumes that the dose distribution is linearly proportional to the tube current at each slice and the dose field was scaled based on the tube current value at each location. Although this method accounts for the variation in the dose distribution across body regions, it has two drawbacks. First, it assumes the dose field is identical to the constant tube current condition for the non-irradiated regions, However, if the tube current varies significantly in the start or end location of the exam (shoulder region for the chest CT examination), the scattered dose distribution may significantly differ from the constant tube current case. Second, for irradiated regions, it only accounts for the primary radiation by scaling the dose distribution according to the tube current value. The effect of scattered radiation from adjacent slices is not properly considered.
Figure 12.
The accumulated dose profile derived using the three methods for chest and abdominopelvic exams.
There are three sources of errors in our estimation. The first source is the patient mismatch error, which refers to the location difference of an organ in the patient compared to the corresponding matched computational model. The second is organ dose coefficients error, which refers to the error of using the fitted exponential model and patient size to estimate organ dose coefficients instead of using the actual patient organ dose coefficients. The third source of error is TCM approximation error, which refers to using the convolution technique to approximate organ dose under TCM. The three sources of errors were quantified across the 60 patients. It was found that the second error (organ dose coefficients error) was the dominant factor (on average 8.7% across all organs and patients). While the patient matching error and TCM approximation errors were generally small (on average 2.3% and 1.4%).
Our technique to estimate TCM organ dose using organ dose coefficients and the convolution technique relies on CTDIvol as an intermediary factor. In theory, our method is consistent with a recent publication by Li et al that estimates equilibrium radiation dose for an anthropomorphic phantom, with the distinction that we extend the approach to organ dose and patientspecific models (Li et al 2014b).
Our study has several limitations. Firstly, this study was performed with simulated tube current modulation profiles; further studies should include realistic TCM profiles from manufacturers. Secondly, the patient matching technique used in this study manually measured the trunk height on CT topogram image. Further studies should investigate an automated technique for landmark extraction and patient matching so that the technique can be readily applied to clinical CT examinations. Thirdly, the prediction error, while small for the majority of the organs, was relatively large for a few organs (thyroid for chest scans; bladder, testes, prostate, ovaries, uterus for abdominopelvic scans). One major resource of such error is patient mismatching. These organs were located in the shoulder and pelvic regions where the tube current changes dramatically within a short distance. A minor organ mismatch between the patient and phantom may result in organ dose estimation with large discrepancy. However, by matching clinical patients to a relatively large phantom library, our technique has significantly improved the traditional patient-generic dose estimation method. Future study should improve the estimation accuracy for these organs with the incorporation of a larger database of patient-specific computational phantoms.
5. Conclusion
In this study, we developed a convolution-based method to model the heterogeneous dose field for TCM exams. This technique was further combined with an atlas-based method to estimate the organ dose for clinical chest and abdominopelvic exams under tube current modulation. The estimated organ dose agrees well with the Monte Carlo simulated TCM dose for both chest and abdominopelvic exams. Organ dose estimation enables improved dose monitoring and recording programs by including the dose information pertaining to specific patient characteristics. Moreover, organ dose estimation may further aid in the optimization and design of individualized protocols in relationship with image quality studies.
Footnotes
References
- Baro J, Sempau J, Fernández-Varea JM, Salvat F. PENELOPE—an algorithm for Monte-Carlo simulation of the penetration and energy-loss of electrons and positrons in matter. Nucl Instrum Methods B. 1995;100:31–46. [Google Scholar]
- Brenner DJ, Hall EJ. Computed tomography—an increasing source of radiation exposure. N Engl J Med. 2007;357:2277–84. doi: 10.1056/NEJMra072149. [DOI] [PubMed] [Google Scholar]
- Costello JE, Cecava ND, Tucker JE, Bau JL. CT radiation dose: current controversies and dose reduction strategies. AJR Am J Roentgenol. 2013;201:1283–90. doi: 10.2214/AJR.12.9720. [DOI] [PubMed] [Google Scholar]
- Dixon RL, Boone JM. Dose equations for tube current modulation in CT scanning and the interpretation of the associated CTDIvol. Med Phys. 2013;40:111920. doi: 10.1118/1.4824918. [DOI] [PubMed] [Google Scholar]
- Geyer AM, O’Reilly S, Lee C, Long DJ, Bolch WE. The UF/NCI family of hybrid computational phantoms representing the current US population of male and female children, adolescents, and adults-application to CT dosimetry. Phys Med Biol. 2014;59:5225–42. doi: 10.1088/0031-9155/59/18/5225. [DOI] [PMC free article] [PubMed] [Google Scholar]
- ICRP. Radiological protection in medicine, ICRP publication 105. Ann ICRP. 2007a:37. doi: 10.1016/j.icrp.2008.08.001. [DOI] [PubMed] [Google Scholar]
- ICRP. The 2007 Recommendations of the International Commission on Radiological Protection. Essen: International Commission on Radiological Protection; 2007b. (ICRP Publication 103) [Google Scholar]
- IEC. Medical Electrical Equipment—Part 2–44: Particular Requirements for the Basic Safety and Essential Performance of X-ray Equipment for Computed Tomography. Geneva: International Electrotechnical Commission; 2009. [Google Scholar]
- Keat N. Report 05016 CT scanner automatic exposure control systems. London, England: ImPACT; 2005. p. 651. ( www.impactscan.org/reports/Report05016.htm) [Google Scholar]
- Li X, Samei E, Segars WP, Sturgeon GM, Colsher JG, Frush DP. Patient-specific radiation dose and cancer risk for pediatric chest CT. Radiology. 2011;259:862–74. doi: 10.1148/radiol.11101900. [DOI] [PMC free article] [PubMed] [Google Scholar]
- Li X, Segars WP, Samei E. The impact on CT dose of the variability in tube current modulation technology: a theoretical investigation. Phys Med Biol. 2014a;59:4525–48. doi: 10.1088/0031-9155/59/16/4525. [DOI] [PMC free article] [PubMed] [Google Scholar]
- Li X, Zhang D, Liu B. Radiation dose calculations for CT scans with tube current modulation using the approach to equilibrium function. Med Phys. 2014b;41:111910. doi: 10.1118/1.4898124. [DOI] [PubMed] [Google Scholar]
- McCollough CH, Chen GH, Kalender W, Leng S, Samei E, Taguchi K, Wang G, Yu L, Pettigrew RI. Achieving routine submillisievert CT scanning: report from the summit on management of radiation dose in CT. Radiology. 2012;264:567–80. doi: 10.1148/radiol.12112265. [DOI] [PMC free article] [PubMed] [Google Scholar]
- Miglioretti DL, et al. The use of computed tomography in pediatrics and the associated radiation exposure and estimated cancer risk. JAMA Pediatr. 2013;167:700–7. doi: 10.1001/jamapediatrics.2013.311. [DOI] [PMC free article] [PubMed] [Google Scholar]
- Sahbaee P, Segars WP, Samei E. Patient-based estimation of organ dose for a population of 58 adult patients across 13 protocol categories. Med Phys. 2014;41:072104. doi: 10.1118/1.4883778. [DOI] [PMC free article] [PubMed] [Google Scholar]
- Samei E, Tian X, Segars WP. Determining organ dose: the holy grail. Pediatr Radiol. 2014;44:460–7. doi: 10.1007/s00247-014-3117-7. [DOI] [PubMed] [Google Scholar]
- Segars WP, Sturgeon G, Mendonca S, Grimes J, Tsui BM. 4D XCAT phantom for multimodality imaging research. Med Phys. 2010;37:4902–15. doi: 10.1118/1.3480985. [DOI] [PMC free article] [PubMed] [Google Scholar]
- Segars WP, et al. Population of anatomically variable 4D XCAT adult phantoms for imaging research and optimization. Med Phys. 2013;40:043701. doi: 10.1118/1.4794178. [DOI] [PMC free article] [PubMed] [Google Scholar]
- Sempau J, Fernández-Varea JM, Acosta E, Salvat F. Experimental benchmarks of the Monte Carlo code PENELOPE. Nucl Instrum Methods B. 2003;207:107–23. [Google Scholar]
- Singh S, Kalra MK, Ali Khawaja RD, Padole A, Pourjabbar S, Lira D, Shepard JA, Digumarthy SR. Radiation dose optimization and thoracic computed tomography. Radiol Clin North Am. 2014;52:1–15. doi: 10.1016/j.rcl.2013.08.004. [DOI] [PubMed] [Google Scholar]
- Tian X, Li X, Segars WP, Paulson EK, Frush DP, Samei E. Pediatric chest and abdominopelvic CT: organ dose estimation based on 42 patient models. Radiology. 2014;270:535–47. doi: 10.1148/radiol.13122617. [DOI] [PMC free article] [PubMed] [Google Scholar]
- Trattner S, et al. Standardization and optimization of CT protocols to achieve low dose. J Am Coll Radiol. 2014;11:271–8. doi: 10.1016/j.jacr.2013.10.016. [DOI] [PMC free article] [PubMed] [Google Scholar]
- Turner AC, et al. The feasibility of patient size-corrected, scanner-independent organ dose estimates for abdominal CT exams. Med Phys. 2011;38:820–9. doi: 10.1118/1.3533897. [DOI] [PMC free article] [PubMed] [Google Scholar]
- Whalen S, Lee C, Williams JL, Bolch WE. Anthropometric approaches and their uncertainties to assigning computational phantoms to individual patients in pediatric dosimetry studies. Phys Med Biol. 2008;53:453–71. doi: 10.1088/0031-9155/53/2/012. [DOI] [PubMed] [Google Scholar]


