

Abstract
Transcript variants play a critical role in diversifying gene expression. Alternative splicing is a major mechanism for generating transcript variants. A number of genes have been implicated in breast cancer pathogenesis with their aberrant expression of alternative transcripts. In this study, we performed genome-wide analyses of transcript variant expression in breast cancer. With RNA-Seq data from 105 patients, we characterized the transcriptome of breast tumors, by pairwise comparison of gene expression in the breast tumor versus matched healthy tissue from each patient. We identified 2839 genes, ~10 % of protein-coding genes in the human genome, that had differential expression of transcript variants between tumors and healthy tissues. The validity of the computational analysis was confirmed by quantitative RT-PCR assessment of transcript variant expression from four top candidate genes. The alternative transcript profiling led to classification of breast cancer into two subgroups and yielded a novel molecular signature that could be prognostic of patients’ tumor burden and survival. We uncovered nine splicing factors (FOX2, MBNL1, QKI, PTBP1, ELAVL1, HNRNPC, KHDRBS1, SFRS2, and TIAR) that were involved in aberrant splicing in breast cancer. Network analyses for the coordinative patterns of transcript variant expression identified twelve “hub” genes that differentiated the cancerous and normal transcriptomes. Dysregulated expression of alternative transcripts may reveal novel biomarkers for tumor development. It may also suggest new therapeutic targets, such as the “hub” genes identified through the network analyses of transcript variant expression, or splicing factors implicated in the formation of the tumor transcriptome.
Keywords: Breast cancer, Transcriptome, Classification, Alternative transcript, Splicing, Network
Introduction
Alternative transcript expression plays an essential role in diversifying genomic impact on biological processes [1]. More than 90 % of human genes are expressed as multiple transcripts through alternative splicing (AS) [2, 3]. Alternative transcript start sites (ATSS) and alternative transcript termination (ATT) also affect the expression of the majority of human genes [4, 5]. In a recent study, silencing or over-expressing splicing factors (SFs) MBNL1 and MBNL2 altered expression of a substantial portion of cassette exons (CEs) and disrupted the control of stem cell reprogramming [6], illustrating the critical role of alternative transcripts in cellular differentiation.
The role of dysregulated AS in cancers has been established for a number of genes, e.g., ERBB2 [7] and BRCA1 [8, 9]. Following the progress in gene expression profiling of tumors, especially for breast cancer [10–12], genome-wide exon arrays were employed to identify aberrant splicing events in cancers [13–17]. Recently, Venables et al. used RT-PCR to screen 600 cancer-associated genes [18] and 2168 alternatively spliced exons (ASEs) [19] in human breast tumors versus normal breast tissues. Those studies provided valuable insights into the critical role of alternative transcripts in cancer pathogenesis. However, microarray-based technologies and PCR are limited by pre-set probes in assays for transcript expression. The recently developed RNA-Seq technology can characterize all transcript variants (also called isoforms) of a gene without the limit of pre-set probes, including transcripts generated through AS, ATSS, and ATT. Thus, it can yield a more comprehensive portrait of transcriptome diversity in cancers, provided that robust computational and bioinformatic solutions are established.
With a large RNA-Seq dataset of paired tumor–normal tissue samples from 105 breast cancer patients, aided with advanced computational methods, we conducted genome-wide analyses of transcript variants. By pairing each breast tumor sample with its internal control, “matched” healthy tissue from the same patient, our study circumvented the well-known problem of large variations in gene expression among human individuals. The pairwise comparison yielded novel insights into the extensive molecular diversity generated by transcript variants, as well as its implications in systems genomics, systems biology, and clinical management of breast cancer.
Materials and methods
Raw RNA-Seq reads of breast cancer and matched normal tissues of 105 patients were obtained from the TCGA database [20]. TCGA sample IDs for the patients and RNA-Seq information are listed in File S1. RNA-Seq reads were mapped to the human reference genome assembly using software TopHat v2.0.4 [21, 22]. Expression levels of a gene and its isoforms in the unit of FPKM (Fragments Per Kilobase of exon per Million fragments mapped) were estimated using the Cufflinks [23]. Gene expression levels in all 210 samples were normalized using the geometric normalization method [24]. An alternative exon (AE) was defined as an exon that was not included in all isoforms of a gene. The expression level of the isoform(s) including an AE was computed and normalized by the total expression level of the gene. This relative expression level is similar to the percentage-spliced-in (ψ, Psi) value used in the quantification of AS [2], and thus it is referred to as ψ of the AE, although the AE can be a result of ATSS, AS, or ATT. The software MISO v0.4.3 [25] was used to test the difference in the ψ value (Δψ) of each AE in tumor versus normal tissues. Quantitative RT-PCR (qRT-PCR) tests of independent samples were used to validate the differential expression of transcript variants between tumors and controls for selected candidate genes. Detailed descriptions of materials and methods are provided in the Online Resource 1.
Results
Differential expression of alternative transcripts in breast cancer transcriptome revealed by RNA-Seq analyses
RNA-Seq reads of breast tumor and matched normal tissues of 105 patients were analyzed using the computational pipeline illustrated in Fig. 1a, to determine differentially expressed AEs in tumors. As an example, mapped RNA-Seq reads of three genes (ISLR, SLK, and ADAMTS12) from a matched pair of tumor–normal samples are shown in Fig. 1b, c, and d, respectively. Comparing tumors versus controls, these genes had virtually identical total transcript levels. However, transcripts of these genes had differential usage of exons in between tumor and normal tissue. Apparently, the aberrant AE expression of these genes in the tumors was due to ATSS (Fig. 1b), AS (Fig. 1c), and ATT (Fig. 1d), respectively. Of note, more than one of these three types of events (ATSS, AS, and ATT) could occur in a gene. In total, 21,429 AEs in 2839 genes were identified to be differentially expressed in breast tumors of at least 20 of the 105 patients (File S2). For a majority of the 2839 genes, 4 or fewer AEs were found with differential expression (Fig. S1). The 2839 genes amount to ~10 % of the protein-coding genes in the genome. The total expression level of most (85 %) of the 2839 genes did not change or differed less than two-fold between tumor and normal tissue. Therefore, they were unlikely to be detected in microarray experiments.
Fig. 1.
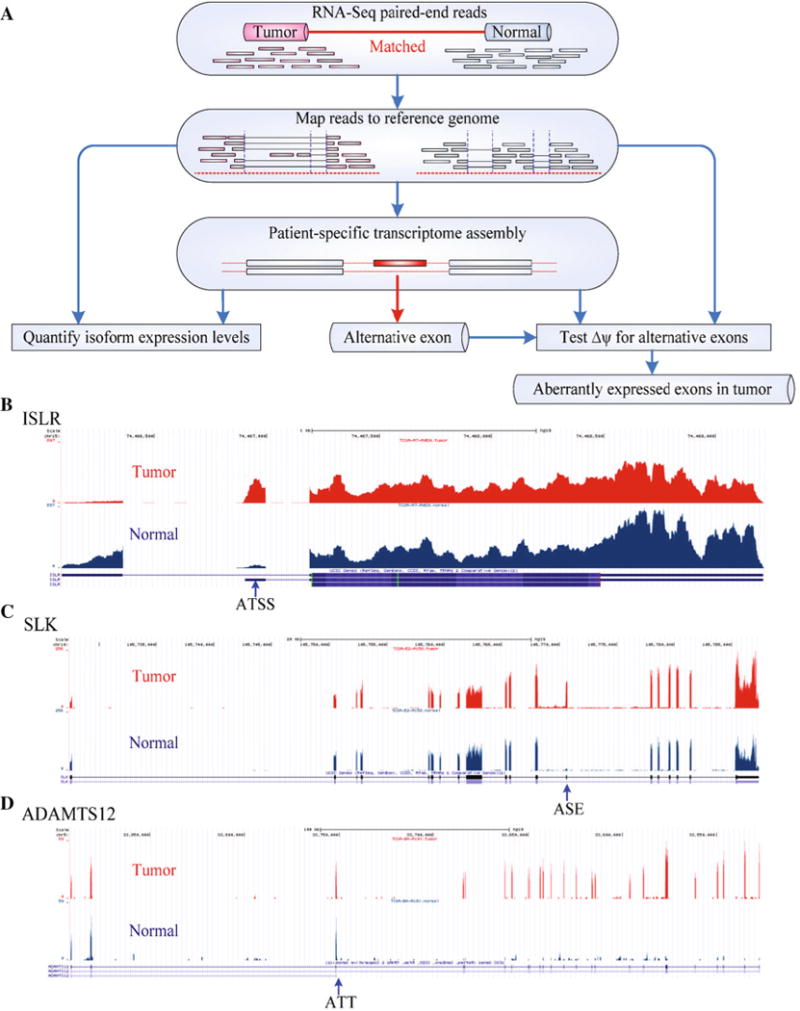
Genome-wide identification of aberrant transcript variant expression in human breast cancer. a Flow chart of mapping RNA-Seq reads to the reference genome and pairwise analyses of transcripts of breast tumor versus normal breast tissue from the same patient; Examples of genes, ISLR, SLK, and ADAMTS12, identified to produce alternative transcripts in breast cancer using alternative transcription start sites (ATSS) (b), alternatively spliced exons (ASE) (c), and alternative transcript termination (ATT) (d). See also Fig. S1 and File S2
qRT-PCR with independent samples to validate the RNA-Seq analysis platform for its capacity to identify differential transcript variant expression
To gauge the accuracy of the RNA-Seq analyses of alternative transcript expression, we selected four genes (ACTN1, CD46, SMARCC2, and LRRFIP1) based on the following criteria: being ranked within the top 20 genes in regard to the proportion of patients that had the altered expression of alternative transcripts in RNA-Seq analyses, being located on different chromosomes, and being understudied in cancer development. ACTN1 is a cytoskeletal protein [26]. CD46 is a regulator of innate immunity [27]. SMARCC2 is a component of the chromatin remodeling complex SNF/SWI [28], and LRRFIP1 is a negative regulator of transcription [29].
We conducted qRT-PCR to validate the expression levels of different isoforms of these four genes, using the matched tumor and normal tissues of six to seven breast cancer patients, a sample set that was different from the samples previously contributed to the published TCGA study wherein the RNA-Seq data were generated [20]. For all four genes, the change of the total expression levels in tumors versus controls was less than two-fold on average, based on RNA-Seq data (Fig. 2a, first panel for all genes). Also shown in Fig. 2a is at least one transcript variant of each gene that changed by more than two-fold in tumors versus controls. As shown in Fig. 2b, qRT-PCR with independent samples detected significant differences between tumor and normal samples for ACTN1 transcript variant 3, SMARCC2 transcript variants 1 and 2, CD46 transcript variant c, and LRRFIP1 transcript variant 2, revealing a differential pattern between tumor and normal samples similar to that identified in the RNA-Seq analyses (Fig. 2a). No significant difference was detected by qRT-PCR for the total expression level of any of the four genes. We did not find significant difference in expression of LRRFIP1 transcript variant 5, which was likely due to the large individual variation that was also apparent in RNA-Seq analyses shown in Fig. 2a, and the small sample size in the qRT-PCR experiments. Therefore, the qRT-PCR experiments (Fig. 2b) validated the differential expression of alternative transcripts between breast tumor and healthy tissue controls for five out of six transcript variants from the four genes, which were originally identified by analyses of the RNA-Seq datasets (Fig. 2a).
Fig. 2.
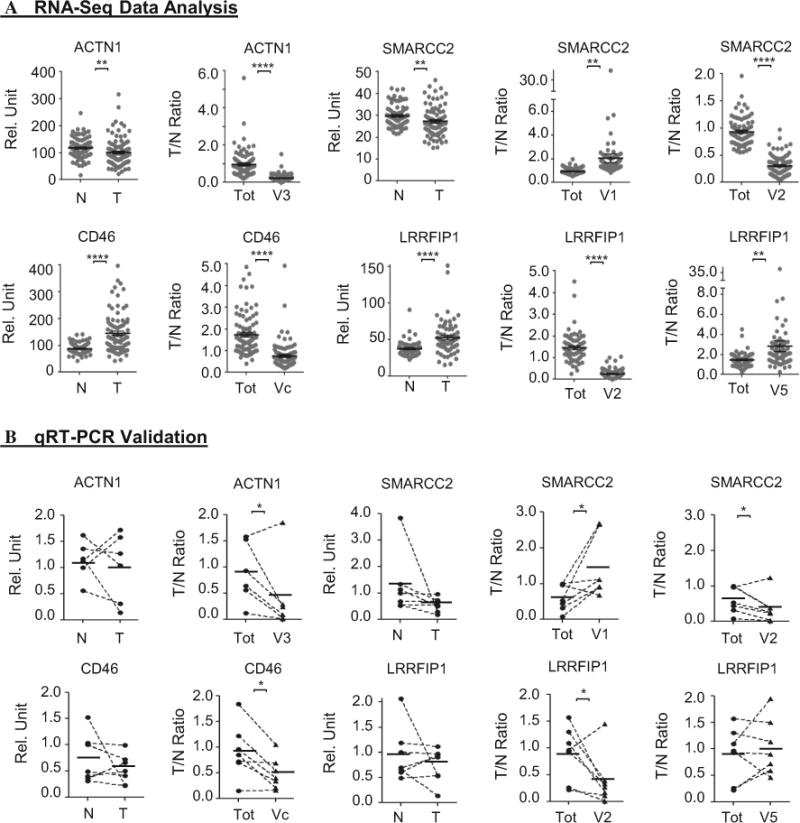
qRT-PCR validating the RNA-Seq analysis platform for alternative transcript expression in tumor versus control. The total and isoform expression levels of four of the top-ranked genes assessed by RNA-Seq analyses (a) or qRT-PCR (b). The RNA-Seq datasets were generated using sample sets different from the samples used in RT-PCR. For each gene, the total expression level is plotted as relative units and indicated in the y axis as Rel. Unit. The remaining graph(s) for that gene presented the ratio of expression levels in tumor (T) versus normal (N) tissue (indicated in the y axis as T/N ratio), for either the total transcript level of that gene (Tot) or a particular transcript variant. The matching lines in the RNA-Seq data were omitted. *p < 0.05, **p < 0.01, ***p < 0.005, ****p < 0.001 (both Wilcoxon signed-rank test and Student’s t test). Of note, although the total expression levels of all four genes from the RNA-Seq data differed less than two-fold on average, the difference was statistically significant because of the far larger sample size than in the RT-PCR validation part. Each data point represents one patient sample
Molecular classification of breast cancer by dysregulated expression of alternative transcripts
We hypothesized that the 2839 genes might project a distinct molecular signature for potential classification of breast cancer. We performed clustering analyses, by applying the non-negative matrix factorization (NMF) method [30] to the Δψ values of the most differentially expressed AE for each of the 2839 genes. As shown in Fig. 3a, there are three different patterns of aberrant expression of AEs: one group of AEs with up-regulated expression in almost all patients, one group of AEs with down-regulated expression in almost all patients, and the third group of AEs with up-regulated expression in about half of the patients and with down-regulated expression in the remaining patients. It is the third group of AEs that classify the patients into two distinct groups. We then employed the method of nearest shrunken centroids [31] to identify a minimum set of genes that could distinguish the two subgroups with the smallest misclassification error rate, which resulted in 25 genes (Fig. 3b). In fact, the misclassification error rate remains identical across a wide region of the degree of shrinkage (Fig. S2). Therefore, we also provide a 100-gene signature (File S3). There is no significant overlap (p value = 0.142) between our two clusters and PAM50-defined 5 intrinsic subtypes [20].
Fig. 3.
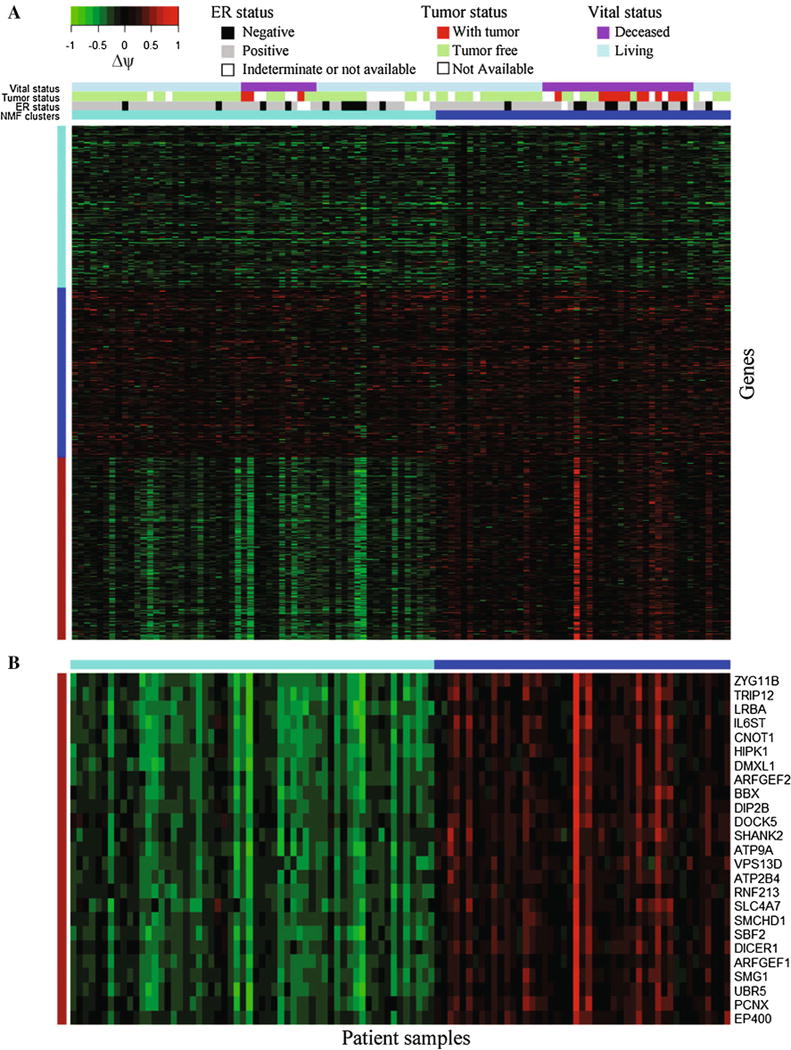
Classification of breast cancer and the 25-gene signature for the two subgroups of cancer. a The NMF method (see the “Methods” section) was applied to the Δψ values of AEs in 2839 genes to obtain two molecular subgroups of breast cancer. b The method of nearest shrunken centroids was further employed to identify a minimum signature of 25 genes that distinguish the two subgroups. See also Fig. S2 and File S3
The minimum set of 25 genes includes genes involved in cellular signaling response to cytokines, insulin and hormones, protein degradation, intracellular vesicular trafficking, ion transport, transcription regulation, and DNA methylation (Table 1). We employed the Fisher’s exact test to determine if there is any association between the available clinical information of the 105 patients and the two molecular subgroups of the cancer. We did not find significant association between the two subgroups and tumor stage, tumor size, lymph node stage, metastasis stage, or histopathological type. There was not any association between the two subgroups and the status of estrogen receptor (ER), progesterone receptor (PR), or HER2. However, there was significant association between the two subgroups and the tumor burden status—whether a patient was with tumor or tumor free (p value = 4.01 × 10⁻³). Among the 15 patients annotated as “with tumor,” 12 (80 %) patients belonged to the second subgroup (Fig. 3a). Significant association between the subgroups and vital status (p value = 1.76 × 10⁻³) was also found. For the 36 patients whose vital status was deceased, 24 (2/3) of them belonged to the second subgroup. These associations, albeit with the limitation of preliminary post hoc analyses, suggest that classification by alternative transcript expression may aid prognosis of cancer recurrence likelihood or patients’ long-term survival rate.
Table 1.
Twenty five genes whose alternative transcript expression profile classified breast cancer into two subgroups
| Gene symbol | Full name | Functional implicationa |
|---|---|---|
| ZYG11B | Zyg-11 family member B, cell cycle regulator | Possibly cell cycle regulation |
| TRIP 12 | Thyroid hormone receptor interactor 12 | Possibly E3 ubiquitin-protein ligase |
| LRBA | LPS-responsive vesicle trafficking, beach and anchor containing | Secretion/membrane-deposition of molecules |
| IL6ST | Interleukin 6 signal transducer (gp130, oncostatin M receptor) | Cytokine signaling |
| CNOT1 | CCR4-NOT transcription complex, subunit 1 | Possibly RNA metabolism and stem cell pluripotency |
| HIPK1 | Homeodomain interacting protein kinase 1 | Phosphorylation of homeodomain transcription factors |
| DMXL1 | Dmx-like 1 | Unknown |
| ARFGEF2 | ADP-ribosylation factor guanine nucleotide exchange factor 2 | Intracellular vesicular trafficking |
| BBX | Bobby sox homolog (Drosophila) | Transcription factor |
| DIP2B | DIP2 disco-interacting protein 2 homolog B (Drosophila) | DNA methylation |
| DOCK5 | dedicator of cytokinesis 5 | Intracellular signaling networks |
| SHANK2 | SH3 and multiple ankyrin repeat domains 2 | Molecular scaffolds in the postsynaptic density |
| ATP9A | ATPase, class II, type 9A | Possibly ion transport |
| VPS13D | Vacuolar protein sorting 13 homolog D (S. cerevisiae) | Trafficking of membrane proteins |
| ATP2B4 | ATPase, Ca++ transporting, plasma membrane 4 | Binding |
| RNF213 | Ring finger protein 213 | Involved in mediating protein–protein interactions |
| SLC4A7 | Solute carrier family 4, sodium bicarbonate cotransporter, member 7 | Regulation of intracellular pH |
| SMCHD1 | Structural maintenance of chromosomes flexible hinge domain containing 1 | Chromosome organization |
| SBF2 | SET binding factor 2 | Rab guanyl-nucleotide exchange factor activity |
| DICER1 | Dicer 1, ribonuclease type III | RNA processing |
| ARFGEF1 | ADP-ribosylation factor guanine nucleotide exchange factor 1 | Intracellular vesicular trafficking |
| SMG1 | smg-1 homolog, phosphatidylinositol 3-kinase-related kinase (C. elegans) | nonsense-mediated mRNA decay |
| UBR5 | Ubiquitin-protein ligase E3 component n-recognin 5 | E3 ubiquitin-protein ligases |
| PCNX | Pecanex homolog (Drosophila) | Unknown |
| EP400 | E1A binding protein p400 | Transcription regulation |
Annotations were based on PubMed gene (http://www.ncbi.nlm.nih.gov/gene) search. See also File S3
Cis-acting sequence motifs and trans-acting splicing factors associated with aberrant splicing variant expression in breast cancer transcriptome
A majority of the 2839 genes had aberrant splicing in breast cancer. We hypothesize that splicing dysregulation contributes substantially to the tumor transcriptomes. Building on our previous studies of cis- and trans-regulation of alternative splicing in healthy genomes [32, 33], we set out to search for the binding sites of the SFs that may regulate splicing in breast cancer. To this end, we first identified 1514 CEs associated with breast cancer. After merging continuous CEs into one segment named as a cassette exon region (CER), we obtained 1106 CERs.
We then performed clustering analyses by applying NMF to the Δψ values of these CERs, which yielded three groups of exons (Fig. 4): the first group had up-regulated expression in almost all patients, the second group had down-regulated expression in almost all patients, and the third group had up-regulated expression in about half of the patients but down-regulated expression in the remaining patients. For each group of exons, we searched for the hexamers that were significantly over-represented in the CERs and adjacent introns. Hexameric motifs have been commonly used to study cis-regulation of RNA splicing and are thought to be subjected to evolutionary selection [34].
Fig. 4.
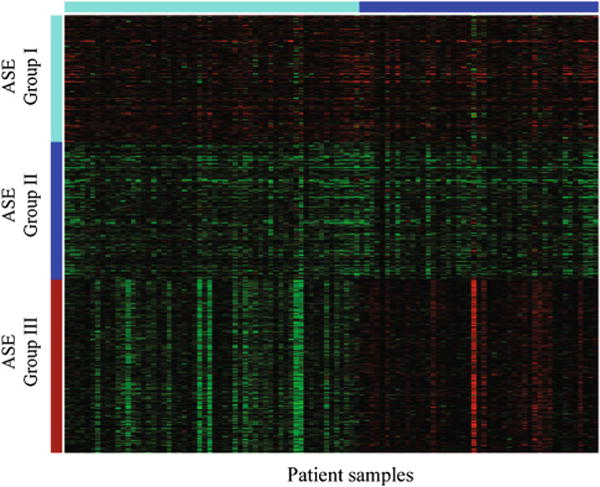
Three groups of cassette exons differentially spliced in breast cancer. Three groups of CEs were obtained by applying the NMF Method (see the “Methods” section) to the Δψ values of 1106 aberrant CERs. Group I (top): average ψ is up-regulated in 98 % of samples; group II (middle): average ψ is down-regulated in 99 % of samples; group III (bottom): average ψ is up-regulated in 39 % of samples and down-regulated in the remaining samples. See also File S4
We compiled a list of 85 SFs that have been experimentally documented for their splicing regulatory function, with a list of binding sites for 37 of these 85 SFs (File S4). Figure 5 shows over-represented hexamers (p value ≤ 0.05/4096, Bonferroni correction) that are known binding sites of SFs. File S4 also presents significantly over-represented hexamers that are not known to be the binding sites of any known SFs. For each SF, we calculated the Pearson correlation coefficient (PCC) between its mRNA expression level and the average ψ of CERs in each group (Fig. 5; File S4). The ψ values correlated significantly with the expression levels of all the SFs listed individually in Fig. 5, strongly suggesting their roles in splicing regulation. Particularly, expression levels of SFs FOX2, MBNL1, QKI, and PTBP1 were found to have significant correlations with the ψ values of at least one of the three differentially spliced CE groups (Fig. 6, Fig S3, Fig S4, Fig S5, and File S4). Of note, the identification of FOX2 in this study is consistent with a previous report of FOX2 involvement in ovarian and breast cancer [19].
Fig. 5.
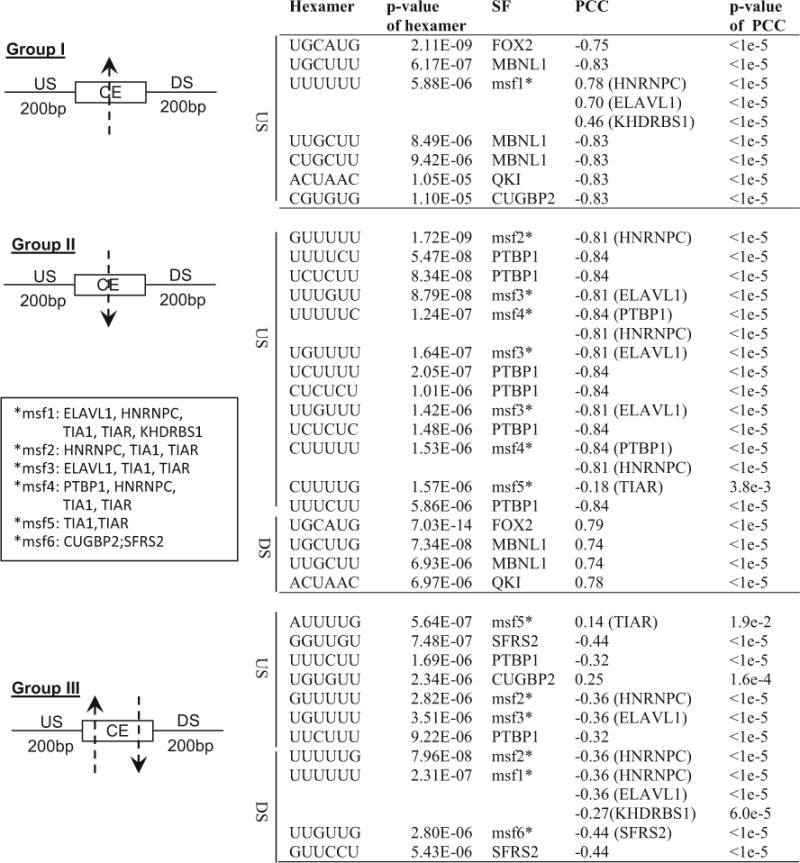
SF binding sites and SFs associated with aberrant expression of CEs in breast cancer. Listed are the hexamers that are (1) over-represented (p value < 0.05/4096) in the 200 bp upstream (US) or downstream (DS) regions of the CERs, and (2) known to be SF binding sites. Pearson’s correlation coefficient (PCC) between expression level of each SF and the average ψ of CEs in a group was calculated. A hexamer can be a binding site of multiple SFs (msf, see insert for list of respective SF in each msf group). For msf groups, the significant PCC of a specific SF is shown with the name of the SF in parentheses after the PCC value. See also File S4
Fig. 6.
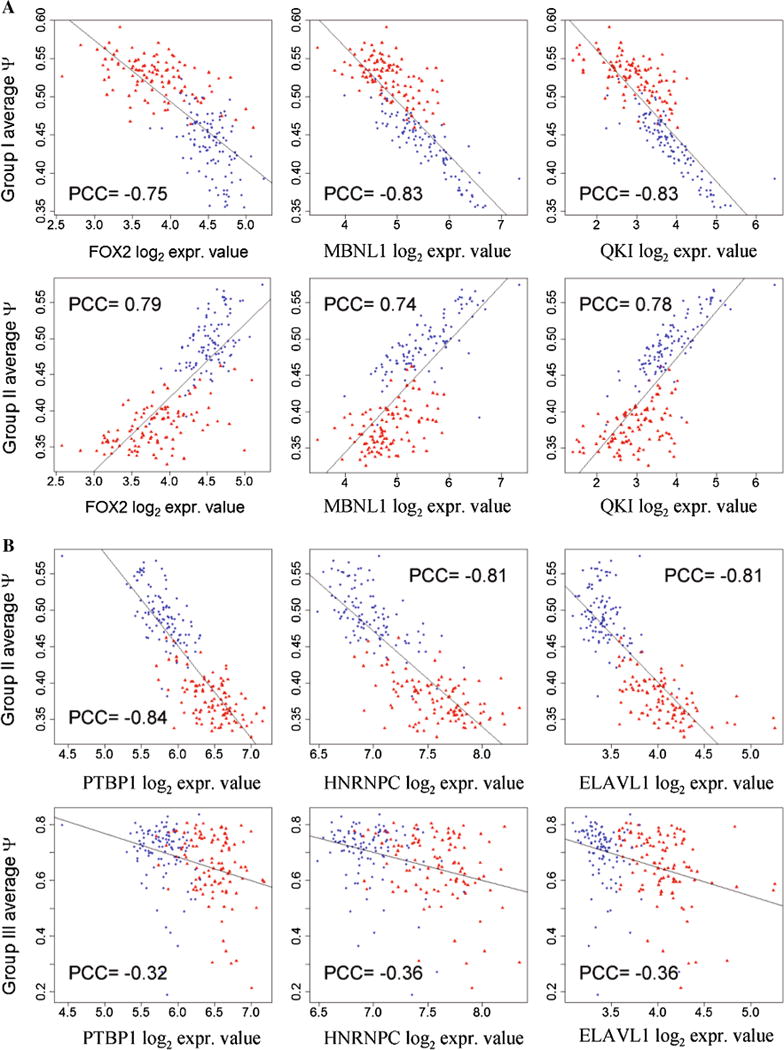
Correlation of exon inclusion or exclusion with expression levels of splicing factors. Scatter plots of log2 expression levels of FOX2, MBNL1, and QKI (a), and PTBP1, HNRNPC, and ELAVL1 (b) versus average ψ values of a group of CEs. Red and blue dots represent the data points from tumors and normal tissues, respectively. See also Fig. S3, Fig S4, and Fig. S5
For a control experiment, we identified 633 CEs whose Δψ is less than 0.05 as a control set, and calculated the PCC between the expression level of each of 81 SFs and the average ψ of these 633 CEs (File S4). None of the SFs presented in Fig. 5 significantly correlated with the average ψ of control CEs, except KHDRBS1 with a marginal significance (p value = 0.024).
Altered coordination of transcript variant expression in breast tumor transcriptome
For most genes, changes in an individual isoform may have only a subtle impact. We reasoned that altered expressions of transcript variants among multiple genes might be co-ordinated and thus may contribute substantially to tumorigenesis. To examine this possibility, we performed a differential network analysis to assess whether the tumor transcriptome harbored an altered coordinative pattern of transcript variant expression. Specifically, for each of 2839 genes, we identified the isoform(s) that had the most differentially expressed AE in cancer. We applied the sparse Gaussian graphical model (GGM) [35] to the expression levels of these isoforms to construct two networks that characterize gene–gene correlation at the transcript level in the cancer and normal transcriptomes, respectively. We then constructed a differential network that reveals the distinct correlation of transcript expression in tumor versus normal transcriptome (Fig. 7, File S5, and File S6).
Fig. 7.
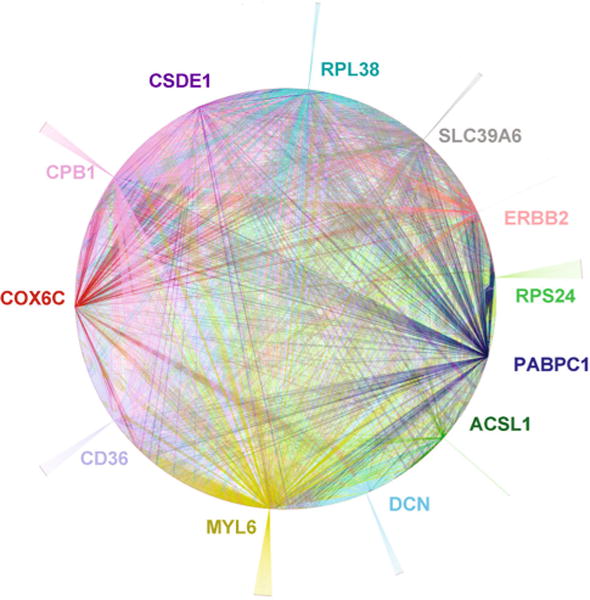
Differential coordination pattern of transcript variant expression in cancerous versus normal breast tissues illustrating twelve “hub” genes identified by network analyses. The networks for transcript variant expression in cancer and normal tissues were constructed separately from the expression levels of the isoforms. A line between two genes, also named “edge,” represents coordinative relationship between two genes for the transcript variant expression. The differential network was then constructed by including edges appearing in either of the two networks, representing the distinct correlations present in either cancer or normal tissues. Labeled in the differential network is the top 12 genes with the largest number of edges. ACSL1 (Acyl-CoA Synthetase Long-chain Family Member 1) has a key role in lipid metabolism; CD36 participates in lipid metabolism, cell adhesion and apoptotic cell clearance; COX6C (Cytochrome C Oxidase Subunit Vlc) is a component of the last enzyme of the mitochondrial respiratory chain; CPB1 is a carboxypeptidase; CSDE1 (Cold Shock Domain Containing E1, RNA Binding) has a role in RNA metabolism; DCN (Decorin) encodes a cell matrix protein; ERBB2 (HER2, a proto-oncogene) encodes a member of EGFR family receptor tyrosine kinase. MYL6 (Myosin, light chain 6) encodes for a cellular motor protein; PABPC1 encodes poly(A) binding protein, cytoplasmic 1; RPL38 encodes ribosomal protein L38 of the 60S subunit: RPS24 encodes ribosomal protein S24 of the 40S subunit. SLC39A6 encodes a zinc transporter. Annotations were based on PubMed gene (http://www.ncbi.nlm.nih.gov/gene) search. See also Fig. S6, File S5, and File S6
The top 12 genes identified in the differential network analysis are considered as the “hubs” of the network (Fig. 7), which had most changes in tumors versus controls, with regard to their correlation with other genes in transcript expression. Interestingly, those twelve genes are over-represented in a few categories: energy metabolism, RNA metabolisms and translation, and cell matrix. ERBB2 is the only proto-oncogene in the list. Aberrant expression of ERBB2 transcript variants has been shown to influence breast cancer development [7]. Of the two major isoforms of ERBB2 expressed in breast tissues, one, but not the other, was up-regulated in tumors in a subset of patients, although the total level was up-regulated in most patients (Fig. S6).
Functional categories of genes with differential expression of isoforms
To obtain an overview of the potential impact by aberrant expression of transcript variants, we examined the GO terms and pathways that were significantly enriched in the 2839 genes. Specifically, we applied the GOrilla algorithm [36] to perform enrichment analyses using the 2839 genes and a set of 11,194 background genes that did not show differential expression of transcript variants. Significantly enriched GO terms are listed in File S7. The top twenty significantly enriched GO terms include apoptosis, cell cycle, and angiogenesis (Table 2). We next employed DAVID [37] to search for enriched pathways. The enriched pathways include the p53 signaling pathway and the ErbB signaling pathway. However, among the most significantly enriched pathways were adherens junction, focal adhesion, and regulation of actin cytoskeleton (Table 3). Therefore, altered expression of alternative transcripts from these genes might facilitate tumor cell invasion and metastasis.
Table 2.
Top twenty significantly enriched GO terms associated with 2839 genes
| GO term | Description | p value |
|---|---|---|
| GO:0019048 | Modulation by virus of host morphology or physiology | 1.49E–15 |
| GO:0043065 | Positive regulation of apoptotic process | 9.24E–12 |
| GO:0006260 | DNA replication | 1.37E–11 |
| GO:0000278 | Mitotic cell cycle | 1.62E–11 |
| GO:0048011 | Neurotrophin TRK receptor signaling pathway | 5.16E–11 |
| GO:0035023 | Regulation of Rho protein signal transduction | 6.10E–09 |
| GO:0016197 | Endosomal transport | 1.08E–08 |
| GO:0000086 | G2/M transition of mitotic cell cycle | 1.45E–08 |
| GO:0000910 | Cytokinesis | 1.47E–08 |
| GO:0051301 | Cell division | 2.05E–08 |
| GO:0007265 | Ras protein signal transduction | 2.06E–08 |
| GO:0001525 | Angiogenesis | 2.47E–08 |
| GO:0034142 | Toll-like receptor 4 signaling pathway | 2.78E–08 |
| GO:0046777 | Protein autophosphorylation | 2.94E–08 |
| GO:0034138 | Toll-like receptor 3 signaling pathway | 4.39E–08 |
| GO:0035666 | TRIF-dependent toll-like receptor signaling pathway | 4.39E–08 |
| GO:0007067 | Mitosis | 7.35E–08 |
| GO:0007173 | Epidermal growth factor receptor signaling pathway | 1.10E–07 |
| GO:0030198 | Extracellular matrix organization | 1.62E–07 |
| GO:0006367 | Transcription initiation from RNA polymerase II promoter | 1.74E–07 |
A general GO term, gene expression, was not shown. See also File S7
Table 3.
Significantly enriched pathways associated with 2839 genes
| KEGG pathway | Description | p value |
|---|---|---|
| hsa04510 | Focal adhesion | 2.68E–10 |
| hsa04520 | Adherens junction | 1.38E–09 |
| hsa04910 | Insulin signaling pathway | 2.69E–06 |
| hsa04810 | Regulation of actin cytoskeleton | 1.34E–05 |
| hsa04115 | p53 signaling pathway | 4.01E–05 |
| hsa04012 | ErbB signaling pathway | 6.41E–05 |
| hsa04360 | Axon guidance | 7.73E–05 |
| hsa04530 | Tight junction | 4.01E–04 |
Pathways generically termed as general or organ-specific cancer were not shown. See also File S7
Furthermore, we categorized the 2839 genes into 75 functional groups using the DAVID algorithm [37] (File S8). The first and largest group, which had 393 genes, was enriched with annotations related to cell membrane function. Interestingly, we observed that a number of known SFs, including 12 serine/arginine-rich (SR) splicing factors and 6 heterogeneous nuclear ribonucleoproteins (hnRNPs), had aberrant expression of transcript variants. They were cataloged in the Group 5 in File S8. There are 103 genes in the Group 5, of which 74 were annotated as RNA binding proteins and 53 were related to RNA splicing in gene ontology. Thirty-two of them overlapped with our manually compiled 85 SFs (File S4), which have been experimentally validated as splicing regulators. The altered expression of the isoforms of these SFs might impinge on splice variant expression for a large set of genes.
Discussion
Human breast tumors harbor extraordinary genomic diversities and exhibit altered expression of many genes [12, 20, 38–42]. In this study, we tackled a major component of transcriptome diversity, alternative transcripts of coding genes. By initiating a comprehensive characterization of dysregulated expression of gene isoforms in natural tumors, this study provides a number of novel insights into the systems biology and regulatory genomics of human cancer development.
We should note that this study used healthy tissue adjacent to the breast tumor from the same patient as a control. For profiling gene expression in a tumor, what would be the best control remains a concern. The distinct tissue heterogeneity in tumor versus normal tissue is well known. Some studies avoided normal tissue controls and examined RNA-Seq data of tumor tissues versus reference RNA-Seq data generated, for example, from a pool of human cell lines. That kind of approach could be complicated by the large variation of gene expression among human individuals. A number of studies used paired normal–tumor samples [16, 18–20]. Pairwise comparison of normal–tumor tissue samples from the same patient enables one to overcome the individual variation. However, tissue heterogeneity remains a limitation. There are different compositions of stromal cells in tumor versus normal tissue, even though tumor stromal cells are an integral part of the tumor, and the stromal and epithelial compartments could be derived from the same cancer stem cell. Such a limitation precludes a conclusion on the relevance of the findings to cell biology; for example, how tumor epithelial cells differ from normal epithelial cells. On the other hand, the findings from studying unfractionated tumor versus normal tissue are relevant to questions such as how the tumor, as a complex and integrated biological entity with all tissue types, differs from healthy tissue, in terms of systems genomics, systems biology, and potential biomarkers.
About 10 % of the protein-coding genes in the genome had differential expression of transcript variants between tumor and normal breast tissue. Analyses of the functional classification of these genes revealed their potential impact on carcinogenesis, although most of these genes are understudied for their potential role in cancer pathogenesis. For example, ACTN1 encodes a protein named alpha-actinin which is an actin-binding protein. Fig. S7 details how the differential expression of ACTN1 isoforms might alter the protein domain function for calcium binding.
Gene expression profiling has been employed for molecular classification of breast cancer and genomic tests for clinical outcome prediction [43, 44]. Although there are a number of prognostic signatures, only the 70-gene MammaPrint signature [43] was approved by the FDA. While the MammaPrint signature has confirmed prognostic potential in patients with HER2-positive breast cancers [45], it has limited clinical utility in ER-negative breast cancers. Overall, the initial optimism on translating breast tumor gene expression signatures to transform breast cancer management has met tremendous challenges. Their difficulties might be due, at least in part, to their inherent design for total transcript levels and inability to detect differences in transcript variants. In this study, we found that AE expression could be used to classify breast cancer into two subgroups. A more integrative approach may advance the field with renewed optimism, although these new fronts are not without their own caveats and hurdles.
The dysregulated AS in cancer may implicate multiple cis-regulatory elements and trans-acting SFs [46]. Our study suggests that dysregulation of SFs likely plays a key role in breast cancer pathogenesis. The exact cause of the dysregulation of the SFs remains unknown, as do their individual and combinatorial impacts on breast cancer development. Nevertheless, the expression profiles of specific SFs, the over-representation of certain SF binding sites, and the distinct profiles of alternative transcripts could be potentially useful biomarkers in breast cancer management.
Overall, the findings from this study suggest several new fronts for both discovery and translational studies of breast cancer, as well as cancer in general, for example, cis- and trans-regulatory elements of gene expression in the cancer genome, dynamic gene expression networks in tumors, and novel genomic tests for cancer prognosis. Although an individual transcript variant may have only a modest effect, an altered transcriptome programming could reshape the development of tumors at a systems level by altering differentiation of multiple cellular types, as demonstrated by the role of MBNL-mediated alternative splicing in stem cell reprogramming [6]. This effect could occur even in the absence of further genetic mutations. As a result, the transcriptome plasticity may enhance intratumoral heterogeneity, which at a systems biology level could confer selective advantage to the tumor under various pressures during natural evolutions of its microenvironment or therapeutic interventions. On the other hand, transcriptome plasticity might present useful biomarkers in clinical management. It could also prove a more druggable target than genetic mutations, accessible through either a “global” strategy targeting AS, selective modulation of “hub” transcripts implicated in the differential network of gene isoform expression, or specific intervention into the biological processes impacted by aberrant transcript variants.
Acknowledgments
We thank the Tissue Bank core facility of the Sylvester Comprehensive Cancer Center at the University of Miami for assistance in obtaining breast tumor samples and paired normal controls. Research reported in this publication was partially supported by NIGMS/NIH R01GM104975 and NSF grant CCF-1319981 (to XC), and the Bankhead Coley Cancer Research Program 09BN-05 and NCI/NIH R21CA178675 (to ZC).
Footnotes
Conflict of interest The authors declare no conflict of interest.
Electronic supplementary material The online version of this article (doi: 10.1007/s10549-015-3395-2) contains supplementary material, which is available to authorized users.
Contributor Information
Zhibin Chen, Email: zchen@med.miami.edu.
Xiaodong Cai, Email: x.cai@miami.edu.
Supplementary Material
References
- 1.Leff SE, Rosenfeld MG, Evans RM. Complex transcriptional units: diversity in gene expression by alternative RNA processing. Annu Rev Biochem. 1986;55:1091–1117. doi: 10.1146/annurev.bi.55.070186.005303. [DOI] [PubMed] [Google Scholar]
- 2.Wang ET, Sandberg R, Luo S, et al. Alternative isoform regulation in human tissue transcriptomes. Nature. 2008;456:470–476. doi: 10.1038/nature07509. [DOI] [PMC free article] [PubMed] [Google Scholar]
- 3.Pan Q, Shai O, Lee LJ, et al. Deep surveying of alternative splicing complexity in the human transcriptome by high-throughput sequencing. Nat Genet. 2008;40:1413–1415. doi: 10.1038/ng.259. [DOI] [PubMed] [Google Scholar]
- 4.Kimura K, Wakamatsu A, Suzuki Y, et al. Diversification of transcriptional modulation: large-scale identification and characterization of putative alternative promoters of human genes. Genome Res. 2006;16:55–65. doi: 10.1101/gr.4039406. [DOI] [PMC free article] [PubMed] [Google Scholar]
- 5.Derti A, Garrett-Engele P, Macisaac KD, et al. A quantitative atlas of polyadenylation in five mammals. Genome Res. 2012;22:1173–1183. doi: 10.1101/gr.132563.111. [DOI] [PMC free article] [PubMed] [Google Scholar]
- 6.Han H, Irimia M, Ross PJ, et al. MBNL proteins repress ES-cell-specific alternative splicing and reprogramming. Nature. 2013;498:241–245. doi: 10.1038/nature12270. [DOI] [PMC free article] [PubMed] [Google Scholar]
- 7.Aigner A, Juhl H, Malerczyk C, et al. Expression of a truncated 100 kDa HER2 splice variant acts as an endogenous inhibitor of tumour cell proliferation. Oncogene. 2001;20:2101–2111. doi: 10.1038/sj.onc.1204305. [DOI] [PubMed] [Google Scholar]
- 8.Claes K, Vandesompele J, Poppe B, et al. Pathological splice mutations outside the invariant AG/GT splice sites of BRCA1 exon 5 increase alternative transcript levels in the 5′ end of the BRCA1 gene. Oncogene. 2002;21:4171–4175. doi: 10.1038/sj.onc.1205520. [DOI] [PubMed] [Google Scholar]
- 9.Ahlborn LB, Dandanell M, Steffensen AY, et al. Splicing analysis of 14 BRCA1 missense variants classifies nine variants as pathogenic. Breast Cancer Res Treat. 2015;150:289–298. doi: 10.1007/s10549-015-3313-7. [DOI] [PMC free article] [PubMed] [Google Scholar]
- 10.Perou CM, Sorlie T, Eisen MB, et al. Molecular portraits of human breast tumours. Nature. 2000;406:747–752. doi: 10.1038/35021093. [DOI] [PubMed] [Google Scholar]
- 11.Parker JS, Mullins M, Cheang MC, et al. Supervised risk predictor of breast cancer based on intrinsic subtypes. J Clin Oncol. 2009;27:1160–1167. doi: 10.1200/JCO.2008.18.1370. [DOI] [PMC free article] [PubMed] [Google Scholar]
- 12.Curtis C, Shah SP, Chin SF, et al. The genomic and transcriptomic architecture of 2000 breast tumours reveals novel subgroups. Nature. 2012;486:346–352. doi: 10.1038/nature10983. [DOI] [PMC free article] [PubMed] [Google Scholar]
- 13.Lapuk A, Marr H, Jakkula L, et al. Exon-level microarray analyses identify alternative splicing programs in breast cancer. Mol Cancer Res. 2010;8:961–974. doi: 10.1158/1541-7786.MCR-09-0528. [DOI] [PMC free article] [PubMed] [Google Scholar]
- 14.Solier S, Barb J, Zeeberg BR, et al. Genome-wide analysis of novel splice variants induced by topoisomerase I poisoning shows preferential occurrence in genes encoding splicing factors. Cancer Res. 2010;70:8055–8065. doi: 10.1158/0008-5472.CAN-10-2491. [DOI] [PMC free article] [PubMed] [Google Scholar]
- 15.Bemmo A, Dias C, Rose AA, et al. Exon-level transcriptome profiling in murine breast cancer reveals splicing changes specific to tumors with different metastatic abilities. PLoS One. 2010;5:e11981. doi: 10.1371/journal.pone.0011981. [DOI] [PMC free article] [PubMed] [Google Scholar]
- 16.Menghi F, Jacques TS, Barenco M, et al. Genome-wide analysis of alternative splicing in medulloblastoma identifies splicing patterns characteristic of normal cerebellar development. Cancer Res. 2011;71:2045–2055. doi: 10.1158/0008-5472.CAN-10-2519. [DOI] [PMC free article] [PubMed] [Google Scholar]
- 17.Andre F, Michiels S, Dessen P, et al. Exonic expression profiling of breast cancer and benign lesions: a retrospective analysis. Lancet Oncol. 2009;10:381–390. doi: 10.1016/S1470-2045(09)70024-5. [DOI] [PubMed] [Google Scholar]
- 18.Venables JP, Klinck R, Bramard A, et al. Identification of alternative splicing markers for breast cancer. Cancer Res. 2008;68:9525–9531. doi: 10.1158/0008-5472.CAN-08-1769. [DOI] [PubMed] [Google Scholar]
- 19.Venables JP, Klinck R, Koh C, et al. Cancer-associated regulation of alternative splicing. Nat Struct Mol Biol. 2009;16:670–676. doi: 10.1038/nsmb.1608. [DOI] [PubMed] [Google Scholar]
- 20.Cancer Genome Atlas N. Comprehensive molecular portraits of human breast tumours. Nature. 2012;490:61–70. doi: 10.1038/nature11412. [DOI] [PMC free article] [PubMed] [Google Scholar]
- 21.Langmead B, Trapnell C, Pop M, et al. Ultrafast and memory-efficient alignment of short DNA sequences to the human genome. Genome Biol. 2009;10:R25. doi: 10.1186/gb-2009-10-3-r25. [DOI] [PMC free article] [PubMed] [Google Scholar]
- 22.Trapnell C, Pachter L, Salzberg SL. TopHat: discovering splice junctions with RNA-Seq. Bioinformatics. 2009;25:1105–1111. doi: 10.1093/bioinformatics/btp120. [DOI] [PMC free article] [PubMed] [Google Scholar]
- 23.Trapnell C, Williams BA, Pertea G, et al. Transcript assembly and quantification by RNA-Seq reveals unannotated transcripts and isoform switching during cell differentiation. Nat Biotechnol. 2010;28:511–515. doi: 10.1038/nbt.1621. [DOI] [PMC free article] [PubMed] [Google Scholar]
- 24.Anders S, Huber W. Differential expression analysis for sequence count data. Genome Biol. 2010;11:R106. doi: 10.1186/gb-2010-11-10-r106. [DOI] [PMC free article] [PubMed] [Google Scholar]
- 25.Katz Y, Wang ET, Airoldi EM, et al. Analysis and design of RNA sequencing experiments for identifying isoform regulation. Nat Methods. 2010;7:1009–1015. doi: 10.1038/nmeth.1528. [DOI] [PMC free article] [PubMed] [Google Scholar]
- 26.Gueguen P, Rouault K, Chen JM, et al. A missense mutation in the alpha-actinin 1 gene (ACTN1) is the cause of autosomal dominant macrothrombocytopenia in a large French family. PLoS One. 2013;8:e74728. doi: 10.1371/journal.pone.0074728. [DOI] [PMC free article] [PubMed] [Google Scholar]
- 27.Cardone J, Le Friec G, Kemper C. CD46 in innate and adaptive immunity: an update. Clin Exp Immunol. 2011;164:301–311. doi: 10.1111/j.1365-2249.2011.04400.x. [DOI] [PMC free article] [PubMed] [Google Scholar]
- 28.Kim SS, Kim MS, Yoo NJ, et al. Frameshift mutations of a chromatin-remodeling gene SMARCC2 in gastric and colorectal cancers with microsatellite instability. APMIS. 2013;121:168–169. doi: 10.1111/j.1600-0463.2012.02953.x. [DOI] [PubMed] [Google Scholar]
- 29.Shen DW, Pouliot LM, Gillet JP, et al. The transcription factor GCF2 is an upstream repressor of the small GTPAse RhoA, regulating membrane protein trafficking, sensitivity to doxorubicin, and resistance to cisplatin. Mol Pharm. 2012;9:1822–1833. doi: 10.1021/mp300153z. [DOI] [PMC free article] [PubMed] [Google Scholar]
- 30.Lee DD, Seung HS. Learning the parts of objects by non-negative matrix factorization. Nature. 1999;401:788–791. doi: 10.1038/44565. [DOI] [PubMed] [Google Scholar]
- 31.Tibshirani R, Hastie T, Narasimhan B, et al. Diagnosis of multiple cancer types by shrunken centroids of gene expression. Proc Natl Acad Sci USA. 2002;99:6567–6572. doi: 10.1073/pnas.082099299. [DOI] [PMC free article] [PubMed] [Google Scholar]
- 32.Wen J, Chiba A, Cai X. Computational identification of tissue-specific alternative splicing elements in mouse genes from RNA-Seq. Nucleic Acids Res. 2010;38:7895–7907. doi: 10.1093/nar/gkq679. [DOI] [PMC free article] [PubMed] [Google Scholar]
- 33.Wen J, Chen Z, Cai X. A biophysical model for identifying splicing regulatory elements and their interactions. PLoS One. 2013;8:e54885. doi: 10.1371/journal.pone.0054885. [DOI] [PMC free article] [PubMed] [Google Scholar]
- 34.Ke S, Zhang XH, Chasin LA. Positive selection acting on splicing motifs reflects compensatory evolution. Genome Res. 2008;18:533–543. doi: 10.1101/gr.070268.107. [DOI] [PMC free article] [PubMed] [Google Scholar]
- 35.Friedman J, Hastie T, Tibshirani R. Sparse inverse covariance estimation with the graphical lasso. Biostatistics. 2008;9:432–441. doi: 10.1093/biostatistics/kxm045. [DOI] [PMC free article] [PubMed] [Google Scholar]
- 36.Eden E, Navon R, Steinfeld I, et al. GOrilla: a tool for discovery and visualization of enriched GO terms in ranked gene lists. BMC Bioinform. 2009;10:48. doi: 10.1186/1471-2105-10-48. [DOI] [PMC free article] [PubMed] [Google Scholar]
- 37.da Huang W, Sherman BT, Lempicki RA. Systematic and integrative analysis of large gene lists using DAVID bioinformatics resources. Nat Protoc. 2009;4:44–57. doi: 10.1038/nprot.2008.211. [DOI] [PubMed] [Google Scholar]
- 38.Stephens PJ, Tarpey PS, Davies H, et al. The landscape of cancer genes and mutational processes in breast cancer. Nature. 2012;486:400–404. doi: 10.1038/nature11017. [DOI] [PMC free article] [PubMed] [Google Scholar]
- 39.Banerji S, Cibulskis K, Rangel-Escareno C, et al. Sequence analysis of mutations and translocations across breast cancer subtypes. Nature. 2012;486:405–409. doi: 10.1038/nature11154. [DOI] [PMC free article] [PubMed] [Google Scholar]
- 40.Shah SP, Roth A, Goya R, et al. The clonal and mutational evolution spectrum of primary triple-negative breast cancers. Nature. 2012;486:395–399. doi: 10.1038/nature10933. [DOI] [PMC free article] [PubMed] [Google Scholar]
- 41.Nik-Zainal S, Alexandrov LB, Wedge DC, et al. Mutational processes molding the genomes of 21 breast cancers. Cell. 2012;149:979–993. doi: 10.1016/j.cell.2012.04.024. [DOI] [PMC free article] [PubMed] [Google Scholar]
- 42.Nik-Zainal S, Van Loo P, Wedge DC, et al. The life history of 21 breast cancers. Cell. 2012;149:994–1007. doi: 10.1016/j.cell.2012.04.023. [DOI] [PMC free article] [PubMed] [Google Scholar]
- 43.van ‘t Veer LJ, Dai H, van de Vijver MJ, et al. Gene expression profiling predicts clinical outcome of breast cancer. Nature. 2002;415:530–536. doi: 10.1038/415530a. [DOI] [PubMed] [Google Scholar]
- 44.van de Vijver MJ, He YD, van’t Veer LJ, et al. A gene-expression signature as a predictor of survival in breast cancer. N Engl J Med. 2002;347:1999–2009. doi: 10.1056/NEJMoa021967. [DOI] [PubMed] [Google Scholar]
- 45.Knauer M, Cardoso F, Wesseling J, et al. Identification of a low-risk subgroup of HER-2-positive breast cancer by the 70-gene prognosis signature. Br J Cancer. 2010;103:1788–1793. doi: 10.1038/sj.bjc.6605916. [DOI] [PMC free article] [PubMed] [Google Scholar]
- 46.Kornblihtt AR, Schor IE, Allo M, et al. Alternative splicing: a pivotal step between eukaryotic transcription and translation. Nat Rev Mol Cell Biol. 2013;14:153–165. doi: 10.1038/nrm3525. [DOI] [PubMed] [Google Scholar]
Associated Data
This section collects any data citations, data availability statements, or supplementary materials included in this article.