

Abstract
While much evidence indicates that reaction time increases as a function of computational load in many cognitive tasks, quantification of changes in neural activity related to increasing demand of cognitive control has rarely been attempted. In this functional magnetic resonance imaging study, we used a majority function task to quantify the effect of computational load on brain activation, reflecting the mental processes instantiated by cognitive control under conditions of uncertainty. We found that the activation of the fronto-parieto-cingulate (FPC) system as well as the deactivation of the anticorrelated default mode network varied parametrically as a function of information entropy, estimated with an information theoretic model. The current findings suggest that activity changes in the dynamic networks of the brain (especially the FPC system) track with information entropy or uncertainty, rather than only conflict or other commonly proposed targets of cognitive control.
Keywords: Cognitive control, computational load, entropy, fMRI, information theory
Introduction
Cognitive control refers to processes that flexibly and adaptively allocate mental resources to permit selection of thoughts and actions according to contextual intentions and goals (Badre, 2008; Kouneiher, Charron, & Koechlin, 2009; Miller, 2000; Posner & Snyder, 1975; Solomon et al., 2009). Although the general neural circuitry underlying the various aspects of cognitive control is not entirely understood (see (Badre, 2008; Chase, Clark, Sahakian, Bullmore, & Robbins, 2008)), a relationship between the activity of the fronto-parieto-cingulate (FPC) system and cognitive control under conditions of uncertainty has been consistently demonstrated in functional magnetic resonance imaging (fMRI) studies (see (Bach & Dolan, 2012)). The FPC system involves the frontal and parietal cortex including the frontal eye field (FEF), supplementary eye field, anterior cingulate cortex (ACC, the anterior rostral cingulate zone as described by (Fan, Hof, Guise, Fossella, & Posner, 2008) extending to the supplementary motor area) and the anterior insula (AI), mid frontal gyrus (MFG), the intraparietal cortex (IPC) near and along the intraparietal sulcus (IPS), and the superior parietal lobule (SPL) (Corbetta & Shulman, 2002; Hopfinger, Buonocore, & Mangun, 2000; Kastner & Ungerleider, 2000; Rossi, Pessoa, Desimone, & Ungerleider, 2009).
Several studies have demonstrated reliable functional activation of the ACC (and the AI) when there is a requirement for conflict processing, accompanied by prolonged reaction time (RT) (Botvinick, Nystrom, Fissell, Carter, & Cohen, 1999; Carter et al., 1998; Carter et al., 2000; Fan, Flombaum, McCandliss, Thomas, & Posner, 2003; Fan, Hof, et al., 2008; Fan et al., 2007; Fan, McCandliss, Fossella, Flombaum, & Posner, 2005; Pardo, Pardo, Janer, & Raichle, 1990; van Veen, Cohen, Botvinick, Stenger, & Carter, 2001) and a meta-analysis (Nee, Wager, & Jonides, 2007). It has been argued that the ACC plays a critical role in conflict detection (Botvinick, Braver, Barch, Carter, & Cohen, 2001; Botvinick et al., 1999; Carter et al., 2000; MacDonald, Cohen, Stenger, & Carter, 2000) and resolution (Posner & DiGiralomo, 1998), and more recently in performance monitoring and resolution (Alexander & Brown, 2011; Walsh, Buonocore, Carter, & Mangun, 2010).
However, activation of the ACC and AI is associated with salience and the oddball effect (Seeley et al., 2007; Sridharan, Levitin, & Menon, 2008), violations of repeating patterns or sequences (Huettel, Mack, & McCarthy, 2002; Ursu, Clark, Aizenstein, Stenger, & Carter, 2009), decision making (Behrens, Woolrich, Walton, & Rushworth, 2007; Critchley, Mathias, & Dolan, 2001; Liu, Hairston, Schrier, & Fan, 2011; Pochon, Riis, Sanfey, Nystrom, & Cohen, 2008; Ullsperger & von Cramon, 2004; Walton, Devlin, & Rushworth, 2004; Zysset et al., 2006), volatility of the reward environment (Behrens et al., 2007), and voluntary risk taking (Rao, Korczykowski, Pluta, Hoang, & Detre, 2008). Furthermore, the ACC is activated more during random sequences than during fixed sequences (Koechlin, Corrado, Pietrini, & Grafman, 2000), and the ACC neurons of macaque monkeys are more active while searching for new sequences than responding to a repeat sequence (Procyk, Tanaka, & Joseph, 2000).
In all of the aforementioned studies of cognitive control, the task conditions involve manipulations of uncertainty (Platt & Huettel, 2008; Rushworth & Behrens, 2008). A large body of work clearly indicates involvement of the FPC system, in which the ACC and AI play pivotal roles, in constraining the amount of information to be processed under uncertainty. However, this system has not been considered explicitly using information theoretical models of the brain (Badre, 2008; Koechlin & Hyafil, 2007; Koechlin, Ody, & Kouneiher, 2003; Koechlin & Summerfield, 2007; Yoshida & Ishii, 2006). Information theory permits a quantitative characterization of uncertainty, which can be conceptualized as information entropy (H) and measured in units of bits (Shannon, 1948). The advantage of such an approach is that unlike the cognitive subtraction approach employed in the majority of contemporary cognitive neuroscience paradigms using cognitive subtraction to compare between two conditions, it enables us to quantify the information uncertainty, and therefore to characterize the relationship between the amount of information to be processed and the magnitude of neural activity. While cognitive subtraction is by no means unfruitful, it often assumes a qualitative, rather than quantitative, difference between different task conditions. In certain contexts, the differences between task conditions may in fact be qualitative or categorical (e.g., contrasting emotional and non-emotional stimuli); however, it may also be that the brain treats these differing stimuli not as a matter of kind but rather extent (see e.g., (Pessoa, 2008)). If the latter is true, then a quantitative characterization of neural activity associated with parametric manipulation of information to be processed is critical to acquire a better understanding of the brain's function (K. J. Friston, 2010).
We propose that the FPC system is involved in cognitive control as a means of facilitating information processing: the system acts to optimize what and how much information is processed under conditions of uncertainty. In this system, the ACC and the AI play a pivotal role in continuously monitoring the match between organismal goals and external/internal state, implementing cognitive control where necessary (Menon & Uddin, 2010). To test this hypothesis, we examined brain activation as a function of computational load indexed by information entropy. In the context of information theory, cognitive control depends on both the input information and the algorithms of mental operations (required to constrain information to a level that the system can accommodate), which in turn, impacts on the overall task performance. Therefore, if a neural region underpins cognitive control, the degree of neural activity in this region should increase as the computational load increases.
Methods
We used a behavioral task in which participants saw a number of left/right arrows and made left and right responses indicating the direction in which the majority of the arrows were pointing. Set size (1, 3, or 5 arrows) and congruency (the ratio of the number of left/right arrows) varied across and within blocks of trials respectively. The information entropy for cognitive control was estimated based on analyses of computational algorithms by manipulating the input uncertainty and observing the RT (Fan, Guise, Liu, & Wang, 2008), and was used as a predictor of brain activation.
Participants
Eighteen adults, right-handed with normal or corrected-to-normal vision, participated in this study. After excluding two participants with excessive head movement (> 2 mm) and one participant with low response accuracy (< 65% for the most difficult condition), the final sample size included in this report was 15 (9 women; mean age 26 years; range 23–31 years). Written informed consent was obtained from each participant following the procedure approved by the Institutional Review Board of the Icahn School of Medicine at Mount Sinai.
Apparatus and procedures
The task was compiled and run on a PC using E-Prime software (Psychology Software Tools, Pittsburgh, PA). The task was first explained to the participants using a paperboard illustrating each condition. Participants then performed a practice session on a PC with 6 blocks of trials, 12 trials in each block, and 72 trials in total, using the same timing parameters as the actual task. Once an understanding of the task was demonstrated, a practice session was performed in an MRI simulator that simulates the sound and vibration associated with scanning sequences. This simulator is equipped with the same button response system as the actual MRI scanner so that participants can become acquainted with the scanning environment prior to the actual experiment. In the scanner, stimuli were projected using a liquid crystal display projector onto a screen mounted at the back of the magnet bore. A mirror mounted on the head coil was adjusted so that these stimuli appeared in the center of the participants' field of view. Responses were collected using a fiber optic button system. Participants indicated the responses by pressing one of two buttons with their right hand.
The majority function task (MFT)
In this task, groups of arrows with set sizes of 1, 3, and 5 were randomly presented at 8 possible locations arranged as an octagon centered on a fixation cross (Figure 1). The arrows pointed either left or right, and were presented simultaneously. The configuration of the 8 positions was similar to that used in previous studies on covert attention (Carrasco & McElree, 2001). On the screen of the projector, the length of the arrow was 5 mm, the radius from the fixation cross to the center of any arrow was 11.5 mm, and the viewing distance was 550 mm. The radius from the fixation cross to the center of an arrow subtended approximately 1.2° of visual angle. Participants' task was to indicate the direction in which the majority of the arrows point. Participants were instructed to make responses as quickly as possible while maintaining a low error rate. For each trial, an arrow set was presented for 2,500 ms. This stimulus display was jittered in a boxcar fashion between a randomly selected pre-stimulus fixation period between 0 and 1,000 ms and a post-stimulus fixation period that was determined by the length of the pre-stimulus fixation period. The post-stimulus fixation period could have ranged between 1500 and 2500 ms. Responses that were made within 2,500 ms of trial onset terminated the display of the stimulus, though the response window was 3,000 ms starting from the onset of the target (an arrow set). If responses were made after this window, they were counted as error trials. The combination of pre-stimulus fixation, stimulus presentation, and post-stimulus fixation resulted in a trial duration of 5,000 ms.
Figure 1.
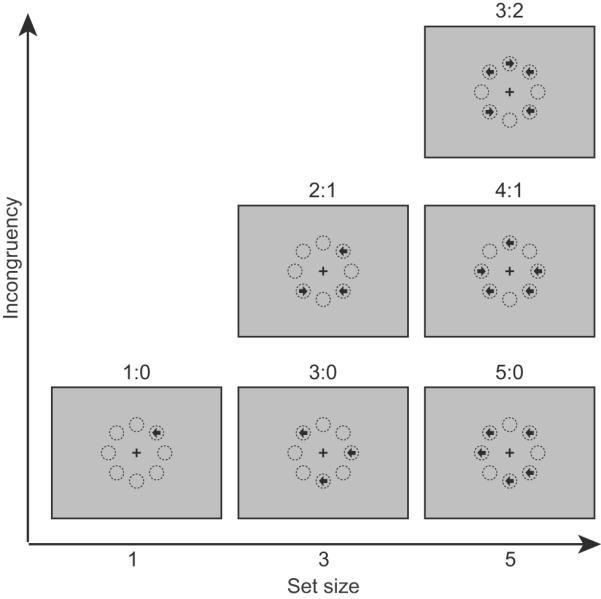
Illustration of representative stimulus configurations of the majority function task.
In this task, arrows with set sizes of 1, 3, or 5 are randomly presented at 8 possible locations arranged in an octagon centered on a fixation cross. The arrows point either left or right, and are presented simultaneously. The participants' task is to indicate the direction in which the majority of arrows point. For example, if three arrows are presented, and two point to the left and one to the right (see the “2:1” panel in the “Set size 3” column), the correct response should be “left”. The eight circles illustrate the locations and are not displayed during the experiment. The label for each of the 6 conditions is the ratio of the numbers in each category.
There were 6 runs in this task. In each run, there were two blocks for each set size, six blocks in total. Each block had 12 trials. The total number of trials in each run was 72. Within a block for a certain set size, arrows under different stimulus conditions were displayed in a random order, with each stimulus condition appearing an equal number of times. The order of the blocks was counterbalanced for each of 3 runs by a Latin square with reversed repetition within each run. The order was 135–531, 351–153, and 513–315 for the first, second, and third run, respectively. Here the number represents the set size. Runs 4, 5, and 6 repeated the first three runs. At the beginning and end of each run there was a 30 s fixation period. There were also five 10-s fixation periods between trial blocks in each run. Each run lasted 470 s. During the experiment, 432 trials in total were presented per participant and the task took about 50 minutes.
Behavioral data analysis
Computational load was operationally defined as information entropy, which was determined based on the amount and content of the input (set size and congruency in the majority function task) and the algorithms of mental operations used to encode and process the input. Examination of changes in RT with respect to computational load allowed us to confirm that the algorithm of mental operations that may be adopted by participants to control information processing to reach a majority decision was the same as what we found in our previous studies (Fan, Guise, et al., 2008; Wang, Liu, & Fan, 2011). Mean RTs and standard deviations (SDs) of each participant were calculated for each condition. Trials with commission or omission error were excluded from the calculation of mean RT. Accuracy for each condition was also analyzed. Then group means of RT, SD, and accuracy were obtained.
Estimation of information entropy
The entropy estimates were based on the algorithm analysis of our previous behavioral study (Fan, Guise, et al., 2008) and computational modeling (Wang et al., 2011), indicating that a grouping algorithm best explains subject strategy on this task, with the assumption that RT is monotonically associated with information entropy. We calculated information entropy based on different searching algorithms. We found that RT was best predicted by a grouping search algorithm involving sampling and resampling of the inputs to find a coherent majority sample, which is more plausible compared to alternative algorithms (i.e., exhaustive or self-terminating search). Participants may adopt a grouping strategy in which they attempt to sample arrows with a majority size (over half of the total set size) based on their directions in order to achieve a high efficiency. For example, for a set size of 3 with inputs a1, a2, a3, this strategy can be expressed using Boolean logic as (a1 XNOR a2) OR (a1 XNOR a3) OR (a2 XNOR a3). Here the exclusive nor (XNOR) returns “true” if input a1 and a2 are identical, and returns “false” if they are different. If the grouping of (a1 XNOR a2) returns true, the search can stop. If not, the next grouping, such as (a1 XNOR a3), will be attempted until “true” is returned. Let us assume that participants adopt such a grouping (sampling) strategy and search for a congruent sample with a majority grouping size. For set size 1, only 1 arrow needs to be scanned. For set size 3, if all 3 arrows point in the same direction, only 1 grouping attempt needs to be made with 2 arrows being scanned; and if only 2 arrows point to the same direction, there will be 1 successful grouping out of every 3 attempts on average. Therefore, 6 arrows, the product of 3 grouping attempts and group size of 2 arrows, need to be scanned. Similarly, for set size 5, for the conditions in which 5, 4, or 3 arrows point to the same direction, 1, 2.5, 10 grouping attempts per successful group on average need to be made and 3, 7.5, and 30 arrows need to be scanned, respectively. If we use the majority group size (1, 2, and 3 for set sizes of 1, 3, and 5, respectively) as the information unit, assuming that each sampled group is equivalent to one unit of information, the information to be processed (i.e., the computational load) is logg (s), where the base g represents the group size and s is the number of arrows to be scanned. To convert this measure to bits (i.e., from base g to base 2), it is multiplied by log2 (g). Therefore, the computational load is log2 (g) • logg (s), which is equivalent to log2 (s). Here we converted the information to be processed in each condition to bits based on the average number of arrows to be sampled. Table 1 lists the estimated entropy for each condition based on this algorithm. Although the amount and content of input to be processed are varied in the majority function task, the response is only one bit because there are only two alternatives. Therefore, the variable related to the stages of response selection and execution, after stimulus preprocessing and categorization (E. E. Smith, 1968), is constant across all set sizes and stimulus conditions.
Table 1.
RT and accuracy under all stimulus conditions (n = 15)
| Set size | Ratio | Entropya | RT (ms) |
Accuracy (%) |
|||
|---|---|---|---|---|---|---|---|
| Mean | SDb | Mean SDc | Mean | SD | |||
| 1 | 1:0 | 0.00d | 575 | 78 | 144 | 99.58 | 0.58 |
| 3 | 3:0 | 1.00 | 647 | 112 | 147 | 99.72 | 0.58 |
| 2:1 | 2.58 | 1,080 | 146 | 334 | 95.83 | 3.02 | |
| 5 | 5:0 | 1.58 | 707 | 130 | 170 | 100.00 | 0.00 |
| 4:1 | 2.91 | 1,112 | 187 | 317 | 98.06 | 2.29 | |
| 3:2 | 4.91 | 1,466 | 335 | 451 | 82.36 | 6.29 | |
Note:
The estimates of entropy for each set size by ratio condition. For entropy estimation, see our previous publication for the analyses of inputs and algorithms (Fan, Guise, et al., 2008).
Standard deviation (SD) represents the standard deviation of the mean reaction times across subjects.
Mean SD represents the average SD across subjects' reaction times. In other words, it represents the group average of the standard variation for each subject's RT.
A 0-bits entropy for the set size 1 condition does not mean that 0 bits of information need to be processed. The decision making step of the majority direction needs 1 bit. We can add 1 bit to all conditions. However, this should not affect the general predictions of relationship among conditions in terms of computational load.
Image acquisition
All MRI acquisitions were obtained on a 3 T Siemens Allegra head-dedicated MRI system. Each scan session lasted about ninety minutes. Foam padding was used to minimize subject head movement. All images were acquired along axial planes parallel to the anterior commissure-posterior commissure (AC-PC) line. A high-resolution T2-weighted anatomical volume of the whole brain was acquired on an axial plane parallel to the AC-PC line with a turbo spin-echo (TSE) pulse sequence with the following parameters: 40 axial slices of 4 mm thick, skip = 0 mm, repetition time (TR) = 4,050 ms, echo time (TE) = 99 ms, flip angle = 170°, field of view (FOV) = 240 mm, matrix size = 448×512, voxel size = 0.47×0.47×4 mm. Six runs of T2*-weighted images for fMRI were acquired. Slices were obtained corresponding to the T2-weighted images. The fMRI imaging was performed using a gradient echo planar imaging (GE-EPI) sequence with the following parameters: 40 axial slices of 4 mm thick, and skip = 0 mm, TR = 2,500 ms, TE = 27 ms, flip angle = 82°, FOV = 240 mm, and matrix size = 64×64. Each run started with 2 dummy volumes before the onset of the task to allow for equilibration of T1 saturation effects, followed by 188 volumes.
Image analysis
Event-related analysis of the fMRI data was conducted using a statistical parametric mapping package (SPM8; Wellcome Trust Centre for Neuroimaging, London, UK). Image preprocessing was performed first: each image volume was realigned to the first volume, slice timing corrected, co-registered to the T2 image, spatially normalized to the Montreal Neurological Institute (MNI) ICBM152 space based on normalization parameters of the T2 image, subsampled to a voxel size of 3×3×3 mm, and finally spatially smoothed with a Gaussian kernel of 6 mm full-width half-maximum. For the statistical analysis, a general linear model (GLM) was conducted for the functional scans from each participant by regressing the observed event-related blood oxygenation level-dependent (BOLD) signals on the regressors to identify the relationship between the hemodynamic responses and task events (Friston et al., 1995). Low-frequency drifts in signal were removed using a high-pass filter with a 128-s cutoff. Serial correlation was estimated using an autoregressive AR(1) model. Global normalization was not applied so that the relationship between deactivation and information entropy should not be attributed to global normalization (Andersson, Ashburner, & Friston, 2001). Without using any a priori assumptions for parametric modulations as the nature of the hemodynamic response corresponding to each task condition was unknown, 6 regressors for the 6 task conditions were created by convolving a train of delta functions representing the sequence of individual events with the default SPM basis function, which consists of a synthetic hemodynamic response function (HRF) composed of two gamma functions (Friston et al., 1998). The 6 parameters generated during motion correction were entered as covariates. In addition, HRF related to error response events for each condition were modeled separately and explicitly to partial out the error related activity. There were minimum 0 and maximum 6 regressors for error response in each run. Second level group analyses were performed using the contrast estimates from the first level GLM.
We defined zero-order (constant) and first-order (linear) contrasts. Higher-order contrasts were not tested due to lack of hypothesis. Further investigation on the nonlinear responses of the brain is needed. The zero-order contrast (1 1 1 1 1 1) corresponds to the constant activation across all 6 task conditions (see Table 1). This is similar to modeling individual events (Rees, Friston, & Koch, 2000). The first-order contrast (based on the estimation of information entropy, but de-meaned to remove the zero-order term and normalized to an arbitrary maximum value, which were −0.553, −0.298, 0.107, −0.149, 0.191, and 0.702) for these 6 task conditions was used to examine the linear relationship between brain activation and information entropy. We then performed a random-effect analysis for this contrast to make an inference. Because a linear relationship between RT and information entropy was found in our previous study (Fan, Guise, et al., 2008), we made the prediction of a linear relationship between the BOLD signal and information entropy. The significance level for the height of each voxel was set at p < 0.001 with a contiguous-voxel extent threshold to produce a corrected threshold of p < 0.01.
Region of interest analysis
We also conducted region of interest (ROI) analysis to examine the involvement of the ROIs in baseline uncertainty processing by extracting the coefficients of regression (β) for each task condition with a sphere of 6-mm radius centered on the voxel of local maxima peak. The ROIs were identified based on the group analysis of the first-order contrast. The parameter estimates of β values of the regression model, representing the percent signal change with respect to the global mean signal, of each subject were extracted from each regressor corresponding to each condition. Then the average parameter estimate for each condition was calculated. The parameter estimates of each ROI (average of left and right ROIs of the same structure if applicable) as a function of information entropy were plotted. Linear regression analyses were conducted for each ROI to examine the x intercepts and slopes of the regression lines for each region. Because the intercept and slope are uncorrelated, this method should not violate the linear regression assumption of independence. Note that linear regression does not test whether the relationship between the brain activation and entropy is linear; it assumes that the data are linear and finds the slope and intercept for the best-fit line of the data. In addition, the time courses of the finite impulse response (FIR, which is equivalent to the method of selective average) for each of the 6 task conditions of each run were extracted from the SPM design of each participant using the MarsBaR toolbox for SPM (http://sourceforge.net/projects/marsbar/), averaged across runs, and then averaged across participants.
Results
RT as a function of information entropy
Mean RT increased as a function of computational load, measured as information entropy (Figure 2 and Table 1). Regression at the group level of RT on information entropy showed that RT = 502 + 197 • H, where H represents entropy in bits (R2 = 0.96, F(1, 4) = 89.88, p < 0.001). Linear mixed-effects model analysis with entropy as the fixed effect and subject as the random effect showed that Akaike's Information Criterion (AIC) (Akaike, 1974) was 1151.18. The intercept was significant (F(1, 21) = 131.36, p < 0.001), and the entropy estimate was a significant predictor of RT (F(1, 74) = 500.30, p < 0.001).
Figure 2.
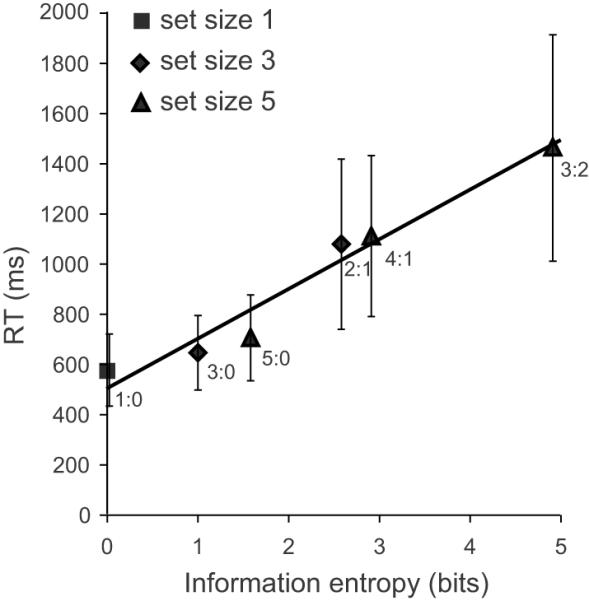
Reaction time (RT) as a function of information entropy in bits.
The entropy was estimated assuming a grouping search algorithm adopted by participants. The R2 of the regression line was 0.96, indicating a good fit. Error bars represent ± 1 mean standard deviations across participants.
Brain activation and deactivation as a function of information entropy
The large-scale involvement of the brain in information processing is illustrated in Figure 3, representing the intrinsic and dynamic organization of the anticorrelated task-positive and task-negative (i.e., default mode) functional networks (Power et al., 2011) as a function of information entropy during the majority function task. While activity was greatest at the putative hubs of these networks, their broad recruitment was observed, indicating parametric modulation of network-level recruitment for processing information (measured as entropy).
Figure 3.

Brain regions showing significant increase or decrease in activity as a function of computational load measured as information entropy.
The red color indicates voxels with positive relationships (t > 3.79), while the blue color indicates voxels with negative relationships (t < −3.79). (A) Increase: anterior cingulate cortex (ACC), anterior insula (AI), frontal eye field (FEF) and the cortex along and nearby the intraparietal sulcus (IPC), thalamus (Th), mid occipital gyrus (MOG), fusiform gyrus (FG), cerebellar vermis (CV, not displayed); and calcarine cortex (Calc, left). (B) Decrease: posterior cingulate cortex (PCC), subgenual anterior cingulate cortex (sgACC, area 25), superior frontal gyrus (SFG), angular gyrus (AG); middle temporal gyrus (MTG), and hippocampus (HIP). The inflated surface maps were rendered at a threshold of height p < 0.001, with t > 3.79, and a threshold of extent p < 0.01 with a cluster size k > 35 of 3×3×3 mm voxels.
Across participants, the BOLD signal varied as a function of information entropy in a remarkably coherent set of neocortical areas including the ACC, AI, and a frontoparietal network including the FEF and the IPC near and along the intraparietal sulcus in the FPC system (Figure 3 and Table 2). The parameter estimates (β values) of the GLM for the regions of interest (ROIs) are shown in Figure 4A. Corresponding to Figure 4A, the hemodynamic responses of these brain regions as a function of the information entropy are also shown in Figure 5A, with an increase in amplitude as a function of computational load.
Table 2.
Brain regions that showed a positive relationship between activation and computational load
| Region | L/R | BA | x | y | z | T | Z | K |
|---|---|---|---|---|---|---|---|---|
| Anterior insula | R | 30 | 23 | −2 | 18.2 | 6.61 | 2647 | |
| Anterior insula | L | −33 | 20 | −2 | 12.4 | 5.81 | ||
| Anterior cingulate cortex | R | 32 | 6 | 29 | 31 | 10.37 | 5.42 | |
| Anterior cingulate cortex | R | 32 | 6 | 14 | 46 | 9.17 | 5.14 | |
| Thalamus | R | 18 | −4 | 10 | 8.61 | 5.00 | ||
| Superior frontal gyrus | L | 6 | −21 | −1 | 52 | 8.44 | 4.95 | |
| Thalamus | L | −12 | −22 | 10 | 7.67 | 4.73 | ||
| Precentral gyrus | R | 44 | 48 | 8 | 34 | 7.36 | 4.63 | |
| Thalamus | R | 15 | −22 | 10 | 6.26 | 4.25 | ||
| Superior frontal gyrus | R | 6 | 21 | 2 | 55 | 6.02 | 4.16 | |
| Precentral gyrus | R | 6 | 36 | −4 | 49 | 5.39 | 3.90 | |
| Precentral gyrus | L | 44 | −48 | 5 | 34 | 4.88 | 3.67 | |
| Anterior cingulate cortex | L | 32 | −9 | 20 | 34 | 4.67 | 3.57 | |
| Superior parietal lobule | L | 7 | −18 | −64 | 46 | 10.21 | 5.39 | 1318 |
| Inferior parietal lobule | L | 40 | −30 | −46 | 46 | 8.99 | 5.10 | |
| Superior occipital gyrus | L | 19 | −24 | −67 | 31 | 8.45 | 4.95 | |
| Fusiform gyrus | L | 19 | −45 | −64 | −8 | 7.27 | 4.61 | |
| Mid occipital gyrus | L | 19 | −33 | −85 | 19 | 7.10 | 4.55 | |
| Inferior temporal gyrus | L | 37 | −42 | −40 | −14 | 7.10 | 4.55 | |
| Calcarine cortex | L | 17 | −18 | −64 | 7 | 5.52 | 3.96 | |
| Supramarginal gyrus | R | 40 | 48 | −31 | 46 | 9.36 | 5.19 | 1698 |
| Inferior temporal gyrus | R | 37 | 51 | −58 | −11 | 9.29 | 5.17 | |
| Inferior parietal lobule | R | 7 | 27 | −55 | 46 | 8.78 | 5.04 | |
| Mid occipital gyrus | R | 19 | 33 | −79 | 25 | 8.48 | 4.96 | |
| Superior parietal lobule | R | 7 | 18 | −70 | 52 | 7.74 | 4.75 | |
| Inferior occipital gyrus | R | 19 | 39 | −82 | −2 | 7.12 | 4.56 | |
| Calcarine cortex | R | 18 | 27 | −70 | 13 | 4.62 | 3.54 | |
| Cerebellum | L | −3 | −73 | −23 | 8.47 | 4.96 | 521 | |
| Vermis | −3 | −58 | −32 | 7.93 | 4.81 | |||
| Cerebellum | L | −27 | −58 | −26 | 6.37 | 4.30 | ||
| Mid frontal gyrus | R | 45 | 48 | 38 | 25 | 7.16 | 4.57 | 116 |
| Mid frontal gyrus | R | 46 | 36 | 50 | 25 | 6.27 | 4.26 |
Note: The threshold was p < 0.001 (T > 3.79) for the height and p < 0.01 (k > 35 of 3×3×3 mm voxels) for the extent. See (Naidich et al., 2004) for localization of subdivisions of insula using MRI. L: left; R: right. BA: Brodmann area. The regions are listed based on the order of peak Z value.
Figure 4.

Positive and negative linear relationship between the activation of the region of interest and computational load measured as information entropy.
(A) Positive. ACC: anterior cingulate cortex (x, y, z = 6, 29, 31); AI: anterior insular cortex (−33, 20, 0 and 30, 23, −2); Th: thalamus (−12, −22, 10 and 15, −22, 10); FEF: frontal eye fields (−21, −1, 52 and 21, 2, 55); IPC: intraparietal cortex, near and along the intraparietal sulcus (−18, −64, 46 and 27, −55, 46); and MOG: mid occipital gyrus (−33, −85, 19 and 33, −79, 25); FG: fusiform gyrus (−45, −64, −8 and 51, −58, −11); CV: cerebellar vermis (−3, −73, −23); and Calc: calcarine cortex (−18, −64, 7). (B) Negative. PCC: posterior cingulate cortex (−9 −52, 22); sgACC: subgenual anterior cingulate cortex (0, 35, −8); SFG: superior frontal gyrus (−21, 38, 46 and 15, 44, 46); AG: angular gyrus (−42, −64, 43 and 54, −61, 37); MTG: mid temporal gyrus (−48, −7, −20 and 57, −10, −17); and HIP: hippocampus (−27, −16, −20 and 24, −10, −20).
Figure 5.

Time courses (finite impulse response for each of the six task conditions) of the activity of the regions of interest (ROIs) as a function of computational load measured as information entropy (H).
(A) Activation. (B) Deactivation. The ROIs (spheres with a 6-mm radius) were extracted at the coordinates indicated in Figure 4.
The linear increase of activation of the task-positive FPC system was accompanied by a linear decrease of activation in the task-negative regions, including the ventromedial prefrontal cortex (vmPFC, including superior frontal gyrus, and pre- and subgenual ACC), the posterior cingulate cortex (PCC) and the retrosplenial cortex, the angular gyrus, and the temporal lobe as a whole (see Figure 3 and Table 3 for the peaks of brain regions showing a negative relationship). ROI analysis on the parameter estimates (β values) of the GLM (Figure 4B) and analysis of the hemodynamic response (Figure 5B) confirmed that the magnitude of deactivation was a linear function of computational load.
Table 3.
Brain regions that showed a negative relationship between activation and computational load
| Region | L/R | BA | x | y | z | T | Z | K |
|---|---|---|---|---|---|---|---|---|
| Superior temporal gyrus | R | 42 | 51 | −28 | 19 | 12.77 | 5.88 | 1595 |
| Hippocampus | R | 34 | 24 | −10 | −20 | 11.2 | 5.59 | |
| Angular gyrus | R | 39 | 54 | −61 | 37 | 10.13 | 5.37 | |
| Mid temporal gyrus | R | 21 | 57 | −10 | −17 | 10.07 | 5.36 | |
| Posterior insula | R | 42 | −16 | −2 | 7.77 | 4.76 | ||
| Mid temporal gyrus | R | 21 | 57 | −37 | −2 | 7.54 | 4.69 | |
| Rolandic operculum | R | 48 | −7 | 19 | 7.48 | 4.67 | ||
| Mid temporal pole | R | 38 | 45 | 17 | −32 | 6.95 | 4.50 | |
| Superior frontal gyrus | L | 9 | −21 | 38 | 46 | 12.01 | 5.74 | 1864 |
| Superior frontal gyrus (medial) | R | 9 | 50 | 7 | 11.40 | 5.63 | ||
| Superior frontal gyrus (medial) | R | 9 | 15 | 44 | 46 | 11.31 | 5.61 | |
| Superior frontal gyrus (medial) | L | 9 | −6 | 53 | 40 | 10.97 | 5.54 | |
| Subgenual anterior cingulate cortex | R | 24 | 0 | 35 | −8 | 10.44 | 5.43 | |
| Superior frontal gyrus (medial) | R | 10 | 9 | 59 | 19 | 9.52 | 5.23 | |
| Mid frontal gyrus | L | 9 | −33 | 23 | 49 | 7.39 | 4.65 | |
| Angular gyrus | L | 39 | −42 | −64 | 43 | 11.13 | 5.58 | 1471 |
| Middle temporal gyrus | L | 21 | −63 | −52 | 7 | 8.33 | 4.92 | |
| Hippocampus | L | 34 | −27 | −16 | −20 | 8.13 | 4.87 | |
| Mid temporal gyrus | L | 21 | −48 | −7 | −20 | 8.10 | 4.86 | |
| Rolandic operculum | L | −42 | −13 | 13 | 6.75 | 4.43 | ||
| Superior temporal gyrus | L | 22 | −57 | −10 | 4 | 6.40 | 4.31 | |
| Posterior cingulate gyrus | L | 23 | −9 | −52 | 22 | 10.89 | 5.53 | 759 |
| Posterior cingulate gyrus | R | 23 | 6 | −49 | 31 | 8.48 | 4.96 | |
| Cuneus | L | 18 | −9 | −91 | 31 | 9.58 | 5.24 | 156 |
| Cuneus | R | 19 | 12 | −85 | 34 | 7.39 | 4.64 | |
| Cerebellum Crus 2 | R | 30 | −79 | −38 | 9.26 | 5.17 | 114 | |
| Inferior temporal gyrus | L | 20 | −48 | 11 | −35 | 7.41 | 4.65 | 46 |
Note: The threshold was p < 0.001 (T > 3.79) for the height and p < 0.01 (k > 35 of 3×3×3 mm voxels) for the extent.
Involvement of brain regions in state uncertainty processing
The deactivation of the ACC and other regions under low entropy conditions (Figures 4A & 5A) may imply that the computational load of particular task conditions (low entropy conditions) are lower than the state uncertainty (i.e., during the fixation period prior to trial onset), resulting in relative deactivation for certain task conditions. While this may seem counterintuitive, activity during state uncertainty likely relates to the engagement of task-positive regions during the anticipation of potential stimulus location (8 possible locations). We estimated the involvement of specific brain regions in state uncertainty processing (i.e., anticipation of impending stimuli locations and directions) by identifying the x-axis equivalent (information entropy in bits) of y = 0 (i.e., the point at which β = 0 for that neural region), using the linear regression of brain activation as a function of information entropy. The x estimate at which β = 0 for the ACC and the AI were the highest of all ROIs (3.3 and 1.7 bits, respectively) (Figure 6A). One-sample t-tests showed that only the ACC and the AI of the task-positive network had a x estimate significantly greater than 0 (t(14) = 2.19, p < 0.05 and t(14) = 6.92, p < 0.001, respectively). Hippocampus and subgenual anterior cingulate cortex (sgACC) of the task-negative network also showed a significant x estimate (t(14) = 2.20, p < 0.05 and t(14) = 2.24, p < 0.05). Deviation contrast in a repeated-measures GLM testing positive x estimate showed that differences between the mean intercept of all positive regions and the ACC (F(1, 14) = 6.36, p < .05), AI (F(1, 14) = 13.80, p < .01), and cerebellar vermis (CV) (F(1, 14) = 12.35, p < .01), were significantly different. While the ACC and AI showed significantly higher state uncertainty than the mean of other task positive ROIs, the CV showed significantly lower state uncertainty than the mean of the other task positive ROIs (see Figure 6A). No negative regions were significantly different from the others.
Figure 6.

The state uncertainty (A) and percent change in BOLD per information (B) estimates in selected brain regions showing positive or negative linear relationship between the activity and the computational load measured as information entropy. Error bars represent ±1 standard error. * indicates a significant difference at p < 0.05 between the ROI and the mean of all other ROIs in the same network (task-positive or task-negative). Solid red line = approximate mean of all ROIs for task-positive network. Solid blue line = approximate mean of all ROIs for task-negative network. The discrepancy of the x intercept between Figure 4 and Figure 6A is due to the fact that the x intercept in Figure 6A shows the mean x intercept across participants whereas the x intercept in Figure 4, which can be inferred, is based on the regression line of the means of the data points across participants.
Magnitude change of brain activation as a function of cognitive load
To examine the average rate of engagement of a particular ROI with increasing entropy, we examined the slope of all ROIs. Deviation contrast in repeated-measures GLM testing positive x estimate showed that differences between the mean slope of all positive regions and the ACC (F(1, 14) = 23.39, p < .001), AI (F(1, 14) = 22.43, p < .001), thalamus (F(1, 14) = 77.33, p < .001), IPC (F(1, 14) = 39.23, p < .001), CV (F(1, 14) = 15.32, p < .01), and CF (F(1, 14) = 6.64, p < .05) were significantly different. While the AI and IPC slope were significantly more positive than the mean for other task-positive ROIs, the ACC, thalamus, CV, and calcarine cortex (Calc) slope were significantly less positive than the mean for other task-positive ROIs (see Figure 6B). Deviation contrast in repeated-measures GLM testing negative x estimate showed that differences between the mean slope of all negative regions and the sgACC (F(1, 14) = 10.61, p < .01), superior frontal gyrus (SFG) (F(1, 14) = 9.18, p < .01), angular gyrus (AG) (F(1, 14) = 17.90, p = .001), mid temporal gyrus (MTG) (F(1, 14) = 106.82, p < .001), and hippocampus (F(1, 14) = 20.06, p = .001) were significantly different. While the slopes for the sgACC and AG were significantly more negative than the mean for all task-negative ROIs, the slopes for the SFG, MTG, and hippocampus were significantly less negative than the mean for all task-negative ROIs (see Figure 6B).
Discussion
Our results indicate that (1) the `mental algorithm' of cognitive control in searching for the majority is implemented by a large set of distributed brain regions in the FPC system; (2) the activation of these task-positive regions and deactivation of the task-negative regions (Fox et al., 2005) operate as a function of information entropy; and (3) compared to other regions, the ACC and AI are more involved in state uncertainty processing (i.e., in the anticipation of and preparation for impending stimuli; see (Bach & Dolan, 2012)). As information entropy increased, placing greater demands on the FPC system, there was differential recruitment of regions typically associated with the task-positive network. In addition to AI, IPC was shown to exhibit a steeper slope than the rest of the ROIs for the task-positive regions. In other words, as task demand increased, AI and IPC were recruited more heavily, while ACC, Th, CV, and Calc were recruited less heavily than the average for the whole task-positive region. Along with differential decreases for task-negative network regions, these findings shed insight into differential contributions of network regions with parametric increase in cognitive load.
The results demonstrate that activity in distributed large-scale neural networks is associated with computational load in information processing. Increases in areas typically associated with cognitive control (i.e., ACC, AI, and areas associated with the task-positive FPC network – especially IPC) suggest that cognitive control constrains which and how much information receives further “attention”. The activation and deactivation patterns found in this study reflect the dynamic organization of the brain for the control of visual information processing and response during task performance. These patterns are consistent with the involvement of the task-positive and task-negative networks (Fox et al., 2005; Power et al., 2011) in the implementation of task set (Dosenbach et al., 2006) and dynamic task control (Dosenbach et al., 2007), as well as the proposed dual-network architecture (Dosenbach, Fair, Cohen, Schlaggar, & Petersen, 2008) of cognitive control. Other regions, not typically associated with task-positive or task-negative functions, such as the occipital gyri, might be modulated by the FPC system for cognitive control (Rossi et al., 2009). Here, we further show that both activation of the FPC system and deactivation of the anti-correlated default-mode networks change as a function of the computational load measured in information entropy.
We suspect that changes in network-level activity directly relate to changes in the BOLD signal as a function of energy requirements for computations associated with information processing. Recent evidence suggests that resting state glutamate in the ACC is predictive of BOLD changes that result from cognitive control demands (Falkenberg, Westerhausen, Specht, & Hugdahl, 2012). An increase in the BOLD signal directly and monotonically reflects an increase in neural activity (Logothetis, Pauls, Augath, Trinath, & Oeltermann, 2001) while decrease in the BOLD signal (deactivation) is associated with reduction of neuronal activity (Enager, Gold, & Lauritzen, 2004; Fox et al., 2005; Gold & Lauritzen, 2002; Lauritzen, 2005; Logothetis, 2008; Offenhauser, Thomsen, Caesar, & Lauritzen, 2005; Raichle & Mintun, 2006; Shmuel et al., 2002). Coupling between BOLD signal and neuronal firing rate, as well as local field potentials, has been demonstrated (Heeger, Huk, Geisler, & Albrecht, 2000; Logothetis et al., 2001; Mukamel et al., 2005; Rees et al., 2000). Increase or decrease in BOLD signal may also reflect a proportional change of the excitatory and inhibitory neuronal activity, and local metabolism, indicating energy consumption related to neuronal synaptic activity (Logothetis, 2007, 2008; Viswanathan & Freeman, 2007). For cognitive processing, neurotransmission and modulation affect large numbers of activated or deactivated cells in the regions involved in the process, possibly inducing larger changes in the BOLD signal than the direct response to sensory signals themselves (Logothetis, 2008). Negative BOLD signals have been associated with reduction in blood flow and decrease in oxygen consumption (Shmuel et al., 2002), and may reflect decreases in neuronal activity (Shmuel, Augath, Oeltermann, & Logothetis, 2006), suppression of neural activity, or a dynamic blood control system (A. T. Smith, Williams, & Singh, 2004).
Because neural activity and energy metabolism are tightly coupled, and hemodynamic signal changes reflect synaptic activity (Logothetis et al., 2001), we propose that as information entropy increases, an increase in BOLD signal represents an increase in the need for neural computation, whereas the anti-correlated decrease in BOLD signal may represent the functional blocking of task-unrelated brain regions (e.g., parts of the temporal lobe in the majority function task) in order to supply enough energy to task-related regions. This hypothesis is consistent with the cross-modality inhibition observed in selective attention tasks; blood flow increases to critical neural regions (e.g., primary visual cortex) and decreases to non-critical regions (e.g., occipital cortex) during, for example, visual tasks (Haxby et al., 1994; Kawashima, O'Sullivan, & Roland, 1995).
Examining changes in neural activity across conditions is typically done in a qualitative rather than quantitative fashion. Most of the research in cognitive neuroscience aims to elucidate process-specific brain activation using cognitive subtraction (Petersen, Fox, Posner, Mintun, & Raichle, 1988; Posner, Petersen, Fox, & Raichle, 1988), comparing one cognitive condition to a qualitatively different one. In cognitive subtraction, differences in neural activity between two (qualitatively different) conditions are attributed to the cognitive process of interest (for reviews, see (D'Esposito, 2000; K. Friston, 2010; Friston et al., 1996)). While considerable knowledge was gained using the cognitive subtraction method, this approach does not necessarily provide information about specific neural differences attributable to quantitative information differences in cognitive states, nor does it inform the common networks and the mechanisms involved in state uncertainty for information transmission and processing. Many contemporary theories of cognitive control have relied on the logic of cognitive subtraction, often equating cognitive control with the prediction, detection, and resolution of conflict (e.g., (Botvinick et al., 2001; Botvinick et al., 1999; Carter et al., 2000; MacDonald et al., 2000), or more general performance monitoring and resolution (Alexander & Brown, 2011; Walsh et al., 2010).
We suggest that congruent and incongruent conditions may represent a difference in amount rather than type of information processing. Early functional neuroimaging studies, aiming to localize mental operations, showed that an increase in activation of the ACC is associated with an increase in number of targets during a semantic decision task (Petersen et al., 1988; Posner et al., 1988), as well as an increase in task difficulty (Paus, Koski, Caramanos, & Westbury, 1998) and behavioral flexibility (Paus, Petrides, Evans, & Meyer, 1993; Procyk et al., 2000). Common activation among cognitive control regions (i.e., the ACC and AI, along with the dorsolateral prefrontal cortex and IPC) have shown a positive correlation between activation and behavioral interference (Wager et al., 2005), as well as RT (Binder, Liebenthal, Possing, Medler, & Ward, 2004). A meta-analysis (Van Snellenberg & Wager, 2009) and lesion-mapping (Gläscher et al., 2012) have also shown common involvement of these regions in a variety of cognitive functions, suggesting a non-specific role that may pertain to differences in information amounts rather than types. In addition, there is dissociation between high-level cognitive control and low-level sensory and perceptual processing. It has been shown that the BOLD signal increases with stimulus contrast in the primary visual cortex (Logothetis et al., 2001) and that coherence of visual motion is related to large activation of the temporoparietal area V5 (Rees et al., 2000). However, less coherence of visual motion, indicating higher uncertainty, is related to increased activation in the ACC and AI (Rees et al., 2000). Altogether, this body of evidence suggests a positive relationship between activity of the ACC/AI and computational load in cognitive control, and thus an (quantitative) entropy reduction function for cognitive control.
The ACC and AI showed deactivation under the low entropy conditions and activation under the high entropy conditions, relative to state uncertainty. A previous fMRI study on inspection time of parallel lines of differing lengths also showed deactivation under easy conditions and activation under hard conditions in these neural regions (Deary et al., 2004). Yet another study showed decreased AI activation when risk prediction was low (Preuschoff, Quartz, & Bossaerts, 2008). Decreased activation in the ACC and AI, in the present study, under low entropy conditions may indicate that the activation is relative to state uncertainty. We speculate that the activation/deactivation of the ACC and AI is related to the dynamic switching between state uncertainty (in the present case, activity related to the anticipation of the impending demands of the task) and target response-related activity.
State uncertainty, for the MFT, is assumed to be 3 bits per arbitrary unit of time because the subject is aware of an impending target, but the spatial location is uncertain (log28 = 3 bits, where 8 represents the number of potential display locations in this study). For the 1:0 condition of set size 1, the response is only to one arrow and the entropy is 0 bits if we do not take the response selection (two options, 1 bit) into account. The target response-related computational load (0 bits) is less than under the state uncertainty condition (3 bits) in this case. Therefore, switching from state uncertainty to task response should evoke a deactivation. However, for a high entropy condition, such as the 3:2 condition of set size 5, the computational load is about 5 bits, greater than the state uncertainty of 3 bits. Therefore, switching to target response from state uncertainty should evoke activation. The estimates of ACC and AI involvement in state uncertainty, for the present study, were approximately 3.3 and 1.7 bits. Other regions in the observed FPC system were not significantly involved in state uncertainty.
In order to facilitate comparison of an information theoretic account to more traditional accounts, other cognitive control tasks are considered below. The conflict effect generated by an interfering dimension (e.g., from the word meaning in a color-word Stroop task (Fan et al., 2003; MacDonald et al., 2000; MacLeod, 1991), or from flankers in a flanker task (Botvinick et al., 1999; Casey et al., 2000; Cohen & Shoup, 1997; Eriksen & Eriksen, 1974; Fan et al., 2003) can be estimated as less than or equal to a 1 bit difference between conflict and no conflict conditions. Let 0 and 1 represent left and right pointing directions, respectively. We can represent a stimulus of 5 arrows, with a center arrow as the target, as 00000 or 11111 (congruent) and 11011 or 00100 (incongruent), respectively, with the underscored center digit as the target. Applying information reduction (Posner, 1964) or perceptual grouping (Treisman, 1982), the above representations can be reduced to 0 or 1 and 10 or 01. If we assume that participants can filter out the irrelevant flanker digit, the estimated computational loads for congruent and incongruent conditions are the same (1 bit). If we assume that participants cannot focus on the center arrow at all, the estimated computational loads for congruent and incongruent conditions are 1 and 2 bits, respectively, with a difference of 1 bit. Because cognitive control can help to suppress the flankers, the average computational load for the incongruent condition should be between 1 and 2 bits.
Our data seem to conform best to an information theoretical perspective rather than a more traditional cognitive control perspective. The parameter estimates for the ACC and AI are of particular interest at their positions between the 5:0 condition of set size 5 and the 2:1 condition of set size 3; this marks the shift to the first condition with stimulus incongruency. By conflict monitoring and processing accounts of cognitive control (especially as it relates to the ACC), one might expect a dramatic increase in activity across these conditions. Instead, what is observed is a near equivalent parameter estimate across these conditions (5:0 and 2:1) for the ACC and AI and a linear increase in relation to the regression with increase in information entropy. Changes in both RT and neural activity seem to show a linear increase that parallels with increase in information entropy. There is no unique or super-additive change when incongruency is introduced.
Accordingly, Stroop and flanker tasks can be viewed as special cases of entropy manipulation with a limited range (< 1 bit). In this study, the range of entropy variation was about 5 bits, which is much greater than in Stroop or flanker tasks. Therefore, the effect sizes in RT and BOLD signal change should be greater than studies using Stroop or flanker tasks. Behaviorally, the RT exhibited a range of approximately 900 ms in the present study, whereas the conflict effect in Stroop or flanker tasks is typically between 50 to 150 ms. Thus, utilizing a task that can parametrically manipulate the amount of information to be processed not only helps to elucidate the specific contributions of different neural regions to particular types of information process, but also provides greater power to detect individual differences.
The functional role of the FPC system, including the FEF and IPC, has also been studied in the context of attention (e.g., (Corbetta, 1998)). Activity in FEF neurons corresponds to the allocation of attention via modulation of ongoing visual processing (Thompson, Biscoe, & Sato, 2005). In a study attempting to separate the effect of entropy and surprise (the former defined by the authors as predictable uncertainty and the latter as unpredictable uncertainty), entropy actually showed a greater impact on RT than surprise per bit of information, though greater activation of the frontal cortex and the cortex along the IPS was shown to be related to greater surprise (Strange, Duggins, Penny, Dolan, & Friston, 2005). Another study found that the network associated with classifying objects into changing categories (a manipulation of uncertainty) was distinct from the frontoparietal attention network (Grinband, Hirsch, & Ferrera, 2006). The aforementioned findings map quite consistently to the dual-network model of cognitive control (Dosenbach et al., 2008), and, along with our results, suggest a particularly important role for the ACC and AI in uncertainty processing/reduction, consistent with information theory.
Our results, together with results of previous studies on cognitive control and decision making, support the hypothesis that the cognitive control of mental operations are subserved by specific brain circuits with an increase in activation as the computational load increases. The pattern of increasing network recruitment is consistent with expansion from core centers of the task-positive network (ACC/AI) as evidenced by network level analyses (Power et al., 2011) and lesion mapping of cognitive control (Gläscher et al., 2012), to provide but two compelling examples. In this context it is worth noting that both ACC and AI contain a class of neurons referred to as von Economo neurons. These very large, vertically oriented spindle-shaped layer V neurons are observed in humans and great apes (Nimchinsky, Vogt, Morrison, & Hof, 1995) (Allman et al., 2010; Nimchinsky et al., 1999), many cetaceans (Butti, Sherwood, Hakeem, Allman, & Hof, 2009; Hof & Van der Gucht, 2007), and elephants (Hakeem et al., 2009), but are most abundant in humans (Allman et al., 2010). Their highly restricted cortical localization suggests an integral role of these neurons in functions including executive control of attention (Botvinick et al., 2001; Fan et al., 2003; Fan et al., 2005; MacDonald et al., 2000), emotional response (Bush, Luu, & Posner, 2000), and both empathy for and experience of pain (Gu et al., 2010; Singer et al., 2004), and represent a possible anatomical substrate for the quick and intuitive assessment of unpredictable, rapidly changing, and complex social situations that is provided by ACC and AI (Allman, Watson, Tetreault, & Hakeem, 2005; Craig, 2009). These results may also support an information theoretic model of the FPC system in which ACC and AI serve as a fast relay and integrative interface with dynamic interconnections between cortical and subcortical structures and play a pivotal role in central control of rapid information processing and response, beyond mere conflict detection and resolution. We have investigated the specification/differentiation of both the ACC and AI in other paradigms (e.g., (Gu et al., 2012; Gu, Liu, Van Dam, Hof, & Fan, 2013; Gu et al., 2010)). However, the current study was not designed to differentiate the function of ACC and AI; however, based on our previous findings, we speculate that although that ACC and AI are coactivated in cognitive tasks, they may be involved in different processes. ACC is related to limbic motor output function and the AI is considered a limbic sensory region. While they may both process anticipation errors, ACC would seem to be involved in the implementation of cognitive control, whereas AI receives signals from the autonomic nervous system and integrate them with top-down prediction from higher-level regions (e.g., frontal regions including the ACC) (see (X. Gu, Hof, Friston, & Fan, 2013) for a review). Nevertheless, the present study highlights a new perspective of quantifying the activity of the brain under conditions of varying uncertainty and sheds new light on understanding cognitive control and its neural underpinnings.
Highlights.
Control of information processing is implemented by a fronto-parieto-cingulate system
Activation of this system varies as a function of information entropy
Anterior cingulate and anterior insular cortices signal state uncertainty
Acknowledgements
We thank Dr. Michael I. Posner for valuable comments on the study design and the manuscript, Dr. Thomas P. Naidich for insightful comments on neuroanatomical constraints and implications, Pengfei Xu for assistance with the figures, and Yunsoo Park and Kevin Guise for assistance with data collection. Research reported in this publication was supported by the National Institute of Mental Health (NIMH) of the National Institutes of Health (NIH) under Award Number R01 MH094305 and by NIH grant M01 RR000071 from the National Center for Research Resources (NCRR). The content is solely the responsibility of the authors and does not necessarily represent the official views of the NIH or NCRR. This work was also supported in part by a James S. McDonnell Foundation award to PRH. The funders had no role in study design, data collection and analysis, decision to publish, or preparation of the manuscript.
References
- Akaike H. A new look at the statistical model identification. IEEE Transactions on Automatic Control. 1974;19(6):716–723. [Google Scholar]
- Alexander WH, Brown JW. Medial prefrontal cortex as an action-outcome predictor. Nature Neuroscience. 2011;14(10):1338–1344. doi: 10.1038/nn.2921. [DOI] [PMC free article] [PubMed] [Google Scholar]
- Allman JM, Tetreault NA, Hakeem AY, Manaye KF, Semendeferi K, Erwin JM, et al. The von Economo neurons in frontoinsular and anterior cingulate cortex in great apes and humans. Brain Struct Funct. 2010;214(5–6):495–517. doi: 10.1007/s00429-010-0254-0. [DOI] [PubMed] [Google Scholar]
- Allman JM, Watson KK, Tetreault NA, Hakeem AY. Intuition and autism: a possible role for Von Economo neurons. Trends Cogn Sci. 2005;9(8):367–373. doi: 10.1016/j.tics.2005.06.008. [DOI] [PubMed] [Google Scholar]
- Andersson JL, Ashburner J, Friston K. A global estimator unbiased by local changes. Neuroimage. 2001;13(6 Pt 1):1193–1206. doi: 10.1006/nimg.2001.0763. [DOI] [PubMed] [Google Scholar]
- Bach DR, Dolan RJ. Knowing how much you don't know: a neural organization of uncertainty estimates. Nat Rev Neurosci. 2012;13(8):572–586. doi: 10.1038/nrn3289. [DOI] [PubMed] [Google Scholar]
- Badre D. Cognitive control, hierarchy, and the rostro-caudal organization of the frontal lobes. Trends Cogn Sci. 2008;12(5):193–200. doi: 10.1016/j.tics.2008.02.004. [DOI] [PubMed] [Google Scholar]
- Behrens TE, Woolrich MW, Walton ME, Rushworth MF. Learning the value of information in an uncertain world. Nat Neurosci. 2007;10(9):1214–1221. doi: 10.1038/nn1954. [DOI] [PubMed] [Google Scholar]
- Binder JR, Liebenthal E, Possing ET, Medler DA, Ward BD. Neural correlates of sensory and decision processes in auditory object identification. Nat Neurosci. 2004;7(3):295–301. doi: 10.1038/nn1198. [DOI] [PubMed] [Google Scholar]
- Botvinick MM, Braver TS, Barch DM, Carter CS, Cohen JD. Conflict monitoring and cognitive control. Psychological Review. 2001;108(3):624–652. doi: 10.1037/0033-295x.108.3.624. [DOI] [PubMed] [Google Scholar]
- Botvinick MM, Nystrom LE, Fissell K, Carter CS, Cohen JD. Conflict monitoring versus selection-for-action in anterior cingulate cortex. Nature. 1999;402(6758):179–181. doi: 10.1038/46035. [DOI] [PubMed] [Google Scholar]
- Bush G, Luu P, Posner MI. Cognitive and emotional influences in anterior cingulate cortex. Trends Cogn Sci. 2000;4(6):215–222. doi: 10.1016/s1364-6613(00)01483-2. [DOI] [PubMed] [Google Scholar]
- Butti C, Sherwood CC, Hakeem AY, Allman JM, Hof PR. Total number and volume of Von Economo neurons in the cerebral cortex of cetaceans. J Comp Neurol. 2009;515(2):243–259. doi: 10.1002/cne.22055. [DOI] [PubMed] [Google Scholar]
- Carrasco M, McElree B. Covert attention accelerates the rate of visual information processing. Proc Natl Acad Sci U S A. 2001;98(9):5363–5367. doi: 10.1073/pnas.081074098. [DOI] [PMC free article] [PubMed] [Google Scholar]
- Carter CS, Braver TS, Barch DM, Botvinick MM, Noll D, Cohen JD. Anterior cingulate cortex, error detection, and the online monitoring of performance. Science. 1998;280(5364):747–749. doi: 10.1126/science.280.5364.747. [DOI] [PubMed] [Google Scholar]
- Carter CS, Macdonald AM, Botvinick M, Ross LL, Stenger VA, Noll D, et al. Parsing executive processes: strategic vs. evaluative functions of the anterior cingulate cortex. Proc Natl Acad Sci U S A. 2000;97(4):1944–1948. doi: 10.1073/pnas.97.4.1944. [DOI] [PMC free article] [PubMed] [Google Scholar]
- Casey BJ, Thomas KM, Welsh TF, Badgaiyan RD, Eccard CH, Jennings JR, et al. Dissociation of response conflict, attentional selection, and expectancy with functional magnetic resonance imaging. Proc Natl Acad Sci U S A. 2000;97(15):8728–8733. doi: 10.1073/pnas.97.15.8728. [DOI] [PMC free article] [PubMed] [Google Scholar]
- Chase HW, Clark L, Sahakian BJ, Bullmore ET, Robbins TW. Dissociable roles of prefrontal subregions in self-ordered working memory performance. Neuropsychologia. 2008;46(11):2650–2661. doi: 10.1016/j.neuropsychologia.2008.04.021. [DOI] [PubMed] [Google Scholar]
- Cohen A, Shoup R. Perceptual dimensional constraints in response selection processes. Cognit Psychol. 1997;32(2):128–181. doi: 10.1006/cogp.1997.0648. [DOI] [PubMed] [Google Scholar]
- Corbetta M. Frontoparietal cortical networks for directing attention and the eye to visual locations: identical, independent, or overlapping neural systems? Proceedings of the National Academy of Science. 1998;95(3):831–838. doi: 10.1073/pnas.95.3.831. [DOI] [PMC free article] [PubMed] [Google Scholar]
- Corbetta M, Shulman GL. Control of goal-directed and stimulus-driven attention in the brain. Nat Rev Neurosci. 2002;3(3):201–215. doi: 10.1038/nrn755. [DOI] [PubMed] [Google Scholar]
- Craig AD. How do you feel - now? The anterior insula and human awareness. Nat Rev Neurosci. 2009;10(1):59–70. doi: 10.1038/nrn2555. [DOI] [PubMed] [Google Scholar]
- Critchley HD, Mathias CJ, Dolan RJ. Neural activity in the human brain relating to uncertainty and arousal during anticipation. Neuron. 2001;29(2):537–545. doi: 10.1016/s0896-6273(01)00225-2. [DOI] [PubMed] [Google Scholar]
- D'Esposito M. Functional neuroimaging of cognition. Semin Neurol. 2000;20(4):487–498. doi: 10.1055/s-2000-13182. [DOI] [PubMed] [Google Scholar]
- Deary IJ, Simonotto E, Meyer M, Marshall A, Marshall I, Goddard N, et al. The functional anatomy of inspection time: an event-related fMRI study. Neuroimage. 2004;22(4):1466–1479. doi: 10.1016/j.neuroimage.2004.03.047. [DOI] [PubMed] [Google Scholar]
- Dosenbach NU, Fair DA, Cohen AL, Schlaggar BL, Petersen SE. A dual-networks architecture of top-down control. Trends Cogn Sci. 2008;12(3):99–105. doi: 10.1016/j.tics.2008.01.001. [DOI] [PMC free article] [PubMed] [Google Scholar]
- Dosenbach NU, Fair DA, Miezin FM, Cohen AL, Wenger KK, Dosenbach RA, et al. Distinct brain networks for adaptive and stable task control in humans. Proc Natl Acad Sci U S A. 2007;104(26):11073–11078. doi: 10.1073/pnas.0704320104. [DOI] [PMC free article] [PubMed] [Google Scholar]
- Dosenbach NU, Visscher KM, Palmer ED, Miezin FM, Wenger KK, Kang HC, et al. A core system for the implementation of task sets. Neuron. 2006;50(5):799–812. doi: 10.1016/j.neuron.2006.04.031. [DOI] [PMC free article] [PubMed] [Google Scholar]
- Enager P, Gold L, Lauritzen M. Impaired neurovascular coupling by transhemispheric diaschisis in rat cerebral cortex. J Cereb Blood Flow Metab. 2004;24(7):713–719. doi: 10.1097/01.WCB.0000121233.63924.41. [DOI] [PubMed] [Google Scholar]
- Eriksen BA, Eriksen CW. Effects of noise letters upon the identification of a target letter in a nonsearch task. Perception and Psychophysics. 1974;16(1):143–149. [Google Scholar]
- Falkenberg LE, Westerhausen R, Specht K, Hugdahl K. Resting-state glutamate level in the anterior cingulate predicts blood-oxygen level-dependent response to cognitive control. Proceedings of the National Academy of Sciences. 2012;109(13):5069–5073. doi: 10.1073/pnas.1115628109. [DOI] [PMC free article] [PubMed] [Google Scholar]
- Fan J, Flombaum JI, McCandliss BD, Thomas KM, Posner MI. Cognitive and brain consequences of conflict. Neuroimage. 2003;18(1):42–57. doi: 10.1006/nimg.2002.1319. [DOI] [PubMed] [Google Scholar]
- Fan J, Guise KG, Liu X, Wang H. Searching for the majority: algorithms of voluntary control. PLoS ONE. 2008;3(10):e3522. doi: 10.1371/journal.pone.0003522. [DOI] [PMC free article] [PubMed] [Google Scholar]
- Fan J, Hof PR, Guise KG, Fossella JA, Posner MI. The functional integration of the anterior cingulate cortex during conflict processing. Cereb Cortex. 2008;18(4):796–805. doi: 10.1093/cercor/bhm125. [DOI] [PubMed] [Google Scholar]
- Fan J, Kolster R, Ghajar J, Suh M, Knight RT, Sarkar R, et al. Response anticipation and response conflict: an event-related potential and functional magnetic resonance imaging study. J Neurosci. 2007;27(9):2272–2282. doi: 10.1523/JNEUROSCI.3470-06.2007. [DOI] [PMC free article] [PubMed] [Google Scholar]
- Fan J, McCandliss BD, Fossella J, Flombaum JI, Posner MI. The activation of attentional networks. Neuroimage. 2005;26(2):471–479. doi: 10.1016/j.neuroimage.2005.02.004. [DOI] [PubMed] [Google Scholar]
- Fox MD, Snyder AZ, Vincent JL, Corbetta M, Van Essen DC, Raichle ME. The human brain is intrinsically organized into dynamic, anticorrelated functional networks. Proc Natl Acad Sci U S A. 2005;102(27):9673–9678. doi: 10.1073/pnas.0504136102. [DOI] [PMC free article] [PubMed] [Google Scholar]
- Friston K. The free-energy principle: a unified brain theory? Nat Rev Neurosci. 2010;11(2):127–138. doi: 10.1038/nrn2787. [DOI] [PubMed] [Google Scholar]
- Friston KJ. The free-energy principle: a unified brain theory? Nat Rev Neurosci. 2010;11(2):127–138. doi: 10.1038/nrn2787. [DOI] [PubMed] [Google Scholar]
- Friston KJ, Fletcher P, Josephs O, Holmes A, Rugg MD, Turner R. Event-related fMRI: characterizing differential responses. Neuroimage. 1998;7(1):30–40. doi: 10.1006/nimg.1997.0306. [DOI] [PubMed] [Google Scholar]
- Friston KJ, Holmes AP, Worsley KJ, Poline J-P, Frith CD, Frackowiak RSJ. Statistical parametric maps in functional imaging: A general linear approach. Human Brain Mapping. 1995;2(4):189–210. [Google Scholar]
- Friston KJ, Price CJ, Fletcher P, Moore C, Frackowiak RS, Dolan RJ. The trouble with cognitive subtraction. Neuroimage. 1996;4(2):97–104. doi: 10.1006/nimg.1996.0033. [DOI] [PubMed] [Google Scholar]
- Gläscher J, Adolphs R, Damasio H, Bechara A, Rudrauf D, Calamia M, et al. Lesion mapping of cognitive control and value-based decision making in the prefrontal cortex. Proceedings of the National Academy of Sciences. 2012;109(36):14681–14686. doi: 10.1073/pnas.1206608109. [DOI] [PMC free article] [PubMed] [Google Scholar]
- Gold L, Lauritzen M. Neuronal deactivation explains decreased cerebellar blood flow in response to focal cerebral ischemia or suppressed neocortical function. Proc Natl Acad Sci U S A. 2002;99(11):7699–7704. doi: 10.1073/pnas.112012499. [DOI] [PMC free article] [PubMed] [Google Scholar]
- Grinband J, Hirsch J, Ferrera VP. A neural representation of categorization uncertainty in the human brain. Neuron. 2006;49(5):757–763. doi: 10.1016/j.neuron.2006.01.032. [DOI] [PubMed] [Google Scholar]
- Gu X, Gao Z, Wang X, Liu X, Knight RT, Hof PR, et al. Anterior insular cortex is necessary for empathetic pain perception. Brain : a journal of neurology. 2012;135(Pt 9):2726–2735. doi: 10.1093/brain/aws199. [DOI] [PMC free article] [PubMed] [Google Scholar]
- Gu X, Hof PR, Friston KJ, Fan J. Anterior insular cortex and emotional awareness. The Journal of comparative neurology. 2013 doi: 10.1002/cne.23368. [DOI] [PMC free article] [PubMed] [Google Scholar]
- Gu X, Liu X, Guise KG, Naidich TP, Hof PR, Fan J. Functional Dissociation of the Frontoinsular and Anterior Cingulate Cortices in Empathy for Pain. Journal of Neuroscience. 2010;30(10):3739–3744. doi: 10.1523/JNEUROSCI.4844-09.2010. [DOI] [PMC free article] [PubMed] [Google Scholar]
- Gu X, Liu X, Van Dam NT, Hof PR, Fan J. Cognition-Emotion Integration in the Anterior Insular Cortex. Cerebral cortex. 2013;23(1):20–27. doi: 10.1093/cercor/bhr367. [DOI] [PMC free article] [PubMed] [Google Scholar]
- Hakeem AY, Sherwood CC, Bonar CJ, Butti C, Hof PR, Allman JM. Von Economo neurons in the elephant brain. Anat Rec (Hoboken) 2009;292(2):242–248. doi: 10.1002/ar.20829. [DOI] [PubMed] [Google Scholar]
- Haxby JV, Horwitz B, Ungerleider LG, Maisog JM, Pietrini P, Grady CL. The functional organization of human extrastriate cortex: a PET-rCBF study of selective attention to faces and locations. J Neurosci. 1994;14(11 Pt 1):6336–6353. doi: 10.1523/JNEUROSCI.14-11-06336.1994. [DOI] [PMC free article] [PubMed] [Google Scholar]
- Heeger DJ, Huk AC, Geisler WS, Albrecht DG. Spikes versus BOLD: what does neuroimaging tell us about neuronal activity? Nat Neurosci. 2000;3(7):631–633. doi: 10.1038/76572. [DOI] [PubMed] [Google Scholar]
- Hof PR, Van der Gucht E. Structure of the cerebral cortex of the humpback whale, Megaptera novaeangliae (Cetacea, Mysticeti, Balaenopteridae) Anat Rec A Discov Mol Cell Evol Biol. 2007;290:1–31. doi: 10.1002/ar.20407. [DOI] [PubMed] [Google Scholar]
- Hopfinger JB, Buonocore MH, Mangun GR. The neural mechanisms of top-down attentional control. Nat Neurosci. 2000;3(3):284–291. doi: 10.1038/72999. [DOI] [PubMed] [Google Scholar]
- Huettel SA, Mack PB, McCarthy G. Perceiving patterns in random series: dynamic processing of sequence in prefrontal cortex. Nat Neurosci. 2002;5(5):485–490. doi: 10.1038/nn841. [DOI] [PubMed] [Google Scholar]
- Kastner S, Ungerleider LG. Mechanisms of visual attention in the human cortex. Annu Rev Neurosci. 2000;23:315–341. doi: 10.1146/annurev.neuro.23.1.315. [DOI] [PubMed] [Google Scholar]
- Kawashima R, O'Sullivan BT, Roland PE. Positron-emission tomography studies of cross-modality inhibition in selective attentional tasks: closing the “mind's eye”. Proc Natl Acad Sci U S A. 1995;92(13):5969–5972. doi: 10.1073/pnas.92.13.5969. [DOI] [PMC free article] [PubMed] [Google Scholar]
- Koechlin E, Corrado G, Pietrini P, Grafman J. Dissociating the role of the medial and lateral anterior prefrontal cortex in human planning. Proc Natl Acad Sci U S A. 2000;97(13):7651–7656. doi: 10.1073/pnas.130177397. [DOI] [PMC free article] [PubMed] [Google Scholar]
- Koechlin E, Hyafil A. Anterior prefrontal function and the limits of human decision-making. Science. 2007;318(5850):594–598. doi: 10.1126/science.1142995. [DOI] [PubMed] [Google Scholar]
- Koechlin E, Ody C, Kouneiher F. The architecture of cognitive control in the human prefrontal cortex. Science. 2003;302(5648):1181–1185. doi: 10.1126/science.1088545. [DOI] [PubMed] [Google Scholar]
- Koechlin E, Summerfield C. An information theoretical approach to prefrontal executive function. Trends Cogn Sci. 2007;11(6):229–235. doi: 10.1016/j.tics.2007.04.005. [DOI] [PubMed] [Google Scholar]
- Kouneiher F, Charron S, Koechlin E. Motivation and cognitive control in the human prefrontal cortex. Nat Neurosci. 2009;12(7):939–945. doi: 10.1038/nn.2321. [DOI] [PubMed] [Google Scholar]
- Lauritzen M. Reading vascular changes in brain imaging: is dendritic calcium the key? Nat Rev Neurosci. 2005;6(1):77–85. doi: 10.1038/nrn1589. [DOI] [PubMed] [Google Scholar]
- Liu X, Hairston J, Schrier M, Fan J. Common and distinct networks underlying reward valence and processing stages: A meta-analysis of functional neuroimaging studies. Neuroscience & Biobehavioral Reviews. 2011;35(5):1219–1236. doi: 10.1016/j.neubiorev.2010.12.012. [DOI] [PMC free article] [PubMed] [Google Scholar]
- Logothetis NK. The ins and outs of fMRI signals. Nat Neurosci. 2007;10(10):1230–1232. doi: 10.1038/nn1007-1230. [DOI] [PubMed] [Google Scholar]
- Logothetis NK. What we can do and what we cannot do with fMRI. Nature. 2008;453(7197):869–878. doi: 10.1038/nature06976. [DOI] [PubMed] [Google Scholar]
- Logothetis NK, Pauls J, Augath M, Trinath T, Oeltermann A. Neurophysiological investigation of the basis of the fMRI signal. Nature. 2001;412(6843):150–157. doi: 10.1038/35084005. [DOI] [PubMed] [Google Scholar]
- MacDonald AW, 3rd, Cohen JD, Stenger VA, Carter CS. Dissociating the role of the dorsolateral prefrontal and anterior cingulate cortex in cognitive control. Science. 2000;288(5472):1835–1838. doi: 10.1126/science.288.5472.1835. [DOI] [PubMed] [Google Scholar]
- MacLeod CM. Half a century of research on the Stroop effect: an integrative review. Psychol Bull. 1991;109(2):163–203. doi: 10.1037/0033-2909.109.2.163. [DOI] [PubMed] [Google Scholar]
- Menon V, Uddin LQ. Saliency, switching, attention and control: a network model of insula function. Brain Struct Funct. 2010;214(5–6):655–667. doi: 10.1007/s00429-010-0262-0. [DOI] [PMC free article] [PubMed] [Google Scholar]
- Miller EK. The prefrontal cortex and cognitive control. Nat Rev Neurosci. 2000;1(1):59–65. doi: 10.1038/35036228. [DOI] [PubMed] [Google Scholar]
- Mukamel R, Gelbard H, Arieli A, Hasson U, Fried I, Malach R. Coupling between neuronal firing, field potentials, and FMRI in human auditory cortex. Science. 2005;309(5736):951–954. doi: 10.1126/science.1110913. [DOI] [PubMed] [Google Scholar]
- Naidich TP, Kang E, Fatterpekar GM, Delman BN, Gultekin SH, Wolfe D, et al. The insula: anatomic study and MR imaging display at 1.5 T. Am J Neuroradiol. 2004;25(2):222–232. [PMC free article] [PubMed] [Google Scholar]
- Nee DE, Wager TD, Jonides J. Interference resolution: insights from a meta-analysis of neuroimaging tasks. Cogn Affect Behav Neurosci. 2007;7(1):1–17. doi: 10.3758/cabn.7.1.1. [DOI] [PubMed] [Google Scholar]
- Nimchinsky EA, Gilissen E, Allman JM, Perl DP, Erwin JM, Hof PR. A neuronal morphologic type unique to humans and great apes. Proc Natl Acad Sci U S A. 1999;96(9):5268–5273. doi: 10.1073/pnas.96.9.5268. [DOI] [PMC free article] [PubMed] [Google Scholar]
- Nimchinsky EA, Vogt BA, Morrison JH, Hof PR. Spindle neurons of the human anterior cingulate cortex. J Comp Neurol. 1995;355(1):27–37. doi: 10.1002/cne.903550106. [DOI] [PubMed] [Google Scholar]
- Offenhauser N, Thomsen K, Caesar K, Lauritzen M. Activity-induced tissue oxygenation changes in rat cerebellar cortex: interplay of postsynaptic activation and blood flow. J Physiol. 2005;565(Pt 1):279–294. doi: 10.1113/jphysiol.2005.082776. [DOI] [PMC free article] [PubMed] [Google Scholar]
- Pardo JV, Pardo PJ, Janer KW, Raichle ME. The anterior cingulate cortex mediates processing selection in the Stroop attentional conflict paradigm. Proc Natl Acad Sci U S A. 1990;87(1):256–259. doi: 10.1073/pnas.87.1.256. [DOI] [PMC free article] [PubMed] [Google Scholar]
- Paus T, Koski L, Caramanos Z, Westbury C. Regional differences in the effects of task difficulty and motor output on blood flow response in the human anterior cingulate cortex: a review of 107 PET activation studies. Neuroreport. 1998;9(9):R37–47. doi: 10.1097/00001756-199806220-00001. [DOI] [PubMed] [Google Scholar]
- Paus T, Petrides M, Evans AC, Meyer E. Role of the human anterior cingulate cortex in the control of oculomotor, manual, and speech responses: a positron emission tomography study. J Neurophysiol. 1993;70(2):453–469. doi: 10.1152/jn.1993.70.2.453. [DOI] [PubMed] [Google Scholar]
- Pessoa L. On the relationship between emotion and cognition. Nature Reviews Neuroscience. 2008;9(2):148–158. doi: 10.1038/nrn2317. [DOI] [PubMed] [Google Scholar]
- Petersen SE, Fox PT, Posner MI, Mintun M, Raichle ME. Positron emission tomographic studies of the cortical anatomy of single-word processing. Nature. 1988;331(6157):585–589. doi: 10.1038/331585a0. [DOI] [PubMed] [Google Scholar]
- Platt ML, Huettel SA. Risky business: the neuroeconomics of decision making under uncertainty. Nat Neurosci. 2008;11(4):398–403. doi: 10.1038/nn2062. [DOI] [PMC free article] [PubMed] [Google Scholar]
- Pochon JB, Riis J, Sanfey AG, Nystrom LE, Cohen JD. Functional imaging of decision conflict. J Neurosci. 2008;28(13):3468–3473. doi: 10.1523/JNEUROSCI.4195-07.2008. [DOI] [PMC free article] [PubMed] [Google Scholar]
- Posner MI. Information reduction in the analysis of sequential tasks. Psychol Rev. 1964;71:491–504. doi: 10.1037/h0041120. [DOI] [PubMed] [Google Scholar]
- Posner MI, DiGiralomo GJ. Executive attention: conflict, target detection, and cognitive control. In: Parasuraman R, editor. The Attentive Brain. MIT Press; Cambridge, Massachusetts: 1998. pp. 401–423. [Google Scholar]
- Posner MI, Petersen SE, Fox PT, Raichle ME. Localization of cognitive operations in the human brain. Science. 1988;240(4859):1627–1631. doi: 10.1126/science.3289116. [DOI] [PubMed] [Google Scholar]
- Posner MI, Snyder CRR. Attention and cognitive control. In: Solso RL, editor. Information processing and cognition: the Loyola symposium. L. Erlbaum Association; Hillsdale, N.J: 1975. [Google Scholar]
- Power Jonathan D., Cohen Alexander L., Nelson Steven M., Wig Gagan S., Barnes Kelly A., Church Jessica A., et al. Functional Network Organization of the Human Brain. Neuron. 2011;72(4):665–678. doi: 10.1016/j.neuron.2011.09.006. [DOI] [PMC free article] [PubMed] [Google Scholar]
- Preuschoff K, Quartz SR, Bossaerts P. Human insula activation reflects risk prediction errors as well as risk. J Neurosci. 2008;28(11):2745–2752. doi: 10.1523/JNEUROSCI.4286-07.2008. [DOI] [PMC free article] [PubMed] [Google Scholar]
- Procyk E, Tanaka YL, Joseph JP. Anterior cingulate activity during routine and non-routine sequential behaviors in macaques. Nat Neurosci. 2000;3(5):502–508. doi: 10.1038/74880. [DOI] [PubMed] [Google Scholar]
- Raichle ME, Mintun MA. Brain work and brain imaging. Annu Rev Neurosci. 2006;29:449–476. doi: 10.1146/annurev.neuro.29.051605.112819. [DOI] [PubMed] [Google Scholar]
- Rao H, Korczykowski M, Pluta J, Hoang A, Detre JA. Neural correlates of voluntary and involuntary risk taking in the human brain: an fMRI Study of the Balloon Analog Risk Task (BART) Neuroimage. 2008;42(2):902–910. doi: 10.1016/j.neuroimage.2008.05.046. [DOI] [PMC free article] [PubMed] [Google Scholar]
- Rees G, Friston K, Koch C. A direct quantitative relationship between the functional properties of human and macaque V5. Nat Neurosci. 2000;3(7):716–723. doi: 10.1038/76673. [DOI] [PubMed] [Google Scholar]
- Rossi AF, Pessoa L, Desimone R, Ungerleider LG. The prefrontal cortex and the executive control of attention. Experimental Brain Research. 2009;192(3):489–497. doi: 10.1007/s00221-008-1642-z. [DOI] [PMC free article] [PubMed] [Google Scholar]
- Rushworth MF, Behrens TE. Choice, uncertainty and value in prefrontal and cingulate cortex. Nat Neurosci. 2008;11(4):389–397. doi: 10.1038/nn2066. [DOI] [PubMed] [Google Scholar]
- Seeley WW, Menon V, Schatzberg AF, Keller J, Glover GH, Kenna H, et al. Dissociable intrinsic connectivity networks for salience processing and executive control. J Neurosci. 2007;27(9):2349–2356. doi: 10.1523/JNEUROSCI.5587-06.2007. [DOI] [PMC free article] [PubMed] [Google Scholar]
- Shannon CE. A mathematical theory of communication. The Bell System Technical Journal. 1948;27:379–423. 623–656. [Google Scholar]
- Shmuel A, Augath M, Oeltermann A, Logothetis NK. Negative functional MRI response correlates with decreases in neuronal activity in monkey visual area V1. Nat Neurosci. 2006;9(4):569–577. doi: 10.1038/nn1675. [DOI] [PubMed] [Google Scholar]
- Shmuel A, Yacoub E, Pfeuffer J, Van de Moortele PF, Adriany G, Hu X, et al. Sustained negative BOLD, blood flow and oxygen consumption response and its coupling to the positive response in the human brain. Neuron. 2002;36(6):1195–1210. doi: 10.1016/s0896-6273(02)01061-9. [DOI] [PubMed] [Google Scholar]
- Singer T, Seymour B, O'Doherty J, Kaube H, Dolan RJ, Frith CD. Empathy for pain involves the affective but not sensory components of pain. Science. 2004;303(5661):1157–1162. doi: 10.1126/science.1093535. [DOI] [PubMed] [Google Scholar]
- Smith AT, Williams AL, Singh KD. Negative BOLD in the visual cortex: Evidence against blood stealing. Human Brain Mapping. 2004;21(4):213–220. doi: 10.1002/hbm.20017. [DOI] [PMC free article] [PubMed] [Google Scholar]
- Smith EE. Choice reaction time: an analysis of the major theoretical positions. Psychol Bull. 1968;69(2):77–110. doi: 10.1037/h0020189. [DOI] [PubMed] [Google Scholar]
- Solomon M, Ozonoff SJ, Ursu S, Ravizza S, Cummings N, Ly S, et al. The neural substrates of cognitive control deficits in autism spectrum disorders. Neuropsychologia. 2009;47(12):2515–2526. doi: 10.1016/j.neuropsychologia.2009.04.019. [DOI] [PMC free article] [PubMed] [Google Scholar]
- Sridharan D, Levitin DJ, Menon V. A critical role for the right frontoinsular cortex in switching between central-executive and default-mode networks. Proc Natl Acad Sci U S A. 2008;105(34):12569–12574. doi: 10.1073/pnas.0800005105. [DOI] [PMC free article] [PubMed] [Google Scholar]
- Strange BA, Duggins A, Penny W, Dolan RJ, Friston KJ. Information theory, novelty and hippocampal responses: unpredicted or unpredictable? Neural Netw. 2005;18(3):225–230. doi: 10.1016/j.neunet.2004.12.004. [DOI] [PubMed] [Google Scholar]
- Thompson KG, Biscoe KL, Sato TR. Neuronal basis of covert spatial attention in the frontal eye field. J Neurosci. 2005;25(41):9479–9487. doi: 10.1523/JNEUROSCI.0741-05.2005. [DOI] [PMC free article] [PubMed] [Google Scholar]
- Treisman A. Perceptual grouping and attention in visual search for features and for objects. J Exp Psychol Hum Percept Perform. 1982;8(2):194–214. doi: 10.1037//0096-1523.8.2.194. [DOI] [PubMed] [Google Scholar]
- Ullsperger M, von Cramon DY. Decision making, performance and outcome monitoring in frontal cortical areas. Nat Neurosci. 2004;7(11):1173–1174. doi: 10.1038/nn1104-1173. [DOI] [PubMed] [Google Scholar]
- Ursu S, Clark KA, Aizenstein HJ, Stenger VA, Carter CS. Conflict-related activity in the caudal anterior cingulate cortex in the absence of awareness. Biol Psychol. 2009;80(3):279–286. doi: 10.1016/j.biopsycho.2008.10.00. [DOI] [PMC free article] [PubMed] [Google Scholar]
- Van Snellenberg JX, Wager TD. Cognitive and motivational functions of the human prefrontal cortex. In: Christensen A-L, Bougakov D, Goldberg E, editors. Luria's Neuropsychological Investigation. Oxford University Press; New York: 2009. pp. 30–61. [Google Scholar]
- van Veen V, Cohen JD, Botvinick MM, Stenger VA, Carter CS. Anterior cingulate cortex, conflict monitoring, and levels of processing. Neuroimage. 2001;14(6):1302–1308. doi: 10.1006/nimg.2001.0923. [DOI] [PubMed] [Google Scholar]
- Viswanathan A, Freeman RD. Neurometabolic coupling in cerebral cortex reflects synaptic more than spiking activity. Nat Neurosci. 2007;10(10):1308–1312. doi: 10.1038/nn1977. [DOI] [PubMed] [Google Scholar]
- Wager TD, Sylvester CY, Lacey SC, Nee DE, Franklin M, Jonides J. Common and unique components of response inhibition revealed by fMRI. Neuroimage. 2005;27(2):323–340. doi: 10.1016/j.neuroimage.2005.01.054. [DOI] [PubMed] [Google Scholar]
- Walsh BJ, Buonocore MH, Carter CS, Mangun GR. Integrating Conflict Detection and Attentional Control Mechanisms. Journal of Cognitive Neuroscience. 2010;23(9):2211–2221. doi: 10.1162/jocn.2010.21595. [DOI] [PMC free article] [PubMed] [Google Scholar]
- Walton ME, Devlin JT, Rushworth MF. Interactions between decision making and performance monitoring within prefrontal cortex. Nat Neurosci. 2004;7(11):1259–1265. doi: 10.1038/nn1339. [DOI] [PubMed] [Google Scholar]
- Wang H, Liu X, Fan J. Cognitive control in majority search: a computational modeling approach. Front Hum Neurosci. 2011;5:16. doi: 10.3389/fnhum.2011.00016. [DOI] [PMC free article] [PubMed] [Google Scholar]
- Yoshida W, Ishii S. Resolution of uncertainty in prefrontal cortex. Neuron. 2006;50(5):781–789. doi: 10.1016/j.neuron.2006.05.006. [DOI] [PubMed] [Google Scholar]
- Zysset S, Wendt CS, Volz KG, Neumann J, Huber O, von Cramon DY. The neural implementation of multi-attribute decision making: a parametric fMRI study with human subjects. Neuroimage. 2006;31(3):1380–1388. doi: 10.1016/j.neuroimage.2006.01.017. [DOI] [PubMed] [Google Scholar]