

Abstract
The hyperbolic form of the power-duration relationship is rigorous and highly conserved across species, forms of exercise and individual muscles/muscle groups. For modalities such as cycling, the relationship resolves to two parameters, the asymptote for power (critical power, CP) and the so-called W′ (work doable above CP), which together predict the tolerable duration of exercise above CP. Crucially, the CP concept integrates sentinel physiological profiles - respiratory, metabolic and contractile - within a coherent framework that has great scientific and practical utility. Rather than calibrating equivalent exercise intensities relative to metabolically distant parameters such as the lactate threshold or V̇O2 max, setting the exercise intensity relative to CP unifies the profile of systemic and intramuscular responses and, if greater than CP, predicts the tolerable duration of exercise until W′ is expended, V̇O2 max is attained, and intolerance is manifested. CP may be regarded as a ‘fatigue threshold’ in the sense that it separates exercise intensity domains within which the physiological responses to exercise can (<CP) or cannot (>CP) be stabilized. The CP concept therefore enables important insights into 1) the principal loci of fatigue development (central vs. peripheral) at different intensities of exercise, and 2) mechanisms of cardiovascular and metabolic control and their modulation by factors such as O2 delivery. Practically, the CP concept has great potential application in optimizing athletic training programs and performance as well as improving the life quality for individuals enduring chronic disease.
Keywords: exercise intolerance, pulmonary gas exchange, blood lactate, muscle metabolites, vascular control, hypoxia, hyperoxia, heart failure, COPD, disease, aging
Introduction
Human physiologists and sport scientists are naturally interested in the link between the development of fatigue (and its mechanistic portents) and exercise performance. Fatigue is an on-going dynamic process during high-intensity exercise involving central and peripheral mechanisms that temporarily limit the power producing capabilities of the integrated neuromuscular system. Fatigue is distinct from task failure, which is defined as the point at which fatigue develops to the point at which it, or its symptoms, cause intolerance and therefore limits the desired exercise performance. The link between fatigue and performance has historically been regarded as elusive; however, in recent years compelling evidence has indicated that it is enshrined within the concept of a ‘critical power’ (CP). At its essence, this concept describes the tolerable duration of severe-intensity exercise. When the time to the limit of tolerance is plotted against particular constant speeds or power outputs, the relationship is not linear (as one might perhaps naively expect), but is rather curvilinear, with the ability to sustain exercise falling away more sharply at higher compared to lower exercise powers (Fig. 1). Mathematically, this relationship is described as being hyperbolic. When exercise tolerance is considered, the power-asymptote is known as CP (or critical speed [CS] when intensity is measured in units of speed rather than power) and the curvature constant is known as W′ (i.e., W prime) and is measured in units of work done, that is, J (or D′ when measured in units of distance, that is, m). This hyperbolic power-duration relationship can be transformed into a linear relationship if work done is plotted against time, such that the slope of the line equals CP and the intercept equals W′.
Figure 1.
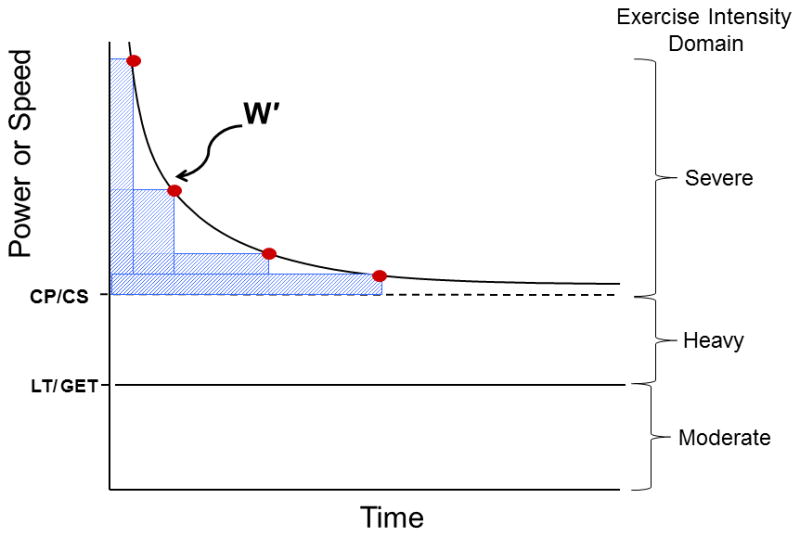
The hyperbolic Power/Speed-duration curve that defines the limit of tolerance for whole body exercise such as cycling or running as well as individual muscle, joint or muscle group exercise. The curve is constructed by the subject exercising at constant power or speed to the point of exhaustion (points 1–4). Typically these bouts are performed on different days and result in exhaustion within 2–15 min. This hyperbolic relationship is highly conserved across the realm of human physical activities and exercise modes and also across the animal kingdom and is defined by two parameters: the asymptote for power (Critical Power, CP, or speed, Critical Speed, CS, and their metabolic equivalent, V̇O2) and the curvature constant W′ (denoted by the rectangular boxes above CP and expressed in kJ). Note that CP/CS defines the upper boundary of the heavy intensity domain and represents the highest power sustainable without drawing continuously upon W′. Above CP (severe intensity exercise) exhaustion occurs when W′ has been expended. Severe intensity exercise is characterized by a V̇O2 profile that rises continuously to V̇O2max and blood lactate that increases to exhaustion (see text for additional details). LT, lactate threshold, defined usefully during incremental or ramp exercise as the V̇ O2 above which blood lactate begins its sustained increase; GET, gas exchange threshold as identified from the non-linearity of the V̇ O2/V̇ CO2 relationship.
A Threshold in Biological Function
Credit for recognition of the inherent hyperbolicity between exercise intensity and its sustainability should be given to the British physiologist, A. V. Hill. In 1925 published in Nature, Hill plotted the relationship between average speed and sustainable time using world record performance times over a variety of distances in men’s and women’s running and swimming, and showed that in each case the relationship was hyperbolic (42). This relationship remains evident when today’s world record performances are plotted in the same way. This is of interest because it indicates that the human power-duration relationship is hyperbolic in its nature, not only when the performance of a single individual is appraised, but also when the best human performances are established by different individuals. It is also known that this hyperbolic power-duration relationship holds not just for individuals performing a wide range of whole-body activities (cycling, running, rowing, swimming) but also when the exercise is confined to a single muscle or joint (16,61,48 rev. 47,48). Moreover, the power-duration relationship is an integral property of muscular performance in an array of other species including the lungless salamander, ghost crab, mouse, and thoroughbred racehorse (rev. 47). The consistency of these observations indicates that the power-duration relationship, and the bioenergetic features underpinning it, is an integral feature of integrative biological exercise performance.
The Characteristics of the Power-Duration Relationship
It should be emphasised that the power-duration relationship describes exercise tolerance but does not, in itself, explain it. Nevertheless, the physiological responses to exercise performed below and above CP asymptote may provide important insights into the fatigue process. CP was originally defined as the external power output that could be sustained ‘indefinitely’ or for ‘a very long time without fatigue’ (69). This definition should be considered theoretical, however, since it is clear that no exercise can ever be undertaken indefinitely. Rather, it is now understood that CP separates power outputs for which exercise tolerance is predictably limited (exercise >CP which may be sustained for a maximum of perhaps 30 minutes) from those that can be sustained for longer periods (<CP). The actual time to intolerance (Tlim) for exercise performed above CP is defined, and therefore closely predicted, by the equation:
| [Eqn. 1] |
This equation highlights that the time to intolerance >CP is a function of 1) the proximity of the power output (P) being sustained to CP and 2) the size of W′. When P is considerably above CP, the constant amount of work represented by the W′ parameter will be utilized rapidly and Tlim will be short. Should P be closer to CP, then W′ would be ‘used’ more slowly and Tlim would be longer. A crucial consideration here is that W′ is assumed to be constant for all P above CP. This ‘two parameter’ power-time or power-duration model therefore implies that absolute exercise performance depends on simply the value of CP (in W) and the value of W′ (in J). Both CP and W′ parameters can vary considerably among individuals as a function of health/disease, age, fitness and training (102).
Critical Power Represents a Metabolic Rate
In contrast to historical definitions, CP is now considered to represent the greatest metabolic rate that results in ‘wholly-oxidative’ energy provision, where wholly-oxidative considers the active organism in toto and means that energy supply through substrate-level phosphorylation reaches a steady-state, and that there is no progressive accumulation of blood lactate or breakdown of intramuscular phosphocreatine (PCr) i.e., the rate of lactate production in active muscle is matched by its rate of clearance in muscle and other tissues. It is important to note here, however, that there will always be some error in the estimation of CP, and CP varies slightly from day to day in the same subject (91). Although it is possible to estimate CP to the nearest Watt (e.g. 200 W), given a typical error of ~5%, the ‘actual’ CP might lie between approximately 190 W and 210 W in a given individual. Therefore, asking a subject to exercise exactly at his or her estimated CP runs the risk that s/he will be above their individual CP with associated implications for physiological responses and exercise tolerance. As CP is primarily a rate of oxidative metabolism (rather than the mechanical power output, by which it is typically measured) it might be more properly termed ‘critical V̇O2’. During cycling, the external power output corresponding to this critical V̇O2 can be altered as a consequence of the chosen pedal rate for example (6). Similarly, the actual CS equivalent to critical V̇O2 during other forms of exercise will depend on movement economy. However, it is because the critical V̇O2 is expressed ‘functionally’ in units of power or speed that it is so powerful in the prediction of exercise tolerance or exercise performance (47).
The CP threshold lies approximately equidistant between the so-called lactate threshold (LT) or gas exchange threshold (GET) and the maximum power output attained during incremental exercise. However, both, LT/GET and CP can vary widely amongst individuals depending on the state of health or training. Specifically, LT/GET and CP occur at 50–65% and 70–80% V̇O2max respectively in healthy young subjects. In contrast, in well-trained individuals (where the maximal rates of oxidative metabolism are increased by endurance training) or in some patients with chronic disease (where maximal rates of O2 transport and utilization are selectively reduced), LT/GET and CP can reach approximately 70–80% and 80–90% V̇O2max respectively (96). Crucially, physiological behavior differs markedly according to whether constant-power exercise is performed below or above these thresholds. Poole et al. (76) measured the physiological responses of human volunteers exercising on a cycle ergometer at constant power outputs set at or just above (+5% of ramp test peak power) the pre-determined CP. During exercise at CP, the subjects attained a steady-state in pulmonary gas exchange, ventilation and blood lactate concentration and all were able to complete the target of 24 minutes of exercise without difficulty. In contrast, during exercise above CP, “steady-state” behavior was not observed, with V̇O2 progressing to V̇O2max and blood lactate increasing inexorably until exercise was terminated prior to the 24 minute target. This study clearly indicates that CP is a ‘threshold’ that separates exercise intensity domains within which V̇O2 and blood lactate do not continue to rise (termed “heavy” for the domain which is above LT/GET but below CP) and that which they do (termed “severe”). Moreover, this study indicates that there is a range of power outputs, that are ostensibly ‘sub-maximal’, but for which the V̇O2max will be reached if exercise is continued to intolerance. For both heavy and severe-intensity exercise the presence of the V̇O2 slow component erodes description of exercise intensity/work rate as a % V̇O2max since, at a given work rate, V̇O2 increases as a function of time.
Using knee extension exercise during 31P-magnetic resonance spectroscopy, Jones et al. (48) confirmed that this threshold concept of CP also applied to intramuscular metabolism. During exercise 10% below CP, muscle PCr and inorganic phosphate (Pi) concentrations and pH each reached constant values within 1–2 minutes of the start of exercise and were maintained constant for 20 minutes whereas, during exercise 10% above CP, these variables changed progressively with time until the limit of tolerance was reached (in approximately 12 minutes). The progressive slow component increase in V̇O2 (76) and decline in PCr concentration (48) observed during constant power exercise above CP, indicates a continuous loss of skeletal muscle efficiency with important implications for the fatigue process (17,38).
Vanhatalo et al. (100) studied the intramuscular responses to exercise at different power outputs (and correspondingly different times-to-intolerance, in the range of 2–15 minutes) above CP. Intriguingly, the values of PCr, Pi and pH achieved at intolerance were the same in normoxia and hyperoxia. It is tempting to interpret this to indicate that exercise intolerance above CP is related to the attainment of a particular muscle metabolic milieu comprising “critically low” and/or “critically high” values of representative muscle substrates and metabolites which act either directly to impair contractile function or indirectly to limit muscle activation. It is equally tempting to speculate that the mechanisms causing intolerance may be different for exercise performed above CP, wherein the W′ is drawn upon continuously and cardio-respiratory and muscle metabolic responses to exercise cannot be stabilized, compared to exercise performed below CP (see below). It is important to appreciate, however, that CP does not separate power outputs that are non-sustainable from those that are sustainable. Rather, exercise tolerance above a known CP is predictable (from Eqn. 1) from knowledge of the power output and W′.
W′ Represents a Work Constant Providing Insight into Exercise Limitation
Whereas the CP parameter is well defined as the greatest oxidative metabolic rate that can be sustained without a continuous reduction in W′, the physiological determinants of W′ are more difficult to resolve. Originally, W′ was conceived as a finite, chiefly anaerobic, energy store comprising high-energy phosphates and energy derived from anaerobic glycolysis, together with a small amount of aerobic energy linked to O2 stores (61,62). While mathematically accurate, the physiological interpretation of this model is more complex than previously thought. The tight qualitative relationship between the development of the V̇O2 slow component and dynamic changes in W′ during severe-intensity exercise (103), along with a positive correlation between the size of the V̇O2 slow component and the size of W′ (64,103), suggest an intrinsic link between the loss of skeletal muscle efficiency and the development of fatigue. CP and W′ can change in opposite directions in response to an intervention. For example, endurance exercise training (36,99) and breathing a hyperoxic gas (100) both tend to increase CP to a greater extent than V̇O2max, thereby reducing the range of metabolic rates spanning the severe-intensity exercise domain; in such situations, there is a commensurate reduction in W′. From this, it is apparent that CP and W′ should not be considered as separate ‘aerobic’ and ‘anaerobic’ entities but rather as components of an integrated bioenergetic system.
Thus the power-duration relationship provides a cohesive framework within which to investigate the mechanistic bases of exercise-related fatigue and intolerance. Moreover, it can help assess what feats are within the realms of human capabilities including human-powered flight (12,47), the sub-2 hour marathon (89) and the rehabilitation of patient populations. The purpose of this article is to synthesize our current understanding of the ‘CP concept’ from neuromuscular, metabolic and cardiovascular perspectives, and to consider the bioenergetic and performance-related consequences of traversing CP in healthy individuals and in patients suffering from chronic diseases such as heart failure (CHF) and chronic obstructive pulmonary disease (COPD).
Critical Torque and Fatigue Mechanisms During Isometric Contractions
One feature of the CP concept is its apparent universality. It appears to apply across all animal species so far studied, as well as for the full range of exercise modes in humans (47). That it applies to isometric contractions of single agonist muscle groups (in which critical force or critical torque [CT] are the appropriate terms) is important for two reasons: first, it implies that the factors that determine the parameters of the relationship are not peculiar to “whole-body” dynamic exercise; second, isometric contractions are ideally suited to the study of the mechanisms of neuromuscular fatigue in vivo. Historically, the hyperbolic force/torque-duration relationship has appeared frequently in the fatigue literature since the original observations of Rohmert (81). It was Monod and Scherrer (61) who coined the term “critical power” to define what was, in fact, the asymptote of the muscle force-duration relationship of the upper and lower limb muscles. Other investigators have noted asymptotic force-duration relationships in sustained contractions of the elbow flexors (39,61) and repeated contractions of the diaphragm (9,29). Enoka and Stuart (29) noted that the hyperbolic “force-fatigability relationship” most likely reflected the interaction of various fatigue mechanisms and, crucially, that such a relationship implies that the fatigue mechanisms must somehow scale with the required force. Surprisingly, however, it is only relatively recently that the fatigue mechanisms underpinning the torque-duration relationship have been investigated.
That pedal frequency influences the critical power during cycle ergometry is well documented (6). In isometric contractions, the equivalent is the contraction duty cycle. This was recognized by Monod and Scherrer (61), who predicted that sustained contractions would result in a CT of ~15% of the maximal voluntary contraction (MVC) torque, whereas contractions with a 50% duty cycle would yield a CT of 40% MVC. Recent studies have confirmed this prediction, with CT occurring at ~30% MVC for contractions with a 60% duty cycle (16,18). The dependence of CT on the duty cycle is of general importance for investigations of fatigue, where studies frequently rely on a single relative torque demand (typically ranging from 20–50% MVC) in all subjects. This is because the physiological profile produced by these contractions depends on the proximity of the subject to their own CT, not their %MVC. This effect is clear to see from the work of Saugen et al. (84), in which contractions at 40% MVC were performed with a 60% duty cycle. Most of the subjects in this study were exercising above CT, and demonstrated characteristically non-steady state metabolic responses to these contractions (48). However, it is apparent from Fig. 2 in Saugen et al. (84) that at least two participants did not exceed CT, and exercised for considerably longer and with substantially less metabolic stress than others in those experiments. These results suggest that the estimation of CT (e.g.,16,28) and the selection of torque demands relative to it might be a useful addition to preliminary exercise testing in neuromuscular fatigue studies.
Fatigue mechanisms are usually classified as being of three forms: 1) peripheral fatigue, encompassing mechanisms of torque loss attributable to events distal to the neuromuscular junction (i.e., within the muscle fibers); 2) central fatigue, in which torque losses are attributable to events proximal to the neuromuscular junction (i.e., residing within the nervous system) and 3) “global fatigue”, or neuromuscular fatigue per se, which is represented by a fall in the MVC as a result of the combined effects of peripheral and central fatigue (18,69). It is generally accepted that fatigue mechanisms depend on contractile intensity (69). “Low-intensity” contractions (sustained contractions at or below 15% MVC) are associated with prominent central fatigue and limited peripheral fatigue (90), whereas “high-intensity” contractions (sustained at or above 20% MVC or intermittent contractions above 50% MVC; 10,84) are associated with predominately peripheral mechanisms of fatigue. However, the dividing line between “low” and “high” intensity contractions is seldom clearly defined in the fatigue literature. It is possible that fatigue processes scale proportionately with torque demands and that the transition from central to peripheral mechanisms is gradual. Alternatively, it could be that there is a more sudden change in neuromuscular system behavior at some identifiable threshold. CT is clearly a strong candidate for such a fatigue threshold. To address these issues, Burnley et al. (18) performed a comprehensive investigation of the neuromuscular fatigue mechanisms operant below and above CT. Five prediction trials were performed (at ~35–60% MVC) to task failure in order determine CT and W′ parameters, employing an intermittent contraction regime similar to that of Bigland-Ritchie et al. (10). Using a 60% duty cycle (3 s contraction, 2 s rest), subjects were required to achieve a desired torque target during each contraction, and at the end of each minute an MVC was performed with percutaneous electrical stimulation in order to determine the extent of global, central and peripheral fatigue. Subsequently, subjects performed trials at 80% and 90% of CT for 60 min or until task failure, whichever occurred sooner.
The results of these experiments demonstrated that both central and peripheral fatigue did occur below CT, and modest compensatory neuromuscular adjustments, reflected in an increase in rectified EMG amplitude, were made in response (18). As a result, all but one test below CT continued for the full 60 min trial duration, the majority of subjects doing so with relative ease. Contractions performed above CT were quite different, with both “global” neuromuscular fatigue and peripheral fatigue developing 4–5 times faster at the lowest torque target above CT (~111% CT) than at 90% of CT (19; Fig 2). Moreover, the rate at which peripheral fatigue developed increased proportionately above CT, and back-extrapolation of that relationship predicted that no peripheral fatigue should have been evident below ~33% MVC (that is, within the confidence limits of the estimated CT). That peripheral fatigue did develop below CP, albeit at a much slower rate, and that its development was not predictable from measurements above CT, strongly suggests that the mechanisms of peripheral fatigue were distinctly different below compared to above CT. In short, CT represents a critical neuromuscular fatigue threshold.
Figure 2.

Peripheral fatigue below and above the critical torque assessed by the potentiated doublet response. Panel A, potentiated doublet responses to exercise performed at 80% (black circles) and 90% (white circles) of the CT, and during 5 tests performed above the CT (triangles, squares and diamonds). Final datum in each test represents the mean (± SEM) doublet response at task end (below CT) or task failure (above CT). Note the decline in the potentiated doublet (i.e., peripheral fatigue) in all trials, but the substantially faster decline above the CT. Panel B, the mean ± SEM rate of change in the potentiated doublet in each test. The black circles represent the tests above the CT, white circles those tests below the CT. The solid line is a best fit linear regression through the above CT data. Backward extrapolation shows that the rate of peripheral fatigue below CT cannot be predicted from measures made above CT, and this extrapolation predicts no peripheral fatigue should occur below ~34% MVC (dashed lines). The CT in this study was 34 ± 2% (reproduced from 18, with permission).
A major component of peripheral fatigue during high-intensity contractions is thought to be of metabolic origin (rev. 1,69, see “No muscle is an island” paper in this series). This is consistent with the non-steady state profiles of PCr, Pi, blood and muscle lactate concentrations (48,100), as well as pulmonary and muscle V̇O2 that occur exclusively above CP (74,76). At task failure, the same degree of peripheral fatigue is reached irrespective of exercise duration performed above CT (16,18), and this is also the case for concentrations of PCr and Pi as well as pH at task failure during dynamic contractions above CP (100). Each of these findings suggests that, all else being equal, a similar metabolic disturbance and degree of peripheral fatigue is evident at task failure above CT/CP (100), perhaps reflecting the constant amount of impulse or work that the muscle can accumulate above CT/CP (expressed as the W′ parameter). In addition, Burnley et al. (18) demonstrated that central fatigue developed above CT, but interestingly this seemed to develop most during the longer bouts of exercise, suggesting that time-on-task, rather than contractile intensity per se, may be responsible. This indicates that a dominant mechanism of central fatigue development in severe-intensity exercise could be reduced motor neuron excitability as contractions progress (45,55), although this has yet to be tested experimentally.
Below CT, the progressive development of peripheral fatigue (Fig. 2), albeit slow, occurs in the face of measurably invariant metabolic and cardiorespiratory function (48,76). Thus, metabolic factors are unlikely to be responsible for such a decline (5). It is also unlikely that a loss of membrane potential consequent to interstitial K+ accumulation is responsible, since interstitial K+ seldom exceeds 7–8 mM during steady-state contractions (50). A more likely cause of peripheral fatigue below CT is glycogen depletion. In particular, the pivotal role that localized stores of muscle glycogen play in sarcoplasmic reticulum function, and thus excitation-contraction coupling, has recently been highlighted (67, see “No muscle is an island” paper in this series).
Conclusions
CT/CP/CS constitutes a critical neuromuscular fatigue threshold separating exercise intensity domains associated with distinct fatigue mechanisms. Yet the physiological factor (or factors) that “trips” the neuromuscular system into a novel phase of behavior is not known. Nor is it known whether the distinction between heavy and severe intensity domains is crisp, or whether there is a “bandwidth” of torque or power output within which the resulting fatigue responses are entirely unpredictable, representing nonlinear chaos (for review see ref. 68 and references therein). It may also be that physiological imprecision and statistical uncertainty conspire to create this grey region. The application of nonlinear dynamics measurements to neuromuscular fatigue is in its infancy (e.g., 68), but only with the application of a range of physiological approaches is the physiological basis of the CT boundary likely to be resolved.
The Role of Oxygen in Shaping the Power-Duration Curve
According to the traditional interpretation of the power-duration parameters (Fig. 1), CP represents the greatest rate of ‘wholly oxidative’ energy provision (in close proximity to the maximal lactate steady-state), and the W′ is a finite work capacity above CP chiefly derived from anaerobic metabolism (61). This definition of the W′ as a fixed anaerobic energy store has been challenged by the findings that the W′ is associated with the kinetic features of the V̇O2 response (e.g. 3,11,64,102). Burnley & Jones (17) proposed that W′ is a function of the V̇O2 slow component, V̇O2max and the depletion of limited intramuscular substrates (that is, muscle PCr and glycogen) and the associated accumulation of fatigue-related metabolites, such as H+, adenosine diphosphate (ADP) and Pi; each of which is associated with impaired muscle contractile function. The V̇O2 slow component reflects a loss of efficiency of muscular work, stemming predominantly from active muscle (74). The power-duration relationship may, therefore, reflect the V̇O2 kinetics and the underlying respiratory control mechanism(s), which are ultimately constrained during severe-intensity exercise by the attainment of V̇O2max. Here we summarize the current evidence in support of this interpretation.
Cellular bioenergetics entail an intricate signalling network that governs the flux of electrons from energy substrate to O2. In healthy, non-sedentary individuals exercising under normal ambient conditions, the maximal mitochondrial oxidative rate is greater than what can be achieved in vivo during whole body exercise due to an O2 delivery limitation (72,73,80). V̇O2max is reached when the mitochondrial flux can increase no further despite continued elevation of metabolic stimulation (through accumulation of ADP and Cr) (44). O2 delivery is therefore one presiding mechanism that can limit cellular respiration during severe intensity exercise.
A 3-min all-out cycling test against fixed resistance represents an ideal experimental model that results in attainment of V̇O2max, yields a large V̇O2 slow component amplitude and complete utilization of W′ (98,103). During a 3-min all-out exercise test the finite work capacity indicated by W′ is gradually utilized, such that after ~2.5 min the W′ is reduced to zero and the power output plateaus at CP (98,99). A maximal all-out sprint sends a maximal metabolic signal to mitochondria to increase respiration such that as the power output approaches CP the V̇O2 approaches, and then plateaus at V̇O2max. Therefore, the high O2 cost (V̇O2max) of generating an end-test power output of only ~50%Δ (where %Δ is the percentage difference between the power output at V̇O2max and LT/GET) defines a significant loss of efficiency during a 3-min all-out test. A positive correlation between W′ and the amplitude of the V̇O2 slow components during both all-out (103) and constant work rate exercise (64) points towards a mechanistic link between W′, development of fatigue and the loss of muscular efficiency (17).
A useful intervention to explore the mechanistic bases of the power-duration parameters is manipulation of the inspired O2. A hyperoxic inspirate elevates the O2 pressure gradient between the microvasculature and the mitochondria and reduces the slow components of pulmonary V̇O2 (106) and muscle PCr (40). Using single leg knee extension exercise, Vanhatalo et al. (100) showed that inspiration of 70% O2 compared to air significantly increased CP while decreasing W′. As a result, the power-duration curve predicted that exercise tolerance was improved at work rates less than ~150% of CP (Fig. 3). These data support the traditional notion that CP is a parameter of aerobic fitness but challenge the traditional definition of W′ as an anaerobic work capacity. The rate with which muscle PCr and pH fell during the prediction trials was attenuated in hyperoxia, indicating a slower progression of metabolic perturbation, allowing longer exercise duration before the same end-exercise PCr and pH were reached (100). These results indicate that within the severe exercise intensity domain consistently low levels of intramuscular PCr and pH are reached at intolerance irrespective of the work rate or inspired O2, as hypothesized by Poole et al (76). Intolerance in severe exercise might occur when a particular intramuscular environment is achieved (of which the PCr and pH are two indices among others) and the hyperoxia intervention suggests that the extent of the disturbance to homeostasis during exercise is sensitive to the conditions of muscle O2 delivery (100).
Figure 3.
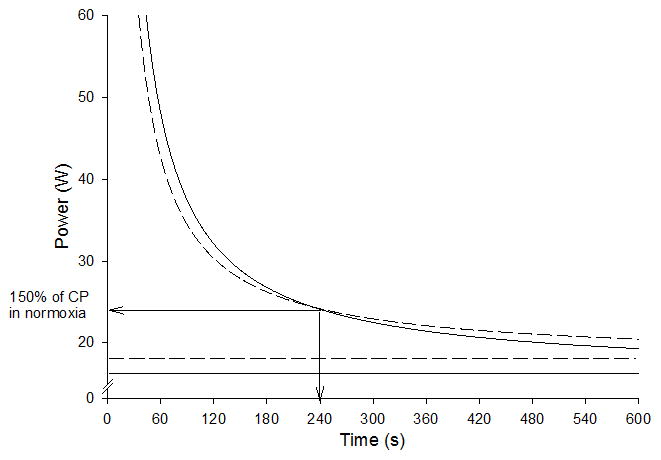
A schematic illustration of the group mean power-duration curves re-drawn on the basis of data from Vanhatalo et al. (100). The solid curve indicates power-duration relationship for knee-extension exercise in normoxia and the dashed curve in hyperoxia (70% O2). The solid horizontal line indicates CP in normoxia and the dashed line indicates CP in hyperoxia. The arrows indicate the cross-over point for the two curves at approximately 150% of CP and 4 min of exercise tolerance.
Hypoxia has detrimental effects on muscle metabolism and exercise tolerance (2,26). During high-intensity exercise there is an accelerated depletion of PCr and glycogen, and a more rapid accumulation of fatigue-related metabolites (e.g., 40,44). Hypoxia also causes a reduction in the maximal oxidative metabolic rate, and this is reflected in a slowing of muscle PCr recovery kinetics following exercise. In addition, inspiration of hypoxic gas mixtures decreases peripheral O2 diffusion, which may contribute to the slowing of V̇O2 kinetics at the onset of exercise (93). CP is reduced by acute inspiration of hypoxic gas (13–15% O2), which is associated with an arterial O2 saturation of ~76–82% at the end of exhaustive exercise (26,85). In these studies W′ was not significantly affected by acute hypoxia, but both noted great inter-individual variability in responses, which ranged from large decreases (~44–36%) to considerable increases in W′ (~38–66%), and an inverse relationship between changes in W′ and changes in CP (26,85). Simpson et al. (85) also reported that the change in W′ was positively correlated with the change in the ‘distance’ between V̇O2max and CP between normoxia and hypoxia. That is, those subjects in whom W′ increased most in hypoxia, also showed the greatest increase in the range of the severe domain (i.e., CP-V̇O2 max). These data illustrate that W′, or the ability to access W′, may be inherently linked to indices of aerobic fitness (i.e., CP and V̇O2 max); though see ref. 96 for contrary data.
Complete blood flow occlusion imposes the most extreme O2 delivery limitation for skeletal muscle and challenges the applicable range of the power-duration relationship. Using brachial occlusion in a hand-grip exercise model, Broxterman et al. (12) reduced CP to less than zero, while W′ significantly increased. Putative explanations for this elevated W′ include: a) some of the oxidative ATP turnover normally quantified within CP appeared as W′, b) the muscle somehow accessed more substrate level phosphorylation, c) the efficiency of muscle contraction and/or ATP resynthesis increased. From a theoretical perspective the negative CP indicates that under cuff occlusion there is no metabolic rate that is sustainable, including the resting metabolic rate, which makes intuitive sense. It is noteworthy that the hyperbolic nature of the power-duration relationship was conserved under blood flow occlusion. However, the precise physiological underpinnings of the shifts in the asymptote and curvature of the power-duration relationship under occlusive conditions warrant further investigation.
Conclusions
CP and W′ are sensitive to manipulation of O2 delivery: Specifically, hyperoxia increases CP, whereas hypoxia and blood flow occlusion reduce CP. In contrast, W′ is reduced in hyperoxia, reflecting that, at very high work rates in the severe domain where the relative contribution by W′ is high, exercise tolerance is decreased. Thus, for these particular work rates, the reduced W′ has a greater impact than the increased CP. In marked contrast, W′ is increased by cuff occlusion, while the responses in hypoxia are highly variable among individuals: this variability might be linked to the relative changes in CP and V̇O2max brought about by the intervention. These findings imply that the physiological underpinnings of the power-duration relationship for severe-intensity exercise are linked to respiratory control in skeletal muscle. CP sets the boundary above which the slow component drives V̇O2 to its maximum, and the loss of efficiency is associated with a predictable rate of muscle fatigue development, which in turn is reflected in the consistently hyperbolic relationship between power output and the tolerable duration of exercise.
Vascular Control Above Critical Power/Critical Speed
As evident from the above, exercise (in)tolerance is inextricably entwined with the O2 transport pathway and the capacity to regulate microvascular O2 partial pressures (PmvO2) and hence V̇O2 and metabolic control. Thus, severe-intensity exercise tolerance (i.e., > CP/CS/CT) is compromised by reductions in arterial O2 content and substantially improved by hyperoxia (2). These effects are believed to be driven, in large part, by lowering or raising the muscle O2 delivery-to-O2 utilization (Q̇O2/V̇O2) ratio and thus PmvO2 which, according to Fick’s law will act to impair or enhance blood-myocyte O2 flux and thus lower or raise intramyocyte PO2. Even numerically small changes of intramyocyte PO2 exert a profound impact upon the regulation of mitochondrial function (79) and these, in turn, will impact V̇O2 kinetics, substrate utilization profiles, high-energy phosphates and ultimately exercise tolerance.
Above CP/CS, where metabolic and gas exchange stability cannot be achieved, key vascular and Q̇O2-related changes may provide novel insights into the causes of fatigue and ultimately intolerance. In this domain substantial spatial and temporal heterogeneity exists with respect to muscle Q̇O2 and V̇O2 (41,52). Control of the exercise hyperemic response is complex with a plethora of vasoactive mediators (e.g., nitric oxide (NO), adenosine, ATP, metabolites, EDHF) that operate to control vascular conductance within the limits set by overarching anatomical, sympathetic (vasoconstriction) and mechanical (vascular compression, muscle pump) factors (rev. 49,53). When the muscle’s black box is opened, a process more feasible in rats than humans at present, it becomes evident that even the steady-state exercising Q̇ reflects the coalescence of myriad vascular tone fluctuations within thousands of skeletal muscle resistance arterioles and, to a certain extent, venules. That such altered blood flow distribution patterns are present in muscles without a detectable change in overall Q̇ has rendered Q̇O2/V̇O2 heterogeneities invisible to investigators using bulk Q̇ measurements (82). However, these heterogeneities may exceed an order of magnitude and relate to muscle(s) fiber type and oxidative capacity as well as duration, type and intensity of contractions (75). Recently, it has become evident that NO plays a commanding role in regulating muscle(s) Q̇ (and Q̇O2) and that above CS neuronal NO synthase (nNOS), and exogenously supplied nitrate (NO3−) and nitrite (NO2−) become more important sources of NO (24,25,31).
Fiber Type and Metabolic Heterogeneity: Broad Similarities Between Humans and Rats
Like animal muscles those of humans may be extensively differentiated. For instance, the human soleus is 88% slow twitch (Type I, balance fast twitch, Type II) fibers whereas the rectus femoris is only 35% Type I (46). Gifted endurance athletes may have 70% Type I fibers in their quadriceps femoris whereas power athletes are as low as 40% Type I and (e.g., 94) and extremely inactive individuals as low as 30% (71,105). Within human muscles there are more Type I fibers deeper within the human quadriceps (46) which means that, at higher exercise intensities (i.e., above CP/CS) more superficial muscle fibers are recruited. Using animal data to frame the hypothesis that these regional differences in human muscle fiber composition and vascular control would impact regional Q̇O2 (PET, rev. 41) and the Q̇O2/V̇O2 ratio (muscle deoxygenation assessed by TRS-NIRS, ref. 51), far higher muscle(s) Q̇ and a slower rate of deoxygenation were found in the deeper versus more superficial quadriceps (41,51). Derangement of this stratification in diseases such as chronic heart failure (CHF) and diabetes may reduce CP/CS and exercise tolerance in pathology (71,72).
Preferential Recruitment of Q̇O2 in Fast Twitch Muscles Above Critical Speed
Copp and colleagues (24) considered that any elevated muscle Q̇ in the severe intensity domain likely favored lower oxidative Type II fibers as these would be preferentially recruited. Indeed, for exercise just above CS, total hindlimb Q̇ increased to a far higher level than predicted based upon exercise below CS (Fig. 4, Panel B, ref. 24). More telling was that >CS muscles comprised of ≥69% Type IIb/d/x fibers received disproportionate Q̇ increases (Fig. 4, Panel C). For instance the white semimembranosus and white vastus increased >100% versus <30% for the soleus and red vastus (both highly oxidative, Type I/IIa). This supports a preferential recruitment of these low oxidative muscles >CS raising the question as to whether there is a specific O2-related aspect of these fiber types, with respect to their physiological regulation, that may account for the “extra” O2 of the V̇O2 slow component and link to fatigue. It is worth noting here that experiments in canine (107) and human (103) muscle(s) have shown that additional muscle fiber recruitment is not obligatory for the V̇O2 slow component, as once considered. However, those conditions where fiber recruitment is maximized from the onset, namely electrically-stimulated dog gastrocnemius-plantaris (107) and 3-min all-out cycling, are very different from most exercise paradigms that involve progressive fiber recruitment (72,103).
Figure 4.
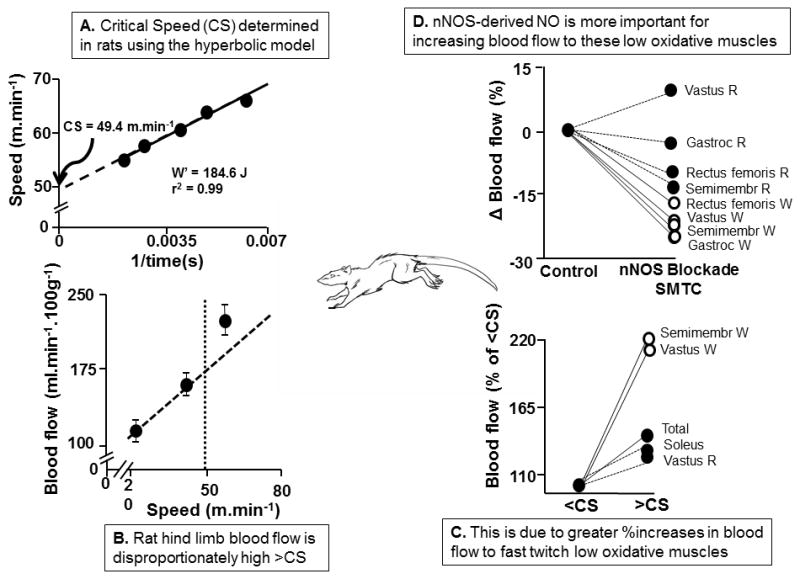
A. Critical Speed (CS, intercept of relationship) determined in the running rat (W′ is model parameter denoting work capacity achievable above CS). B. Total rat hind limb blood flow measured using radiolabeled microspheres below and above CS. Note non-linear response above CS. C. The increased hind limb blood flow >CS is directed disproportionately to muscles composed predominantly of low oxidative IIb/d/x muscle fibers (semimembranosus white, and white vastus) compared with their oxidative (Type I/IIa, soleus, red vastus) counterparts. D. The selective neuronal nitric oxide synthase (nNOS) blocker S-methylthiocitrulline (SMTC) reveals a highly selective role for nNOS facilitating increased blood flow to low oxidative (Type IIb/d/x) muscles (white rectus femoris, vastus, semimembranosus and gastrocnemius). Redrawn from refs. 24,25.
Differential Control of Q̇O2 Versus V̇O2 in Fast Twitch Fibers
Across the whole body and exercising limbs there is a close-to-linear increase in Q̇O2 with V̇O2 such that:
| [Eqn. 2] |
where S denotes the slope and I the intercept of the relationship (determined as 5.3 L/L/min and 2.8 L/min respectively, for conventional cycling exercise, rev. 72,73). This relationship constrains O2 extraction (a-vO2 difference) to increase as a hyperbolic function of V̇O2:
| [Eqn. 3] |
Mathematically, the size of I in equation 2 will determine a-vO2 difference at rest/low V̇O2s and therefore how much it can increase subsequently as a function of V̇O2. Thus, despite the fact that muscles of very different fiber types and metabolic capacities increase Q̇ at the rate of 5–6 L/L/min, fast versus slow twitch muscles typically have a lower Q̇O2/V̇O2 ratio, extract more of the available O2 from the blood, and thus have a lower PmvO2 (8).
This between-fiber type difference in Q̇ (and Q̇O2 control) is dependent upon greater Type I muscle arteriolar endothelial sensitivity to vasodilators and reduced response to vasoconstrictors as well as less sympathetic vasoconstriction than their Type II counterparts (rev. 7,53). Given the profound impact of alterations in arterial O2 content on muscle(s) performance mentioned above one consequence of a lowered PmvO2 in Type II muscles is that blood-myocyte O2 flux will be impaired and intramyocyte PO2, at any given flux rate, will be lowered. Crucially, metabolic regulation, specifically the ΔADPfree and ΔNADH concentrations required to stimulate a given mitochondrial ATP production rate, will be increased at lowered intramyocyte PO2’s even in the absence of reduced V̇O2. These latter effects help explain the impact of inspired hypoxia on exercise tolerance even when cardiac output compensates so that muscle Q̇O2 (and V̇O2) is unchanged.
An unappreciated consequence of the lower PmvO2 in Type II muscles is that the NOS system (see “The Involvement of Neuronal Nitric Oxide Synthase…” section below), whilst still effective in these muscles, will be operating below its full potential. However, low PmvO2s (and low pH) facilitate the reduction of endogenous or exogenously-supplied nitrite (NO2-) to NO. This phenomenon helps explain the preferential efficacy of nitrate supplementation for increasing Q̇O2 to Type II muscles (31) raising PmvO2 (33) and also speeding V̇O2 kinetics and improving exercise tolerance at >CP/CS work rates (4).
Involvement of Neuronal Nitric Oxide Synthase (nNOS) as an NO Source Above Critical Speed
NO promotes the robust exercise Q̇ response in humans and animals and is synthesized enzymatically in healthy individuals via nNOS (type I) or endothelial NOS (eNOS; type III) (49,53). eNOS-derived NO production is secondary to vascular endothelial shear stress during exercise whereas nNOS is located in the intramyocyte space of rat Type II muscle fibers (and also Type I muscle fibers in humans, 34). nNOS is important for the sympatholysis mechanism that opposes α-2 mediated sympathetic vasoconstriction in contracting muscle(s) (83) and possibly via direct action on vascular smooth muscle via cyclic guanosine monophosphate. Complete NOS blockade by L-NAME (NG-nitro-L-arginine methyl ester, 30 mg/kg) versus selective (S-methyl-L-thiocitrulline, SMTC) nNOS inhibition during treadmill running in rats has revealed a major role for the NOS system as a whole during exercise (25). Specifically, eNOS preferentially increases Q̇ in Type I and II highly oxidative muscles at running speeds below CS. In contrast, for running speeds 15% above CS nNOS augments vascular conductance and Q̇ in muscles composed primarily of highly glycolytic Type IIb/d/x fibers (ref. 25, Fig. 4, Panel D). Diseases such as CHF may increase both the proportion of Type II muscle fibers and also reliance on those fibers during exercise (71). It is especially pertinent, therefore, that nNOS function is impaired in CHF patients (rev. 23) compromising exercise capacity where the activity recruits Type II muscles. This is especially true for the respiratory muscles (intercostals and diaphragm) where nNOS makes a substantial contribution to Q̇ during severe intensity exercise (25).
Mechanistic Bases for CP Sensitivity to Contraction Duration: Improved Microvascular O2 Transport
During rhythmic contractions muscle Q̇ is markedly pulsatile (rev. 13) as increased muscle pressure acts to occlude arterial inflow whilst providing the motive force to expel blood from the muscle and increase venous outflow. Combined with a rapid arteriolar vasodilation this mechanical pumping action initiates increased Q̇ and subsequent flow-mediated dilation (rev. 53). The frequency of contraction and the duty cycle itself determine not only the absolute Q̇ but also the Q̇/force relation. For instance, Hogan and colleagues (43) showed that increasing contraction frequency from 0.25 to 0.5 Hz doubled the contractile phase venous Q̇ such that the Q̇/force ratio increased ~60% in the dog gastrocnemius.
As CP/CS in a given individual is strongly dependent upon Q̇O2 (100, rev. 13,47; see section “The Role of Oxygen in Shaping the Power-Duration Curve” above) alterations in duty cycle have the capacity to change CP/CS. When Broxterman and colleagues (13) compared 20 and 50% duty cycles in a >CP iso-work rate handgrip protocol the shorter duty cycle elevated Q̇ and also the deoxy Hb+Mb concentration at intolerance such that V̇O2 was ~50% higher. CP itself increased ~30% in the absence of altered W,’ extending the tolerable duration of a fixed supra-CP work rate by ~150%. Given the astoundingly low CP in diseases such as CHF that cripple the O2 transport system these findings offer hope that therapeutic exercise interventions selecting judicious duty cycle paradigms may improve physiological function and quality of life by raising CP/CS.
Novel models of capillary function explain how higher Q̇s that presumably shorten capillary red blood cell transit time may actually increase muscle O2 diffusing capacity (DO2) and fractional O2 extraction. Specifically, elevating red blood cell velocity extends the capillary length over which O2 is offloaded raising muscle DO2 by “longitudinal recruitment” of capillary function (rev. 70). In agreement with this schema, when Broxterman et al. (14) applied the graphical Wagner analysis (80) to the increased peak V̇O2 they noted that the DO2 measured during the 20% duty cycle condition contributed ~3-fold more to the greater V̇O2 peak than did the rise in perfusive O2 conductance.
Conclusion
Work rates above CS preferentially recruit Q̇ to low oxidative Type II (fast twitch) muscles where the Q̇O2/V̇O2 ratio (and thus PmvO2) is lower than for Type I muscles. Q̇ to these Type II fibers is controlled substantially by nNOS-derived NO. As the Km for nNOS is high (i.e., ~350 μM O2) relative to the local O2 concentration (<10 μM), this helps explain the efficacy of nitrate/nitrite supplementation to elevate Q̇ and Q̇O2 to these muscles. It also accounts for the capacity of dietary nitrate to impact physiological control and exercise performance in the severe-intensity domain (i.e., >CP/CS). Finally, within a given individual, recent evidence supports that CP can be manipulated by contraction characteristics: shorter muscle contraction duty cycles facilitating greater perfusive (Q̇O2) and diffusive (DO2) O2 transport and thus V̇O2 and CP.
Unraveling the Power-duration Curvature Constant (W′) in Health and Disease
As discussed in the Introduction, the hyperbolic nature of the power-duration relationship is maintained across species, or exercise engaging single or multiple muscle groups. This implies that various mechanisms of exercise intolerance somehow interact and scale with the power (or force) demands of the task to retain the, now familiar, hyperbola (Figs. 1,3,5C, and ref. 29). While, in any form of exercise, CP likely reflects the limit of force or power demands that result in the progressive accumulation of fatigue during >CP exercise (15,16,18,48), it is the W′ parameter that provides us the clearest insight into the dynamics of the mechanisms that cause fatigue and its progression to eventual intolerance.
Figure 5.

The asymptote (critical power, CP; panel A) and curvature constant (W′, panel B) of the power-duration relationship during cycling in young (mean age 23±3 yrs), older trained (65±5 yrs), older untrained (63±3 yrs), chronic heart failure (CHF, 67±7 yrs), and chronic obstructive pulmonary disease (COPD, 62±8 yrs) in relation to aerobic capacity (peak V̇O2). Young and COPD data are from van der Vaart et al. (96). Older and CHF data are from Mezzani et al. (56). Panel C shows differences in the power-duration curves derived from group mean parameters across a wide range of aerobic capacity (10–70 ml.min−1.kg−1)
W′ is the mathematical consequence of the tolerable duration of exercise and CP. When the power-duration curve is measured, W′ has units of work, and thus only a small jump of logic is required to extrapolate this “amount of work” to a biological equivalent of stored energy. The early work of Monod and Scherrer (61) implied that this stored energy was of non-oxidative origin: a proposal recently supported by Broxterman et al. (12,14) using occluded handgrip exercise. Intramuscular energy stores such as muscle glycogen and PCr are obvious targets, and indeed the cycle-ergometry W′ is increased following creatine supplementation (58,c.f., 101) and decreased following glycogen depletion (59). Using 31P magnetic resonance spectroscopy, Vanhatalo et al. (100) showed that intramuscular PCr concentration reached consistently near-complete depletion during single-leg knee-extension exercise in normoxia and hyperoxia, adding weight to the fact that W′ may indeed represent an intramuscular source of stored high-energy phosphates. It has also been proffered that should W′ be found to relate to a store of high-energy phosphates, then it could, just as reasonably, relate to the consequences of high-rates of PCr metabolism (20,21,35). Therefore W′ may also represent a muscular accumulation of metabolites argued to be integrally associated with muscle fatigue, for example Pi, ADP or H+ (1) (though see Fitts/Westerblad debate in this series as regards H+ and fatigue).
Others investigated the source of W′ using repeated exercise to intolerance with a range of recovery durations (~1–15 min) to initially accumulate an amount of work equal to W′ and then determine the dynamics of its recovery, and found contrasting evidence to the intramuscular energy store hypothesis (30,88). These studies suggested that W′ recovery following intolerance has a half-time of ~5 minutes, and that its recovery dynamics are slower than those of PCr. Nor indeed, did W′ recovery kinetics relate well to the restitution of V̇O2 or blood lactate to baseline. That the kinetics of W′ recovery following intolerance were similar in cycle ergometry (30) and single leg knee extension exercise (88) suggested a conserved mechanism of exercise limitation across these disparate modes, but one that could not be simply reconciled with an obvious intramuscular source of stored energy.
So, why the disparity? Searching for a physiological equivalent of W′ is often approached as a cryptographic problem: a search for a singular solution to break the code of “what is W′”? However, because the power-duration hyperbola is retained across exercise modes that vary in engaged muscle mass, naturally, the nature of W′ cannot be a limited to a singular physiological process. It is axiomatic that exercise in whole-body exercise (cycling, running swimming etc.) is subject to different limiting mechanisms than, for example, a contraction of the first dorsal interosius muscle (a common model for investigation of neuromuscular fatigue). Various central and peripheral mechanisms must shape the power-duration curve depending on the mode and conditions of the exercise and participant. Therefore, it is likely an oversimplification to assume, for example, that W′ reflects a cytosolic depletion of PCr or accumulation of Pi or H+. Broxterman et al. (15) directly addressed this issue using rhythmic handgrip exercise and surface electrical stimulation of the flexor digitorum superficialis superimposed on the MVC to assess the contributions of central and peripheral fatigue to exercise intolerance. They found a significant inverse correlation between both the decline in MVC and peripheral fatigue (the decline in potentiated doublet twitch force) and W′. It makes intuitive sense that an isolated exercise task using a small muscle mass, such as handgrip exercise, that does not challenge the limits of the cardiovascular or pulmonary systems, should be predominately limited by peripheral fatigue and the consequences of peripheral fatigue on central motor drive and/or muscle activation. So, what then of the correlates of W′ in whole-body exercise, where the balance amongst cardiopulmonary and neuromuscular strain differs?
The mechanism defining W′ in large muscle mass exercise is complex and elusive. Determination of central and peripheral contributions to fatigue in whole-body exercise requires a combination of measurements of maximal evocable power and the response to evoked potentials immediately at intolerance, and current experimental designs to achieve this are lacking at present. Recently, Coelho et al. (22) have proposed a method by which muscle fatigue may be identified instantaneously during cycle ergometry by means of interleaved maximal-effort isokinetic cycling tasks. Using indices of central and peripheral fatigue, these data show that the relative contribution of different fatigue loci at the limit of tolerance of a standardized cycling task are highly variable among participants, and unsurprisingly, V̇O2max was the best (inverse) correlate of the magnitude of fatigue at the instant of intolerance.
The task-specific nature of W′ was well-exposed in the work of Valli et al. (95), who investigated power-duration parameters in cycling, during and after ascent to the Italian National Research Council Pyramid Laboratory, Lobuche, Khumbu, Nepal located at an altitude of 5,050 m. Repeated constant power cycle ergometer exercise tests to intolerance at sea level and high altitude revealed that high-altitude depressed CP by 35%: unsurprising considering the dependence of CP on O2 delivery and utilization (see “The Role of Oxygen in Shaping the Power-Duration Curve” above). The unexpected finding was that W′ decreased at high-altitude, by an average of 45%. This reduction in W′ was at odds with the expected effects of exposure to acute hypoxia at sea level (62,104), although more recent studies have corroborated this finding (85). Valli et al. (95) point out that oxygen stores (predominantly in the form of muscle venous O2 concentration) are typically notionally lumped within the proposed volume of anaerobic energy stores represented by W′, because they are not measured by pulmonary gas exchange. Therefore W′ may be reduced at altitude because of a reduced capacity of ‘anaerobic’ sources of stored energy. Resting intramuscular concentrations of PCr, Pi and H+ are unaffected by acute hypoxic exposure (although acclimation to high-altitude may influence blood and muscle buffering and therefore pH) and are depleted/accumulated to a similar magnitude as during exercise at sea level (97), meaning that these are an unlikely sources for the difference in W′ observed on ascent to altitude. On the contrary, reduced W′ at altitude is likely the result of a reduced ability to engage a large-muscle mass in the exercise, and/or the influence of dyspnea on central motor drive and/or muscle activation, among others.
There is a significant correlation between W′ for cycle ergometry and thigh circumference (57), emphasizing that a large W′ demands a large muscle mass to be engaged in the task before the point of task failure (and therefore access to large pool of energy stores). In addition, altitude-related modulation of Group III/IV muscle afferent discharge may increase spinal inhibition of cortical motor outflow and limit the available muscle mass (27). However, as expected, the hypoxic stimulus of exercise at altitude increased ventilation and dyspnea during cycle ergometry in the study of Valli et al (95). The interesting feature of this observation is that breathing reserve was reduced close to zero, suggestive of a large increase in respiratory muscle work and activity of pulmonary stretch receptors, each mechanism potentially contributing to the sense of dyspnea and to limiting cortical excitability or motor outflow. Therefore, the low W′ during whole-body exercise at high-altitude, assessed from the altered curvature of the power-duration hyperbola, could be thought of as representing a ‘limitation of access’ to the sea-level W′. However, this view suggests that the normoxic cycle-ergometry W′ represents purely a local muscle limitation, which is unlikely given the systemic-integrative mechanisms limiting whole-body exercise performance. Thus, while W′ may be closely related to a limitation of intramuscular metabolism in small muscle mass exercise, and also during large muscle mass exercise in some participants (expected to be sedentary individuals in whom peripheral exercise limitations predominate, 80), the source of W′ can be modulated by altering, for example, the environmental conditions. To put it another way, the question of what determines W′ is the question of what determines exercise intolerance itself, and will depend on the mode and conditions of the exercise and the participants involved.
Changes to the Power-Duration Relationship in Healthy Aging and Chronic Disease
Both CP and W′ are reduced in aging and in chronic disease (54,56,65,66,78,96). Given, the limitations to oxygen transport in CHF or COPD, it is not surprising that CP is compromised in these conditions. The reduction in CP in CHF and COPD is closely associated with the reduction in V̇O2max (Fig. 5A), again emphasizing the central role of oxidative metabolism in determining CP. Interestingly, however, W′ is also dramatically reduced in chronic disease (Fig. 5B). As discussed above, W′ has been considered to be independent of oxidative metabolism (e.g. 12). Indeed, in healthy young subjects cycling V̇O2max and W′ do not correlate at the group level (r2=0.01; ref. 96). As presented in “The Role of Oxygen in Shaping the Power-Duration Curve” above, some interventional studies have revealed a relationship between change in V̇O2max and change in W′ within the same subjects during whole-body exercise (85,95), consistent with the proposal that W′ is not a simple proxy of some (intramuscular) energy store limitation. When a wide range of human aerobic function is considered (from 10–70 mL.min−1.kg−1) a relationship emerges between V̇O2max and W′ (Fig. 5B): although note the >twofold range of W′ for V̇O2max values 40–60 mL.min−1.kg−1. In fact, the age or disease-associated decline in W′ parallels closely the decline in CP (r2=0.59, n=112, p<0.05). The muscle mass atrophy of aging and/or the increase in Type I fiber expression (which have intrinsically lower PCr concentrations) may underlie the reduction in cycling W′ in the elderly. However, while muscle mass is also reduced (compared to age-matched controls) in CHF and COPD, the degree of muscle loss is small in comparison to the reduction in W′ (W′ is reduced in CHF and COPD by ~30–50% compared to age-matched controls and ~70% compared to young participants). Therefore, other mechanisms are presumably at work to limit W′ in these chronic diseases. In health, the cycling W′ is predominantly shaped by the rate of attainment of V̇O2max (17). The reduction of V̇O2max in CHF, which contributes to determining the range of the severe intensity domain, may reflect in part the reduction in W′. That said, in CHF CP occurs at a similar fraction of V̇O2max as seen in their healthy counterparts (56). Therefore, the mechanistic basis for the low W′ in CHF may well be more closely related to central mechanisms limiting muscle activity. However, these notions have yet to be corroborated. In COPD, the attainment of maximum voluntary ventilation (or some other index of ventilatory limitation, such as low inspiratory reserve volume) closely associates with exercise limitation and the shaping of W′ (65), although this may be a proxy of the increased work of breathing and/or dyspnea. Interestingly, spinal anesthesia to block Group III/IV afferents in COPD resulted in a significantly reduced ventilation and a prolongation of exercise tolerance (37), presumably mediated, at least in part, via increased W′. Therefore, particularly in whole-body exercise in these patients, W′ reflects the development of both central and peripheral mechanisms of fatigue.
Conclusion
W′ might be best conceptualized as the ‘buffer’ available to resist exercise intolerance during supra-CP exercise, where the source of the buffer will vary dependent on the conditions. The lower the buffer the more rapidly intolerance will occur, and the more ‘fatigable’ the individual will appear. As, CP and W′ decline approximately in parallel across age and chronic disease, pushing the power-duration curve down towards the origin (Fig. 5C), this buffer is often, but not always (see ref. 12 as presented in “The Role of Oxygen in Shaping the Power-Duration Curve”), reduced in conditions limiting O2 transport and utilization. Given that CP has previously been termed a ‘fatigue threshold’, a fitting term considering that CP demarks the limit for fatigue progression, W′ might therefore be considered as a ‘fatigability constant’.
Overall Conclusions
The power-duration relationship constitutes a powerful framework within which to explore and understand the physiological/pathophysiological mechanisms of fatigue across the lifespan in healthy individuals and patient (e.g., CHF, COPD) populations. Moreover, it facilitates prediction and explanation of the effects of environmental challenges (e.g., hypoxia of high altitude, hyperthermic conditions) on exercise tolerance and evaluates accurately the effects of therapeutic countermeasures (e.g., training and nutritional, pharmacological or device therapies). CP is a threshold of oxidative metabolism that determines the upper bounds for progressive neuromuscular fatigue during isotonic and isometric exercise i.e., CP is a ‘fatigue threshold’. The other parameter of the power-duration relationship, W′, provides a crucial window into the process(es) limiting exercise tolerance >CP, which may be intramuscular (more prevalent in e.g., small muscle mass exercise) or neurogenic (more prevalent in e.g., CHF or COPD) in origin i.e. W′ may be considered a ‘fatigability constant’. Both CP and W′ are sensitive to O2 delivery with exercise above CP characterized by the recruitment of low oxidative Type II fibers and nNOS-controlled increases of blood flow. These muscles/fibers operate in a markedly lower PO2 environment than their Type I counterparts which facilitates NO2− reduction to NO identifying them as a target for dietary NO3− and NO2− supplementation and helping explain the resultant improvements in severe-intensity exercise tolerance.
The power-duration concept describes and predicts exercise performance with startling precision. CP alone, or in conjunction with W′, can be used to appraise whether or not a particular athletic feat for example, human powered flight (12,47) or a sub-2 hour marathon (89) or functional activity (for example, an older person or patient walking continuously for a given distance) is feasible. These parameters can also be used to model optimal performance tactics in situations where a group of athletes in a team has different CP and W′ values (for example, rowing or cycling races; 63), or assess the response to therapeutic interventions (56,96). For these reasons, the power-duration relationship may be considered critical for understanding the limitations to human performance and the fatigue processes that underpin them.
Acknowledgments
The authors would like to acknowledge thank Drs. Timothy I. Musch, Steven W. Copp, Daniel M. Hirai, Scott K. Ferguson, Clark T. Holdsworth and Mr. Jesse C. Craig for their contributions to this work. These experiments were funded, in part, by grants from the American Heart Association Midwest Affiliate (10GRNT4350011) and NIH (HL-108328) awards to DCP. The positions presented in this review do not constitute endorsement by ACSM.
References
- 1.Allen DG, Lamb GD, Westerblad H. Skeletal muscle fatigue: cellular mechanisms. Physiol Rev. 2008;88:287–332. doi: 10.1152/physrev.00015.2007. [DOI] [PubMed] [Google Scholar]
- 2.Amann M, Romer LM, Pegelow DF, Jacques AJ, Hess CJ, Dempsey JA. Effects of arterial oxygen content on peripheral locomotor muscle fatigue. J Appl Physiol. 2006;101:119–27. doi: 10.1152/japplphysiol.01596.2005. [DOI] [PubMed] [Google Scholar]
- 3.Bailey SJ, Vanhatalo A, DiMenna FJ, Wilkerson DP, Jones AM. Fast-start strategy improves VO2 kinetics and high-intensity exercise performance. Med Sci Sports Exerc. 2011;43:457–467. doi: 10.1249/MSS.0b013e3181ef3dce. [DOI] [PubMed] [Google Scholar]
- 4.Bailey SJ, Varnham RL, DiMenna FJ, Breese BC, Wylie LJ, Jones AM. Inorganic nitrate supplementation improves muscle oxygenation, O2 uptake kinetics, and exercise tolerance at high but not low pedal rates. J Appl Physiol. 2015;118:1396–405. doi: 10.1152/japplphysiol.01141.2014. [DOI] [PubMed] [Google Scholar]
- 5.Ball-Burnett M, Green HJ, Houston ME. Energy metabolism in human slow and fast twitch fibres during prolonged cycle exercise. J Physiol. 1991;437:257–267. doi: 10.1113/jphysiol.1991.sp018594. [DOI] [PMC free article] [PubMed] [Google Scholar]
- 6.Barker T, Poole DC, Noble ML, Barstow TJ. Human critical power-oxygen uptake relationship at different pedalling rates. Exp Physiol. 2006;91:621–632. doi: 10.1113/expphysiol.2005.032789. [DOI] [PubMed] [Google Scholar]
- 7.Behnke BJ, Armstrong RB, Delp MD. Adrenergic control of vascular resistance varies in muscles composed of different fiber types: influence of the vascular endothelium. Am J Physiol Regul Integr Comp Physiol. 2011;301:R783–90. doi: 10.1152/ajpregu.00205.2011. [DOI] [PMC free article] [PubMed] [Google Scholar]
- 8.Behnke BJ, McDonough P, Padilla DJ, Musch TI, Poole DC. Oxygen exchange profile in rat muscles of contrasting fibre types. J Physiol. 2003;549:597–605. doi: 10.1113/jphysiol.2002.035915. [DOI] [PMC free article] [PubMed] [Google Scholar]
- 9.Bellmere F, Grasino A. Effect of pressure and timing of contraction on human diaphragm fatigue. J Appl Physiol. 1982;53:1190–1195. doi: 10.1152/jappl.1982.53.5.1190. [DOI] [PubMed] [Google Scholar]
- 10.Bigland-Ritchie B, Furbush F, Woods JJ. Fatigue of intermittent submaximal voluntary contractions: central and peripheral factors. J Appl Physiol. 1986;61:421–429. doi: 10.1152/jappl.1986.61.2.421. [DOI] [PubMed] [Google Scholar]
- 11.Black MI, Jones AM, Bailey SJ, Vanhatalo A. Self-pacing increases critical power and improves performance during severe-intensity exercise. Appl Physiol Nutr Metab. 2015;40:662–70. doi: 10.1139/apnm-2014-0442. [DOI] [PubMed] [Google Scholar]
- 12.Broxterman RM, Ade CJ, Craig JC, Wilcox SL, Schlup SJ, Barstow TJ. Influence of blood flow occlusion on muscle oxygenation characteristics and the parameters of the power-duration relationship. J Appl Physiol. 2015;118:880–9. doi: 10.1152/japplphysiol.00875.2014. [DOI] [PubMed] [Google Scholar]
- 13.Broxterman RM, Ade CJ, Wilcox SL, Schlup SJ, Craig JC, Barstow TJ. Influence of duty cycle on the power-duration relationship: observations and potential mechanisms. Respir Physiol Neurobiol. 2014;192:102–11. doi: 10.1016/j.resp.2013.11.010. [DOI] [PubMed] [Google Scholar]
- 14.Broxterman RM, Craig JC, Ade CJ, Wilcox SL, Barstow TJ. The effect of resting blood flow occlusion on exercise tolerance and W′. Am J Physiol Regul Integr Comp Physiol. 2015;309:R684–91. doi: 10.1152/ajpregu.00283.2015. [DOI] [PMC free article] [PubMed] [Google Scholar]
- 15.Broxterman RM, Craig JC, Smith JR, et al. Influence of blood flow occlusion on the development of peripheral and central fatigue during small muscle mass handgrip exercise. J Physiol. 2015;593:4043–54. doi: 10.1113/JP270424. [DOI] [PMC free article] [PubMed] [Google Scholar]
- 16.Burnley M. Estimation of critical torque using intermittent isometric maximal voluntary contractions of the quadriceps in humans. J Appl Physiol. 2009;106:975–83. doi: 10.1152/japplphysiol.91474.2008. [DOI] [PubMed] [Google Scholar]
- 17.Burnley M, Jones AM. Oxygen uptake kinetics as a determinant of sports performance. Eur Journal Sports Sci. 2007;7:63–79. [Google Scholar]
- 18.Burnley M, Vanhatalo A, Jones AM. Distinct profiles of neuromuscular fatigue during muscle contractions below and above the critical torque in humans. J Appl Physiol. 2012;113:215–23. doi: 10.1152/japplphysiol.00022.2012. [DOI] [PubMed] [Google Scholar]
- 19.Cannon DT, White AC, Andriano MF, Kolkhorst FW, Rossiter HB. Skeletal muscle fatigue precedes the slow component of oxygen uptake kinetics during exercise in humans. J Physiol. 2011;589:727–39. doi: 10.1113/jphysiol.2010.197723. [DOI] [PMC free article] [PubMed] [Google Scholar]
- 20.Chidnok W, Fulford J, Bailey SJ, et al. Muscle metabolic determinants of exercise tolerance following exhaustion: Relationship to the “critical power”. J Appl Physiol. 2013;115:243–50. doi: 10.1152/japplphysiol.00334.2013. [DOI] [PubMed] [Google Scholar]
- 21.Coats EM, Rossiter HB, Day JR, Miura A, Fukuba Y, Whipp BJ. Intensity-dependent tolerance to exercise after attaining V̇O2max in humans. J Appl Physiol. 2003;95:483–90. doi: 10.1152/japplphysiol.01142.2002. [DOI] [PubMed] [Google Scholar]
- 22.Coelho AC, Cannon DT, Cao R, et al. Instantaneous quantification of skeletal muscle activation, power production, and fatigue during cycle ergometry. J Appl Physiol. 2015;118:646–54. doi: 10.1152/japplphysiol.00948.2014. [DOI] [PubMed] [Google Scholar]
- 23.Copp SW, Hirai DM, Ferguson SK, Holdsworth CT, Musch TI, Poole DC. Effects of chronic heart failure on neuronal nitric oxide synthase-mediated control of microvascular O2 pressure in contracting rat skeletal muscle. J Physiol. 2012;590:3585–96. doi: 10.1113/jphysiol.2012.235929. [DOI] [PMC free article] [PubMed] [Google Scholar]
- 24.Copp SW, Hirai DM, Musch TI, Poole DC. Critical speed in the rat: implications for hindlimb muscle blood flow distribution and fibre recruitment. J Physiol. 2010;588:5077–87. doi: 10.1113/jphysiol.2010.198382. [DOI] [PMC free article] [PubMed] [Google Scholar]
- 25.Copp SW, Holdsworth CT, Ferguson SK, Hirai DM, Poole DC, Musch TI. Muscle fibre-type dependence of neuronal nitric oxide synthase-mediated vascular control in the rat during high speed treadmill running. J Physiol. 2013;591:2885–96. doi: 10.1113/jphysiol.2013.251082. [DOI] [PMC free article] [PubMed] [Google Scholar]
- 26.Dekerle J, Mucci P, Carter H. Influence of moderate hypoxia on tolerance to high-intensity exercise. Eur J Appl Physiol. 2012;112:327–35. doi: 10.1007/s00421-011-1979-z. [DOI] [PubMed] [Google Scholar]
- 27.Dempsey JA. New perspectives concerning feedback influences on cardiorespiratory control during rhythmic exercise and on exercise performance. J Physiol. 2012;590:4129–44. doi: 10.1113/jphysiol.2012.233908. [DOI] [PMC free article] [PubMed] [Google Scholar]
- 28.De Ruiter CJ, Mallee MI, Leloup LE, de Haan A. A submaximal test for the assessment of knee extensor endurance capacity. Med Sci Sports Exerc. 2014;46:398–406. doi: 10.1249/MSS.0b013e3182a59c9c. [DOI] [PubMed] [Google Scholar]
- 29.Enoka RM, Stuart DG. Neurobiology of muscle fatigue. J Appl Physiol. 1992;72:1631–48. doi: 10.1152/jappl.1992.72.5.1631. [DOI] [PubMed] [Google Scholar]
- 30.Ferguson C, Rossiter HB, Whipp BJ, Cathcart AJ, Murgatroyd SR, Ward SA. Effects of recovery duration from prior exhaustive exercise on the parameters of the power-duration relationship. J Appl Physiol. 2010;108:866–74. doi: 10.1152/japplphysiol.91425.2008. [DOI] [PubMed] [Google Scholar]
- 31.Ferguson SK, Hirai DM, Copp SW, et al. Impact of dietary nitrate supplementation via beetroot juice on exercising muscle vascular control in rats. J Physiol. 2013;591:547–57. doi: 10.1113/jphysiol.2012.243121. [DOI] [PMC free article] [PubMed] [Google Scholar]
- 32.Ferguson SK, Holdsworth CT, Wright JL, et al. Microvascular oxygen pressures in muscles comprised of different fiber types: Impact of dietary nitrate supplementation. Nitric Oxide. 2015;48:38–43. doi: 10.1016/j.niox.2014.09.157. [DOI] [PMC free article] [PubMed] [Google Scholar]
- 33.Ferreira LF, Padilla DJ, Musch TI, Poole DC. Temporal profile of rat skeletal muscle capillary haemodynamics during recovery from contractions. J Physiol. 2006;573:787–97. doi: 10.1113/jphysiol.2006.104802. [DOI] [PMC free article] [PubMed] [Google Scholar]
- 34.Frandsen U, Lopez-Figueroa M, Hellsten Y. Localization of nitric oxide synthase in human skeletal muscle. Biochem Biophys Res Commun. 1996;227:88–93. doi: 10.1006/bbrc.1996.1472. [DOI] [PubMed] [Google Scholar]
- 35.Fukuba Y, Miura A, Endo M, Kan A, Yanagawa K, Whipp BJ. The curvature constant parameter of the power-duration curve for varied-power exercise. Med Sci Sports Exerc. 2003;35:1413–18. doi: 10.1249/01.MSS.0000079047.84364.70. [DOI] [PubMed] [Google Scholar]
- 36.Gaesser GA, Wilson LA. Effects of continuous and interval training on the parameters of the power-endurance time relationship for high-intensity exercise. Int J Sports Med. 1988;9:417–21. doi: 10.1055/s-2007-1025043. [DOI] [PubMed] [Google Scholar]
- 37.Gagnon P, Bussières JS, Ribeiro F, et al. Influences of spinal anesthesia on exercise tolerance in patients with chronic obstructive pulmonary disease. Am J Respir Crit Care Med. 2012;186:606–15. doi: 10.1164/rccm.201203-0404OC. [DOI] [PubMed] [Google Scholar]
- 38.Grassi B, Rossiter HB, Zoladz JA. Skeletal muscle fatigue and decreased efficiency: two sides of the same coin? Exerc Sport Sci Rev. 2015;43:75–83. doi: 10.1249/JES.0000000000000043. [DOI] [PubMed] [Google Scholar]
- 39.Hagberg M. Muscular endurance and surface electromyogram in isometric and dynamic exercise. J Appl Physiol. 1981;51:1–7. doi: 10.1152/jappl.1981.51.1.1. [DOI] [PubMed] [Google Scholar]
- 40.Haseler LJ, Kindig CA, Richardson RS, Hogan MC. The role of oxygen in determining phosphocreatine onset kinetics in exercising humans. J Physiol. 2004;558:985–92. doi: 10.1113/jphysiol.2004.062042. [DOI] [PMC free article] [PubMed] [Google Scholar]
- 41.Heinonen I, Koga S, Kalliokoski KK, Musch TI, Poole DC. Heterogeneity of muscle blood flow and metabolism: Influence of exercise, aging, and disease states. Exerc Sport Sci Rev. 2015;43:117–24. doi: 10.1249/JES.0000000000000044. [DOI] [PMC free article] [PubMed] [Google Scholar]
- 42.Hill AV. The physiological basis of athletic records. Nature. 1925;116:544–8. [Google Scholar]
- 43.Hogan MC, Grassi B, Samaja M, Stary CM, Gladden LB. Effect of contraction frequency on the contractile and noncontractile phases of muscle venous blood flow. J Appl Physiol. 2003;95:1139–44. doi: 10.1152/japplphysiol.00226.2003. [DOI] [PubMed] [Google Scholar]
- 44.Hogan MC, Richardson RS, Haseler LJ. Human muscle performance and PCr hydrolysis with varied inspired oxygen fractions: a 31P-MRS study. J Appl Physiol. 1999;86:1367–73. doi: 10.1152/jappl.1999.86.4.1367. [DOI] [PubMed] [Google Scholar]
- 45.Johnson KVB, Edwards SC, Van Tongeran C, Bawa P. Properties of human motor units after prolonged activity at a constant firing rate. Exp Brain Res. 2004;154:479–87. doi: 10.1007/s00221-003-1678-z. [DOI] [PubMed] [Google Scholar]
- 46.Johnson MA, Polgar J, Weightman D, Appleton D. Data on the distribution of fibre types in thirty-six human muscles. An autopsy study. J Neurol Sci. 1973;18:111–29. doi: 10.1016/0022-510x(73)90023-3. [DOI] [PubMed] [Google Scholar]
- 47.Jones AM, Vanhatalo A, Burnley M, Morton RH, Poole DC. Critical power: implications for determination of V̇O2max and exercise tolerance. Med Sci Sports Exerc. 2010;42:1876–90. doi: 10.1249/MSS.0b013e3181d9cf7f. [DOI] [PubMed] [Google Scholar]
- 48.Jones AM, Wilkerson DP, DiMenna F, Fulford J, Poole DC. Muscle metabolic responses to exercise above and below the “critical power” assessed using 31P-MRS. Am J Physiol Regul Integr Comp Physiol. 2008;294:R585–R93. doi: 10.1152/ajpregu.00731.2007. [DOI] [PubMed] [Google Scholar]
- 49.Joyner MJ, Casey DP. Regulation of increased blood flow (hyperemia) to muscles during exercise: a hierarchy of competing physiological needs. Physiol Rev. 2015;95:549–601. doi: 10.1152/physrev.00035.2013. [DOI] [PMC free article] [PubMed] [Google Scholar]
- 50.Juel C, Pilegaard H, Nielsen JJ, Bangsbo J. Interstitial K+ in human skeletal muscle during and after dynamic graded exercise determined by microdialysis. Am J Physiol Regul Integr Comp Physiol. 2000;278:R400–6. doi: 10.1152/ajpregu.2000.278.2.R400. [DOI] [PubMed] [Google Scholar]
- 51.Koga S, Barstow TJ, Okushima D, et al. Validation of a high-power, time-resolved, near-infrared spectroscopy system for measurement of superficial and deep muscle deoxygenation during exercise. J Appl Physiol. 2015;118:1435–42. doi: 10.1152/japplphysiol.01003.2014. [DOI] [PubMed] [Google Scholar]
- 52.Koga S, Rossiter HB, Heinonen I, Musch TI, Poole DC. Dynamic heterogeneity of exercising muscle blood flow and O2 utilization. Med Sci Sports Exerc. 2014;46:860–76. doi: 10.1249/MSS.0000000000000178. [DOI] [PubMed] [Google Scholar]
- 53.Laughlin MH, Davis MJ, Secher NH, et al. Peripheral circulation. Compr Physiol. 2012;2:321–447. doi: 10.1002/cphy.c100048. [DOI] [PubMed] [Google Scholar]
- 54.Malaguti C, Nery LE, Dal Corso S, et al. Alternative strategies for exercise critical power estimation in patients with COPD. Eur J Appl Physiol. 2006;96:59–65. doi: 10.1007/s00421-005-0064-x. [DOI] [PubMed] [Google Scholar]
- 55.McNeil CJ, Giesebrecht S, Gandevia SC, Taylor JL. Behaviour of the motoneurone pool in a fatiguing submaximal contraction. J Physiol. 2011;589:3533–44. doi: 10.1113/jphysiol.2011.207191. [DOI] [PMC free article] [PubMed] [Google Scholar]
- 56.Mezzani A, Corrà U, Giordano A, Colombo S, Psaroudaki M, Giannuzzi P. Upper intensity limit for prolonged aerobic exercise in chronic heart failure. Med Sci Sports Exerc. 2010;42:633–9. doi: 10.1249/MSS.0b013e3181bdc69d. [DOI] [PubMed] [Google Scholar]
- 57.Miura A, Endo M, Sato H, Sato H, Barstow TJ, Fukuba Y. Relationship between the curvature constant parameter of the power–duration curve and muscle cross-sectional area of the thigh for cycle ergometry in humans. Eur J Appl Physiol. 2002;87:238–44. doi: 10.1007/s00421-002-0623-3. [DOI] [PubMed] [Google Scholar]
- 58.Miura A, Kino F, Kajitani S, Sato H, Fukuba Y. The effect of oral creatine supplementation on the curvature constant parameter of the power-duration curve for cycle ergometry in humans. Jpn J Physiol. 1999;49:169–74. doi: 10.2170/jjphysiol.49.169. [DOI] [PubMed] [Google Scholar]
- 59.Miura A, Sato H, Sato H, Whipp BJ, Fukuba Y. The effect of glycogen depletion on the curvature constant parameter of the power-duration curve for cycle ergometry. Ergonomics. 2000;43:133–41. doi: 10.1080/001401300184693. [DOI] [PubMed] [Google Scholar]
- 60.Molbech S, Johansen SH. Endurance time in static work during partial curarization. J Appl Physiol. 1969;27:44–8. doi: 10.1152/jappl.1969.27.1.44. [DOI] [PubMed] [Google Scholar]
- 61.Monod H, Scherrer J. The work capacity of a synergic muscular group. Ergonomics. 1965;8:329–338. [Google Scholar]
- 62.Moritani T, Nagata A, deVries HA, Muro M. Critical power as a measure of physical work capacity and anaerobic threshold. Ergonomics. 1981;24:339–50. doi: 10.1080/00140138108924856. [DOI] [PubMed] [Google Scholar]
- 63.Morton RH. Isoperformance curves: an application in team selection. J Sports Sci. 2009;27:1601–5. doi: 10.1080/02640410903352915. [DOI] [PubMed] [Google Scholar]
- 64.Murgatroyd SR, Ferguson C, Ward SA, Whipp BJ, Rossiter HB. Pulmonary O2 uptake kinetics as a determinant of high-intensity exercise tolerance in humans. J Appl Physiol. 2011;110:1598–606. doi: 10.1152/japplphysiol.01092.2010. [DOI] [PubMed] [Google Scholar]
- 65.Neder JA, Jones PW, Nery LE, Whipp BJ. Determinants of the exercise endurance capacity in patients with chronic obstructive pulmonary disease. The power-duration relationship. Am J Respir Crit Care Med. 2000;162:497–504. doi: 10.1164/ajrccm.162.2.9907122. [DOI] [PubMed] [Google Scholar]
- 66.Neder JA, Jones PW, Nery LE, Whipp BJ. The effect of age on the power/duration relationship and the intensity-domain limits in sedentary men. Eur J Appl Physiol. 2000;82:326–332. doi: 10.1007/s004210000228. 2000b. [DOI] [PubMed] [Google Scholar]
- 67.Ørtenblad N, Westerblad H, Nielsen J. Muscle glycogen stores and fatigue. J Physiol. 2013;591:4405–13. doi: 10.1113/jphysiol.2013.251629. [DOI] [PMC free article] [PubMed] [Google Scholar]
- 68.Pethick J, Winter SL, Burnley M. Fatigue reduces the complexity of knee extensor torque fluctuations during maximal and submaximal intermittent isometric contractions in man. J Physiol. 2015;593:2085–96. doi: 10.1113/jphysiol.2015.284380. [DOI] [PMC free article] [PubMed] [Google Scholar]
- 69.Place N, Bruton JD, Westerblad H. Mechanisms of fatigue induced by isometric contractions in exercising humans and in mouse isolated single muscle fibres. Clin Exp Pharm Physiol. 2009;36:334–339. doi: 10.1111/j.1440-1681.2008.05021.x. [DOI] [PubMed] [Google Scholar]
- 70.Poole DC, Copp SW, Ferguson SK, Musch TI. Skeletal muscle capillary function: contemporary observations and novel hypotheses. Exp Physiol. 2013;98:1645–58. doi: 10.1113/expphysiol.2013.073874. [DOI] [PMC free article] [PubMed] [Google Scholar]
- 71.Poole DC, Hirai DM, Copp SW, Musch TI. Muscle oxygen transport and utilization in heart failure: implications for exercise (in)tolerance. Am J Physiol Heart Circ Physiol. 2012;302:H1050–63. doi: 10.1152/ajpheart.00943.2011. [DOI] [PMC free article] [PubMed] [Google Scholar]
- 72.Poole DC, Jones AM. Oxygen uptake kinetics. Compr Physiol. 2012;2:1–64. doi: 10.1002/cphy.c100072. [DOI] [PubMed] [Google Scholar]
- 73.Poole DC, Richardson RS. Determinants of oxygen uptake. Implications for exercise testing. Sports Med. 1997;24:308–20. doi: 10.2165/00007256-199724050-00003. [DOI] [PubMed] [Google Scholar]
- 74.Poole DC, Schaffartzik W, Knight DR, et al. Contribution of exercising legs to the slow component of oxygen uptake kinetics in humans. J Appl Physiol. 1991;71:1245–60. doi: 10.1152/jappl.1991.71.4.1245. [DOI] [PubMed] [Google Scholar]
- 75.Poole DC, Sexton WL, Behnke BJ, Ferguson CS, Hageman KS, Musch TI. Respiratory muscle blood flows during physiological and chemical hyperpnea in the rat. J Appl Physiol. 2000;88:186–94. doi: 10.1152/jappl.2000.88.1.186. [DOI] [PubMed] [Google Scholar]
- 76.Poole DC, Ward SA, Gardner GW, Whipp BJ. Metabolic and respiratory profile of the upper limit for prolonged exercise in man. Ergonomics. 1988;31:1265–79. doi: 10.1080/00140138808966766. [DOI] [PubMed] [Google Scholar]
- 77.Pringle JS, Jones AM. Maximal lactate steady state, critical power and EMG during cycling. Eur J Appl Physiol. 2002;88:214–26. doi: 10.1007/s00421-002-0703-4. [DOI] [PubMed] [Google Scholar]
- 78.Puente-Maestu L, SantaCruz A, Vargas T, Martínez-Abad Y, Whipp BJ. Effects of training on the tolerance to high-intensity exercise in patients with severe COPD. Respiration. 2003;70:367–70. doi: 10.1159/000072899. [DOI] [PubMed] [Google Scholar]
- 79.Richardson RS, Noyszewski EA, Leigh JS, Wagner PD. Lactate efflux from exercising human skeletal muscle: role of intracellular PO2. J Appl Physiol. 1998;85:627–34. doi: 10.1152/jappl.1998.85.2.627. [DOI] [PubMed] [Google Scholar]
- 80.Roca J, Agusti AG, Alonso A, et al. Effects of training on muscle O2 transport at V̇O2max. J Appl Physiol. 1992;73:1067–76. doi: 10.1152/jappl.1992.73.3.1067. [DOI] [PubMed] [Google Scholar]
- 81.Rohmert W. Ermittlung von erholungspausen für statische arbeit des menschen (Determination of rest breaks for static work of man) Int Z Angew Physiol. 1960;18:123–64. [PubMed] [Google Scholar]
- 82.Saitoh T, Ferreira LF, Barstow TJ, et al. Effects of heavy exercise on heterogeneity of muscle deoxygenation kinetics during subsequent heavy exercise. J Appl Physiol. 2009;297:R615–21. doi: 10.1152/ajpregu.00048.2009. [DOI] [PubMed] [Google Scholar]
- 83.Sander M, Chavoshan B, Harris SA, et al. Functional muscle ischemia in neuronal nitric oxide synthase-deficient skeletal muscle of children with Duchenne muscular dystrophy. Proc Natl Acad Sci US A. 2000;97:13818–23. doi: 10.1073/pnas.250379497. [DOI] [PMC free article] [PubMed] [Google Scholar]
- 84.Saugen E, Vøllstad NK, Gibson H, Martin PA, Edwards RHT. Dissociation between metabolic and contractile responses during intermittent isometric exercise in man. Exp Physiol. 1997;82:213–26. doi: 10.1113/expphysiol.1997.sp004010. [DOI] [PubMed] [Google Scholar]
- 85.Simpson LP, Jones AM, Skiba PF, Vanhatalo A, Wilkerson D. Influence of hypoxia on the power-duration relationship during high-intensity exercise. Int J Sports Med. 2015;36:113–9. doi: 10.1055/s-0034-1389943. [DOI] [PubMed] [Google Scholar]
- 86.Skiba PF, Chidnok W, Vanhatalo A, Jones AM. Modeling the expenditure and reconstitution of work capacity above critical power. Med Sci Sports Exerc. 2012;44:1526–32. doi: 10.1249/MSS.0b013e3182517a80. [DOI] [PubMed] [Google Scholar]
- 87.Skiba PF, Clarke D, Vanhatalo A, Jones AM. Validation of a novel intermittent w′ model for cycling using field data. Int J Sports Physiol Perform. 2014;9:900–4. doi: 10.1123/ijspp.2013-0471. [DOI] [PubMed] [Google Scholar]
- 88.Skiba PF, Fulford J, Clarke DC, Vanhatalo A, Jones AM. Intramuscular determinants of the ability to recover work capacity above critical power. Eur J Appl Physiol. 2015;115:703–13. doi: 10.1007/s00421-014-3050-3. [DOI] [PubMed] [Google Scholar]
- 89.Skiba PF, Jones AM. Implications of the critical speed and slow component of V̇O2 for the 2-hour marathon. J Appl Physiol. 2011;110:280. doi: 10.1152/japplphysiol.01259.2010. [DOI] [PubMed] [Google Scholar]
- 90.Smith CG, Jones AM. The relationship between critical velocity, maximal lactate steady-state velocity and lactate turnpoint velocity in runners. Eur J Appl Physiol. 2001;85:19–26. doi: 10.1007/s004210100384. [DOI] [PubMed] [Google Scholar]
- 91.Smith JC, Hill DW. Stability of parameter estimates derived from the power/time relationship. Can J Appl Physiol. 1993;18:43–7. doi: 10.1139/h93-005. [DOI] [PubMed] [Google Scholar]
- 92.Smith JL, Martin PG, Gandevia SC, Taylor JL. Sustained contraction at very low forces produces prominent supraspinal fatigue in human elbow flexor muscles. J Appl Physiol. 2007;103:560–568. doi: 10.1152/japplphysiol.00220.2007. [DOI] [PubMed] [Google Scholar]
- 93.Springer C, Barstow TJ, Wasserman K, Cooper DM. Oxygen uptake and heart rate responses during hypoxic exercise in children and adults. Med Sci Sports Exerc. 1991;23:71–9. [PubMed] [Google Scholar]
- 94.Tesch PA, Thorsson A, Kaiser P. Muscle capillary supply and fiber type characteristics in weight and power lifters. J Appl Physiol. 1984;56:35–8. doi: 10.1152/jappl.1984.56.1.35. [DOI] [PubMed] [Google Scholar]
- 95.Valli G, Cogo A, Passino C, et al. Exercise intolerance at high altitude (5050 m): critical power and W′. Respir Physiol Neurobiol. 2011;177:333–41. doi: 10.1016/j.resp.2011.05.014. [DOI] [PubMed] [Google Scholar]
- 96.van der Vaart H, Murgatroyd SR, Rossiter HB, Chen C, Casaburi R, Porszasz J. Selecting constant work rates for endurance testing in COPD: the role of the power-duration relationship. COPD. 2014;11:267–76. doi: 10.3109/15412555.2013.840572. [DOI] [PubMed] [Google Scholar]
- 97.van Hall G, Lundby C, Araoz M, Calbet JA, Sander M, Saltin B. The lactate paradox revisited in lowlanders during acclimatization to 4100 m and in high-altitude natives. J Physiol. 2009;587:1117–29. doi: 10.1113/jphysiol.2008.160846. [DOI] [PMC free article] [PubMed] [Google Scholar]
- 98.Vanhatalo A, Doust JH, Burnley M. Determination of critical power using a 3-min all-out cycling test. Med Sci Sports Exerc. 2007;39:548–55. doi: 10.1249/mss.0b013e31802dd3e6. [DOI] [PubMed] [Google Scholar]
- 99.Vanhatalo A, Doust JH, Burnley M. A 3-min all-out cycling test is sensitive to a change in critical power. Med Sci Sports Exerc. 2008;40:1693–9. doi: 10.1249/MSS.0b013e318177871a. [DOI] [PubMed] [Google Scholar]
- 100.Vanhatalo A, Fulford J, DiMenna FJ, Jones AM. Influence of hyperoxia on muscle metabolic responses and the power-duration relationship during severe-intensity exercise in humans: a 31P magnetic resonance spectroscopy study. Exp Physiol. 2010;95:528–40. doi: 10.1113/expphysiol.2009.050500. [DOI] [PubMed] [Google Scholar]
- 101.Vanhatalo A, Jones AM. Influence of creatine supplementation on the parameters of the “All-out Critical Power Test”. J Exerc Sci Fit. 2009;1:9–17. [Google Scholar]
- 102.Vanhatalo A, Jones AM, Burnley M. Application of critical power in sport. Int J Sports Physiol Perform. 2011;6:128–36. doi: 10.1123/ijspp.6.1.128. [DOI] [PubMed] [Google Scholar]
- 103.Vanhatalo A, Poole DC, DiMenna FJ, Bailey SJ, Jones AM. Muscle fiber recruitment and the slow component of O2 uptake: constant work rate vs. all-out sprint exercise. Am J Physiol Regul Integr Comp Physiol. 2011;300:R700–7. doi: 10.1152/ajpregu.00761.2010. [DOI] [PubMed] [Google Scholar]
- 104.Whipp BJ, Huntsman BJ, Storer T, Lamarra N, Wasserman K. A constant which determines the duration of tolerance to high-intensity work. Fed Proc. 1982;41:1591. [Google Scholar]
- 105.Whittom F, Jobin J, Simard PM, et al. Histochemical and morphological characteristics of the vastus lateralis muscle in patients with chronic obstructive pulmonary disease. Med Sci Sports Exerc. 1998;30:1467–74. doi: 10.1097/00005768-199810000-00001. [DOI] [PubMed] [Google Scholar]
- 106.Wilkerson DP, Berger JA, Jones AM. Influence of hyperoxia on pulmonary O2 uptake kinetics following the onset of exercise in humans. Resp Physiol Neurobiol. 2006;153:92–106. doi: 10.1016/j.resp.2005.09.006. [DOI] [PubMed] [Google Scholar]
- 107.Zoladz JA, Gladden LB, Hogan MC, Nieckarz Z, Grassi B. Progressive recruitment of muscle fibers is not necessary for the slow component of V̇O2 kinetics. J Appl Physiol. 2008;105:575–80. doi: 10.1152/japplphysiol.01129.2007. [DOI] [PubMed] [Google Scholar]