

Abstract
Purpose
This study investigated a fundamentally new type of responsive MRI contrast agent for molecular imaging that alters T2 exchange (T2ex) properties after interacting with a molecular biomarker.
Methods
The contrast agent Tm-DO3A-oAA was treated with nitric oxide (NO) and O2. The R1 and R2 relaxation rates of the reactant and product were measured with respect to concentration, temperature and pH. CEST spectra of the reactant and product were acquired using a 7 T MRI scanner and analyzed to estimate chemical exchange rates and r2ex relaxivities.
Results
The reaction of Tm-DO3A-oAA with NO and O2 caused a 6.4-fold increase in the r2 relaxivity of the agent, while r1 relaxivity remained unchanged, which demonstrated that Tm-DO3A-oAA is a responsive T2ex agent. The effects of pH and temperature on the r2 relaxivities of the reactant and product supported the conclusion that the product’s benzimidazole ligand caused the agent to have a fast chemical exchange rate relative to the slow exchange rate of the reactant’s ortho-aminoanilide ligand.
Conclusion
T2ex MRI contrast agents are a new type of responsive agent that have good detection sensitivity and specificity for detecting a biomarker, which can serve as a new tool for molecular imaging.
Keywords: responsive agent, T2ex MRI, chemical exchange, molecular imaging, nitric oxide
INTRODUCTION
T2-exchange (T2ex) MRI contrast agents are fundamentally different from the common contrast agents used for MRI (1-5). T2ex contrast agents possess a labile proton or bound water molecule with a chemical exchange rate of 105 – 108 Hz (6). The stochastic chemical exchange of protons between the T2ex agent and bulk water causes the net precession of the bulk water protons to become broadly distributed, especially when the labile proton has a large chemical shift. This change in the net precession of the water protons causes a faster R2 (1/T2) relaxation rate for the water. Importantly, this chemical exchange process does not affect the R1 (1/T1) relaxation rate of the bulk water.
We investigated whether a T2ex agent can detect a molecular biomarker (7). We hypothesized that a biomarker-responsive change in R2 relaxation rate can be compared to a biomarker-unresponsive “control” R1 relaxation rate to detect the biomarker in a manner that is independent of the agent’s concentration. Although T2ex has been investigated for more than 40 years (8-10), its utility for detecting molecular biomarkers has not been explored.
To develop a responsive T2ex MRI contrast agent, we first considered Yb-1,4,7,10-tetraazacyclododecane-(N,N’,N’’-triacetic acid)-(N’’’-orthoaminoanilide) (Yb-DO3A-oAA) that changes its chemical exchange rate after reaction with NO and O2 (11). The chemical shifts of the labile protons of Yb-DO3A-oAA are −11 and +8 ppm. We hypothesized that replacing Yb(III) with Tm(III) may cause larger chemical shifts for the labile protons of this agent, based on comparisons of similar lanthanide chelates with Yb(III) and Tm(III) (12), which would lead to a stronger T2ex relaxation effect (Eq. [S3]) (3). This report describes the R1 and R2 relaxation rates and the CEST MR properties of Tm-DO3A-oAA before and after reaction with NO and O2.
METHODS
Chemical reactions and preparation of samples
The synthesis of the contrast agent Tm-1,4,7,10-tetraazacyclododecane-(N,N’,N’’-triacetic acid)-(N’’’-orthoaminoanilide) (Tm-DO3A-oAA; Figure S1), reactions with NO (Figure S2), and details regarding sample preparations are provided in the Supplementary Information.
R1 and R2 relaxation rate measurements
A spin echo MRI protocol was used to measure R1 relaxation rates with a 12.7 ms echo time; 10 repetition times between 18.339 and 10000 msec; 1 mm slice thickness; 782 × 782 μm in-plane resolution; 5 × 2.5 cm field of view; and 64×32 matrix using a 7 T Bruker Biospec MRI scanner. The same protocol was used to measure R2 relaxation rates with a 15-960 ms echo time in increments of 15 ms; 40 sec repetition time; 1.07 mm slice thickness; 400 × 400 μm in-plane resolution; 5.12 × 2.56 cm field of view; and 128×64 matrix size. All MRI experiments were performed at 37.3°C, except for temperature-dependent studies that were performed from 27°C to 48°C (Figure S4). To calculate the R1 and R2 relaxation times, the signal amplitudes were fitted with a monoexponential function with a constant to account for a possible DC offset using ParaVision® PV5.1 (Bruker Biospin, Inc., Billerica, MA).
CEST MRI studies
CEST spectra were obtained at 1-30 mM concentrations of the reactant and 30 mM of the product treated with NO and O2 gas, at 37.3°C. A HW-Conc fitting method was used to correlate CEST signals with concentrations (13). MRI studies were performed with a CEST-FISP MRI protocol using a 7 T Bruker Biospec MRI scanner (14). The FISP acquisition used a 1.624 ms TE; 3.248 ms TR; 422.41 ms scan repetition time; 30° excitation angle; linear encoding; unbalanced “FID” mode; 1 mm slice thickness; 391 × 391 μm in-plane resolution; 5 × 5 cm field of view; and 128x128 matrix size. CEST saturation consisted of a series of Gaussian shaped pulses with 10 μs interpulse delays. Saturation was applied at a peak power of 20 μT and a bandwidth of 650 Hz for 2.995 sec. Images were reconstructed using ParaVision® pv5.1. Signal amplitudes were measured using ImageJ to create a CEST spectrum (15).
The baseline was not flat in some CEST spectra due to sample heating and/or power drift from the amplifier that caused a change in the tip angle of the FISP imaging sequence. To correct for this sloped baseline, the baseline region with no CEST peaks was fit with a straight line, and this line was subtracted from the CEST spectrum. CEST spectra were smoothed with a cubic spline and a sum of four Lorentzian line shapes was fit to each smoothed CEST spectrum using Matlab R2012B (Mathworks, Inc., Natick, MA) (16,17). A Levenberg–Marquardt least squares fitting routine optimized the center, width, and amplitude of each Lorentzian line to fit the lines to the experimental data. Because the chemical shift of the direct saturation of water was fitted, this method automatically compensated for B0 inhomogeneity during the CEST MRI studies (18). The amplitude of the Lorentzian line shape represented the % CEST value.
Chemical Exchange Rate Estimations
Experimental CEST spectra of nine samples of Tm-DO3A-oAA at 1 to 30 mM concentration were simultaneously fit with the Bloch-McConnell equations using a four-pool model (19,20). The estimate of the chemical exchange rate is largely dependent on fitting the line width of the CEST peak while the estimate of the concentration is largely dependent on fitting the CEST peak amplitude (21). Thus, the chemical exchange rate can be accurately estimated without also requiring the fitting to provide an accurate estimate of the concentration and/or the number of equivalent protons on the agent. The T1 and T2 time constants of water, the B0 shift, and a scale factor that accounts for transceiver coil characteristics were fit for each sample, because each sample had a different concentration and location in the magnet bore. The B1 power, chemical exchange rates, and chemical shift offsets of the three labile pools were simultaneously fit for all phantoms, because these characteristics are the same for each sample regardless of concentration or location in the magnetic field. The fitting was performed by using a 3 second, 9 μT continuous wave pulse instead of a series of Gaussian shaped pulses. To confirm the validity of this approximation, we simulated CEST spectra with a Gaussian pulse train or a continuous wave pulse using the other parameters determined from the fitting process, and observed that the simulated CEST spectra had a difference that was much less than the residual of our fitting to the experimental data. Because linear encoding was used for image acquisition, our simulated CEST spectra included 0.211 s of evolution without RF irradiation, corresponding to the time required to reach the center of k-space acquisition.
Swift-Connick Plot
Swift-Connick plots were generated to show the relationships between chemical exchange rates and r2ex relaxivities for the reactant, based on CEST signals at −49, −29, and +19 ppm at 7 T magnetic field strength (details are provided in Supplementary Information) (3). To gain insights about the product, three-dimensional Swift-Connick plots were generated to show the relationships between chemical exchange rates, chemical shifts, and r2ex relaxivities at 7 T magnetic field strength, for one or two exchangeable protons.
RESULTS
Synthesis and T2ex characterization
Tm-DO3A-oAA was synthesized in five steps (Figure S1). The reaction of Tm-DO3A-oAA with NO and O2 gas was confirmed with HPLC and its product was characterized by high-resolution mass spectroscopy (Figure 1a). The formation of the product was consistent with previous reports (22,23).
Figure 1.

A responsive T2ex contrast agent. (a) The reaction of Tm-DO3A-oAA in the presence of nitric oxide and oxygen. (b) The R1 and R2 relaxation rates before and after reaction with NO and O2 gas were measured at 37.3°C. The reactant was measured at pH 6.77 ± 0.06, and the product was measured at pH 6.90 ± 0.12. Error bars represent the standard deviation of measurements, and some error bars are smaller than the data symbol. (c) The ratio of the relaxation rates for the reactant or product are concentration-independent. This ratio is higher for the product than the reactant, which can be used to indicate the detection of nitric oxide.
The R1 and R2 relaxation rates of serially-diluted samples of the reactant and product treated with NO and O2 gas were used to determine r1 and r2 relaxivities (Figure 1b). The r2 relaxivity of Tm-DO3A-oAA increased 6.4-fold after the reaction, from 0.21 ± 0.020 mM−1s−1 to 1.32 ± 0.20 mM−1s−1. The r1 relaxivities of the reactant and product did not change. The r2 relaxivity values showed that the reactant had a good detection sensitivity that is within an order of magnitude of the sensitivity of T1 contrast agents, and the product had good detection sensitivity that was comparable to the sensitivity of T1 contrast agents (which typically have r1 relaxivities of approximately 1-4 mM−1s−1). Notably, this detection sensitivity also depends on the endogenous T2 relaxation time of tissues, which may reduce the detection sensitivity during in vivo studies. These results also demonstrated good detection specificity because T2-weighted MR contrast could be compared to T1-weighted MR contrast to detect the biomarker in a concentration-independent manner (Figure 1c).
The R2 relaxation rates of the reactant and the product of reaction with NONOate were dependent on pH (Figure 2). Both the reactant and the product showed an increase in R2 when the pH was increased from 3.5 to 5.8, which was attributed to faster base-catalyzed chemical exchange involving the multiple acetate ligands. For pH values higher than 5.8, the R2 value of the reactant initially decreased to reach a minimum at pH 7.1 and then this value increased at higher pH. The product showed a 1.5 fold higher R2 for the product versus the reactant at pH 7.1. This different dependence on pH was attributed to the presence of the product’s benzimidazole arm, because benzimidazoles typically have a pKa of ~7. The R1 rate of both the reactant and the product did not change between pH 3.5 to 8, which provided additional evidence that the pH-dependent T2 relaxation was due to a T2ex effect.
Figure 2.
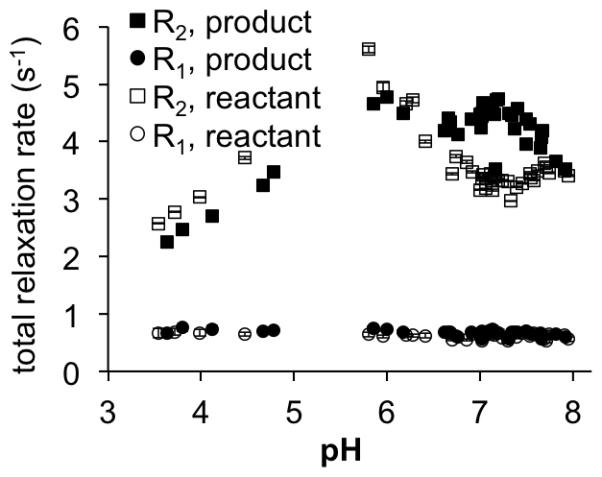
The pH dependence of R1 and R2 relaxation rates of the reactant and product after treatment with with NO and O2 gas. Samples were measured at 5 mM concentration and at 37.3°C. Error bars represent the standard deviation of measurements, and some error bars are smaller than the data symbol.
CEST MR studies and analyses of chemical exchange rates
We acquired CEST spectra of the reactant and product of reaction with NO and O2 gas. The two labile groups of protons in the reactant produced three CEST signals at −49 ppm, −29 ppm, and +19 ppm (Figure 3a). The generation of three CEST signals may be due to multiple conformations of the lanthanide chelate, which has been reported for other CEST agents (24,25), and/or may be arise from a water molecule that is bound to the chelate in addition to the labile protons on the aminoanilide ligand. All CEST signals of the reactant showed an enhancement when the concentration of the agent was increased to 10 mM, but these CEST signals decreased at higher concentrations (Figure 3b). This loss of CEST at higher concentrations was attributed to a decrease in saturation caused by faster R2 relaxation at higher concentrations. For comparison, the product from treatment with NO and O2 gas did not show a CEST signal (Figure 3c), which differed from the observation of CEST at +500 ppm for similar Tm(III) complexes (26). This lack of a CEST signal indicated that the product had a faster chemical exchange rate than the reactant.
Figure 3.

The CEST spectrum of Tm-DO3A-oAA before and after reaction with NO and O2 gas. (a) The CEST spectrum of 30 mM of the reactant showed three CEST peaks. (b) The concentration dependence of the CEST signal of Tm-DO3A-oAA before reacting with NO gas and O2 is shown with lines that represent the results of a HW-conc fitting method that hat does not account for R2 relaxation (30). (c) The CEST spectrum of the product at 30 mM concentration did not show CEST peaks. All samples were tested at 37.3°C and pH 7.2.
We simultaneously fit a series of CEST spectra of the reactant at different concentrations using Bloch-McConnell equations, which determined that the chemical exchange rates of these CEST signals at −49 ppm, −29 ppm, and +19 ppm were 8,400 Hz, 14,500 Hz, and 4,700 Hz, respectively. The 95% confidence intervals of our fittings were ±15.7%, ±17.9%, and ±17.1% for CEST signals at −49 ppm, −29 ppm, and +19 ppm, respectively, which indicated good fitting despite the weak CEST signals generated by this agent. Based on a Swift-Connick plot, these chemical exchange rates from CEST MRI studies were estimated to generate r2ex relaxivities of 0.045, 0.090, and 0.019 mM−1s−1, respectively (Figure 4a) (3,8). The sum of these r2ex relaxivities is 0.154 mM−1s−1, while the measured r2 relaxivity was 0.210 mM−1s−1 (Figure 1b). The difference between these values, 0.056 mM−1s−1, was attributed to the r2 relaxivity mechanisms of the Tm(III) chelate that are attributed to properties other than chemical exchange. Assuming that the product also has the same 0.056 mM−1s−1 dipolar r2 relaxivity attributed to the Tm(III) chelate, then the r2ex relaxivity of the product is 1.26 mM−1s−1.
Figure 4.
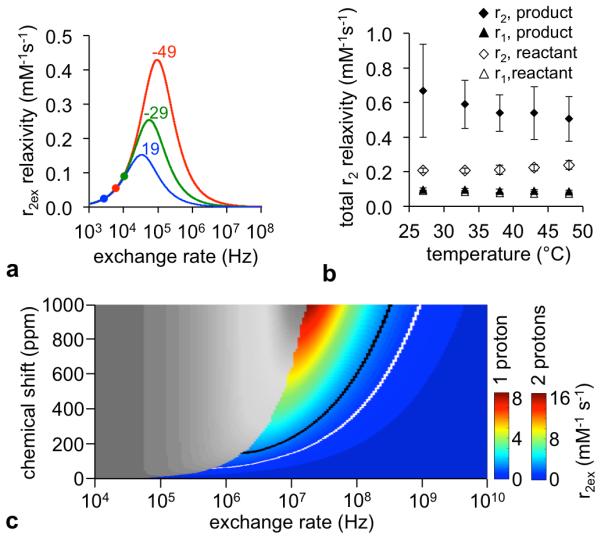
The estimation of the chemical exchange rate of the product. (a) A Swift-Connick plot of the reactant relates the expected r2ex relaxivity with the chemical exchange rate of CEST signals at −49 ppm (red), −29 ppm (green) and +19 ppm (blue) at 7 T magnetic field strength. The chemical exchange rates determined from CEST MRI are shown as a dot on each Swift-Connick line plot. (b) The temperature dependence of r1 and r2 relaxivities of Tm-DO3A-oAA before and after reacting with NO and O2 gas shows that the r2 relaxivity of the reactant increases with increasing temperature, and the product has a r2 relaxivity that decreases with increasing temperature. The reactant was measured at pH 6.77 ± 0.06, and the product was measured at pH 6.90 ± 0.12. Error bars represent the standard deviation of measurements, and some error bars are smaller than the data symbol. (c) A Swift-Connick plot shows the expected relationship between chemical shift, chemical exchange rate, and r2ex relaxivity of the product at 7 T magnetic field strength. Scale bars are shown for one benzimidazole proton and two protons on a bound water molecule. As shown by Figure 4b, the chemical exchange rate must lie in the colored region of this plot. The estimated r2ex relaxivity of 1.26 mM−1 s−1 for the product is shown as a black line for one proton and a white line for two protons in the plot.
An increase in temperature caused an increase in r2 relaxivity for the reactant (Figures 4b, S3), which agreed with a previous report (3). An increase in temperature should cause an increase in chemical exchange rate, which enhances the r2ex relaxivity of the reactant that has chemical exchange rates that are slower than the exchange rate at the peak of the Swift-Connick plot (Figure 4a). In contrast, an increase in temperature caused a decrease in the r2ex relaxivity of the product treated with NO and O2 gas, indicating that the product has a chemical exchange rate that is faster than the exchange rate at the peak of a Swift-Connick plot. The r1 relaxivities of the reactant and the product remained unchanged with temperature, further supporting that the product is a T2ex contrast agent.
To estimate the chemical exchange rate of the product, we generated a Swift-Connick plot as a function of chemical shift and exchange rate. The scale of this plot is different for one exchangeable benzimidazole proton or two protons on a bound water molecule. Based on our temperature-dependent study (Figure 4b), the chemical exchange rate must be greater than the exchange rate at the peak of the Swift-Connick plot, and therefore must lie in the colored region of these plots. To achieve the estimated r2ex value of 1.26 mM−1s−1 in this colored region of these plots, the chemical exchange rate of the product must range from 1.8×10⁶ to 3.1×10⁸ Hz if one proton is responsible for the chemical exchange, and from 7.4×10⁵ to 9.5×10⁸ Hz of two protons are responsible for the chemical exchange.
Validation studies
The r1 and r2 relaxivities were negligible for both the reactant and product without Tm(III) when treated with NO and O2 gas, confirming that agent needs a large chemical shift caused by Tm(III) to generate T2ex relaxation (Figure 5a). Samples of the metal TmCl3.H2O without chelator showed a 3-fold decrease in r2 relaxivity and a 2-fold decrease in r1 relaxivity when reacted with NO and O2 (Figure 5b). The decrease in relaxation was attributed to complexation between Tm(III) and NO or oxidative byproducts of NO and O2 that reduced water access to the metal ion. These validation studies showed that potential demetallation of the contrast agent after reaction with NO could not cause the observed increase in R2 relaxation and the invariant R1 relaxation (Figure 2b).
Figure 5.
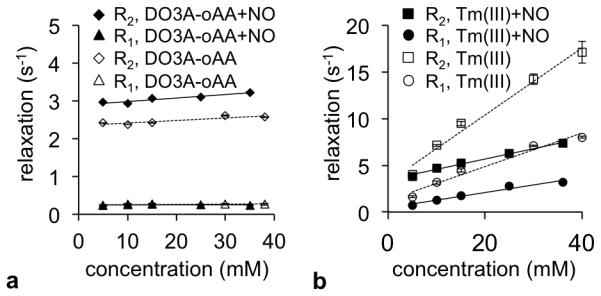
Relaxation rates of the chelator and ion. The R1 and R2 relaxation rates of (a) DO3A-oAA and (b) Tm(III) before and after reacting with NO gas and O2 are shown as a function of concentration. Relaxation rates were measured at 37.3°C. The pH of the solution of DO3A-oAA was adjusted to 6.76 ± 0.06 before reaction and 6.88 ± 0.1 after reaction. The pH of the solution of TmCl3 was adjusted to 6.68 ± 0.08 before reaction and 6.61 ± 0.05 after reaction with NO, respectively. Error bars represent the standard deviation of measurements, and some error bars are smaller than the data symbol.
DISCUSSION and CONCLUSIONS
These studies demonstrated that Tm-DO3A-oAA is a responsive T2ex MRI contrast agent. The change in r2 relaxivity after reaction with NO and O2, and without a corresponding change in r1 relaxivity, is a hallmark of the T2ex process. The effects of pH on r2 relaxivities indicated that the change in r2ex was due to the formation of the benzimidazole ligand of the product. Notably, the faster chemical exchange rate of the product may be due to chemical exchange of the benzimidazole protons with bulk water, and/or chemical exchange of bulk water with a bound water molecule coordinated to the chelate that interact with the benzimidazole ligand. Only one bound water molecule is coordinated to the reactant and product, because the r1 relaxivity of the agent did not change. Regardless of the exact source of the product’s chemical exchange rate, this faster rate caused a change in r2ex relaxivity without a change in r1 relaxivity that was used to detect nitric oxide in a concentration-independent manner.
Future studies to assess chemical reaction rates with NO and in vivo studies that evaluate the effect of pH and temperature on biomarker detection are warranted to further demonstrate the utility of responsive T2ex contrast agents. In vivo studies are also warranted to assess the detection sensitivity of T2ex agents relative to potentially short T2 relaxation times in tissues. Furthermore, other chemical designs should be explored to detect other types of biomarkers, including other metabolites, enzymes, ions, proteins or nucleic acids, and to measure environmental conditions such as pH, hypoxia, redox state, or temperature (7,27). This report provides a guideline for establishing these other agents as responsive T2ex contrast agents.
Responsive T2ex MRI contrast agents have an outstanding combination of advantages for molecular imaging relative to other MRI contrast agents. T1 and T2 MRI contrast agents have chemical exchange rates of 107 – 109 Hz that generate excellent detection sensitivity as low as ~10 and ~1 μM, respectively (28, 29). However, the concentration of the agent can also change the R1 and R2 relaxation rate of the system, which compromises the specificity for detecting a biomarker with these agents (30). CEST MRI contrast agents can possess multiple biomarker-responsive and unresponsive “control” CEST signals that can be compared to improve the specificity for detecting the intended biomarker (12, 31, 32). However, the slow 102 – 104 Hz exchange rate of CEST agents creates low detection sensitivity, requiring >1 mM concentration of a contrast agent for detection (33). T2ex contrast agents have an intermediate chemical exchange rate of 104 – 107 Hz, which provides the ‘best of both worlds’ by retaining good detection sensitivity and specificity for detecting the intended biomarker in a concentration-independent manner. Therefore, responsive T2ex agents represent an intriguing new paradigm for molecular imaging.
Supplementary Material
ACKNOWLEDGMENTS
The authors thank Dr. Katrina Miranda and Dr. Joel Jorolan for access to NO gas, and thank Dr. Josef Vagner and Renata Patek for access to HPLC. This research was supported by NIH grants R01 CA169774 and P50 CA95060.
REFERENCES
- 1.Aime S, Nano R, Grandi M. A new class of contrast agents for magnetic resonance imaging based on selective reduction of water-T2 by chemical exchange. Invest Radiol. 1988;23:S267–S270. doi: 10.1097/00004424-198809001-00058. [DOI] [PubMed] [Google Scholar]
- 2.Aime S, Calabi L, Biondi L, Miranda MD, Ghelli S, Paleari L, Rebaudengo C, Terreno E. Iopamidol: exploring the potential use of a well-established X-ray contrast agent for MRI. Magn Reson Med. 2005;53:830–834. doi: 10.1002/mrm.20441. [DOI] [PubMed] [Google Scholar]
- 3.Soesbe TC, Merritt ME, Green KN, Rojas-Quijano FA, Sherry AD. T2 exchange agents: a new class of paramagnetic MRI contrast agent that shortens water T2 by chemical exchange rather than relaxation. Magn Reson Med. 2011;66:1697–1703. doi: 10.1002/mrm.22938. [DOI] [PMC free article] [PubMed] [Google Scholar]
- 4.Soesbe TC, Ratnakar SJ, Milne M, Zhang S, Do QN, Kovacs Z, Sherry AD. Maximizing T2-exchange in Dy3+DOTA-(amide)X chelates: fine-tuning the water molecule exchange rate for enhanced T2 contrast in MRI. Magn Reson Med. 2014;71:1179–1185. doi: 10.1002/mrm.25091. [DOI] [PMC free article] [PubMed] [Google Scholar]
- 5.Yadav NN, Xu J, Bar-Shir A, Qin Q, Chan KWY, Grgac K, Li W, McMahon MT, van Zijl PCM. Natural D-Glucose as a Biodegradable MRI Relaxation Agent. Magn Reson Med. 2014;72:823–828. doi: 10.1002/mrm.25329. [DOI] [PMC free article] [PubMed] [Google Scholar]
- 6.Sherry AD, Wu Y. The importance of water exchange rates in the design of responsive agents for MRI. Curr Opin Chem Biol. 2013;17:167–174. doi: 10.1016/j.cbpa.2012.12.012. [DOI] [PMC free article] [PubMed] [Google Scholar]
- 7.Yoo B, Pagel MD. An overview of responsive MRI contrast agents for molecular imaging. Front Biosci. 2008;13:1733–1752. doi: 10.2741/2796. [DOI] [PubMed] [Google Scholar]
- 8.Swift TJ, Connick RE. NMR relaxation mechanisms of O17 in aqueous solutions of paramagnetic cations and the lifetime of water molecules in the first coordination sphere. J Chem Phys. 1962;37:307–321. [Google Scholar]
- 9.Leigh JS. Relaxation times in systems with chemical exchange: some exact solution. J Magn Reson. 1971;4:308–311. [Google Scholar]
- 10.Granot J, Fiat D. Effect of chemical exchange on the transverse relaxation rate of nuclei in solution containing paramagnetic ions. J Magn Reson. 1974;15:540–548. [Google Scholar]
- 11.Liu G, Li Y, Pagel MD. Design and characterization of a new irreversible responsive PARACEST MRI contrast agent that detects nitric oxide. Magn Reson Med. 2007;58:1249–1256. doi: 10.1002/mrm.21428. [DOI] [PubMed] [Google Scholar]
- 12.Aime S, Barge A, Delli Castelli D, Fedeli F, Mortillaro A, Nielsen FU, Terreno E. Paramagnetic lanthanide(III) complexes as pH-sensitive chemical exchange saturation transfer (CEST) contrast agents for MRI applications. Magn Reson Med. 2002;47:639–648. doi: 10.1002/mrm.10106. [DOI] [PubMed] [Google Scholar]
- 13.Ali MM, Liu G, Shah T, Flask CA, Page MD. Using two chemical exchange saturation transfer magnetic resonance imaging contrast agents for molecular imaging studies. Acc Chem Res. 2009;42:915–924. doi: 10.1021/ar8002738. [DOI] [PMC free article] [PubMed] [Google Scholar]
- 14.Shah T, Lu L, Dell KM, Pagel MD, Griswold MA, Flask CA. CEST-FISP: a novel technique for rapid chemical exchange saturation transfer MRI at 7 T. Magn Reson Med. 2011;65:432–437. doi: 10.1002/mrm.22637. [DOI] [PMC free article] [PubMed] [Google Scholar]
- 15.Abramoff MD, Magalhaes PJ, Ram SJ. Image processing with ImageJ. Biophotonics Int. 2004;11:36–42. [Google Scholar]
- 16.Stancanello J, Terreno E, Castelli DD, Cabella C, Uggeri F, Aime S. Development and validation of a smoothing-splines-based correction method for improving the analysis of CEST-MR images. Contrast Media Mol Imaging. 2008;3:136–149. doi: 10.1002/cmmi.240. [DOI] [PubMed] [Google Scholar]
- 17.Liu G, Li Y, Sheth VR, Pagel MD. Imaging in vivo extracellular pH with a Single PARACEST MRI Contrast Agent. Molec Imaging. 2012;11:47–57. [PMC free article] [PubMed] [Google Scholar]
- 18.Chen LQ, Randtke EA, Jones KM, Moon BF, Howison CM, Pagel MD. Evaluations of tumor acidosis within in vivo tumor models using parametric maps generated with acidoCEST MRI. Mol Imaging Biol. 2015;17(4):488–496. doi: 10.1007/s11307-014-0816-2. [DOI] [PMC free article] [PubMed] [Google Scholar]
- 19.Woessner DE, Zhang S, Merritt ME, Sherry AD. Numerical solution of the Bloch equations provides insights into the optimum design of PARACEST agents for MRI. Magn Reson Med. 2005;53:790–799. doi: 10.1002/mrm.20408. [DOI] [PubMed] [Google Scholar]
- 20.Murase K, Tanki N. Numerical solutions to the time-dependent Bloch equations revisited. Magn Reson Imaging. 2011;29:126–131. doi: 10.1016/j.mri.2010.07.003. [DOI] [PubMed] [Google Scholar]
- 21.Randtke EA, Chen LQ, Corrales LR, Pagel MD. The Hanes-Woolf linear QUESP method improves the measurements of fast chemical exchange rates with CEST MRI. Magn Reson Med. 2014;71:1603–1612. doi: 10.1002/mrm.24792. [DOI] [PMC free article] [PubMed] [Google Scholar]
- 22.Nagao T, Takizawa H, Hirobe M. Reactions of nitric oxide with amines in the presence of dioxygen. Tetrahedron Lett. 1995;36:8239–8242. [Google Scholar]
- 23.Kojima H, Urano Y, Kikuchi K, Higuchi T, Hirata Y, Nagano T. Fluorescent indicators for imaging nitric oxide production. Angew Chem Int Ed Engl. 1999;38:3209–3212. doi: 10.1002/(sici)1521-3773(19991102)38:21<3209::aid-anie3209>3.0.co;2-6. [DOI] [PubMed] [Google Scholar]
- 24.Delli Castelli D, Terreno E, Aime S. YbIII-HPDO3A: a dual pH and temperature-responsive CEST agent. Angew Chem Int Ed Engl. 2011;50:1798–1800. doi: 10.1002/anie.201007105. [DOI] [PubMed] [Google Scholar]
- 25.Dorazio SJ, Olatunde AO, Spernyak JA, Morrow JR. CoCEST: cobalt(II) amide appended paraCEST MRI contrast agents. Chem Comm. 2013;49:10025–10027. doi: 10.1039/c3cc45000g. [DOI] [PMC free article] [PubMed] [Google Scholar]
- 26.Zhang S, Sherry AD. Physical characteristics of lanthanide complexes that act as magnetization transfer (MT) contrast agents. J Solid State Chem. 2003;171:38–43. [Google Scholar]
- 27.Daryaei I, Pagel MD. Double agents and secret agents: the emerging fields of exogenous chemical exchange saturation transfer and T2-exchange magnetic resonance imaging contrast agents for molecular imaging. Res Rep Nucl Med. 2015;5:19–32. doi: 10.2147/RRNM.S81742. [DOI] [PMC free article] [PubMed] [Google Scholar]
- 28.Ahrens ET, Rothbacher U, Jacobs RE, Fraser SE. A model for MRI contrast enhancement using T1 agents. Proc Nat Acad Sci USA. 1998;95:8443–8448. doi: 10.1073/pnas.95.15.8443. [DOI] [PMC free article] [PubMed] [Google Scholar]
- 29.Mills PH, Ahrens ET. Theoretical MRI contrast model for exogenous T2 agents. Magn Reson Med. 2007;57:442–447. doi: 10.1002/mrm.21145. [DOI] [PubMed] [Google Scholar]
- 30.Martinez GV, Zhang X, Garcia-Martin ML, Morse DL, Woods M, Sherry AD, Gillies RJ. Imaging the extracellular pH of tumors by MRI after injection of a single cocktail of T1 and T2 contrast agents. NMR Biomed. 2011;24:1380–1391. doi: 10.1002/nbm.1701. [DOI] [PMC free article] [PubMed] [Google Scholar]
- 31.Yoo B, Sheth VR, Howison CM, Douglas MJ, Pineda CT, Maine EA, Baker AF, Pagel MD. Detection of In Vivo enzyme activity with catalyCEST MRI. Magn Reson Med. 2014;71:1221–1230. doi: 10.1002/mrm.24763. [DOI] [PMC free article] [PubMed] [Google Scholar]
- 32.Hingorani DV, Randtke EA, Pagel MD. A CatalyCEST MRI contrast agent that detects the enzyme-catalyzed creation of a covalent bond. J Am Chem Soc. 2013;135:6396–6398. doi: 10.1021/ja400254e. [DOI] [PMC free article] [PubMed] [Google Scholar]
- 33.Liu G, Song X, Chan KW, McMahon MT. Nuts and bolts of chemical exchange saturation transfer MRI. NMR Biomed. 2013;26:810–828. doi: 10.1002/nbm.2899. [DOI] [PMC free article] [PubMed] [Google Scholar]
Associated Data
This section collects any data citations, data availability statements, or supplementary materials included in this article.