Abstract
Cell death plays a critical role in health and homeostasis as well as in the pathogenesis and treatment of a broad spectrum of diseases and can be broadly divided into two main categories: apoptosis, or programmed cell death, and necrosis, or acute cell death. While these processes have been characterized extensively in vitro, label-free detection of apoptosis and necrosis at the cellular level in vivo has yet to be shown. In this study, for the first time, fluorescence lifetime imaging microscopy (FLIM) of intracellular reduced nicotinamide adenine dinucleotide (NADH) was utilized to assess the metabolic response of in vivo mouse epidermal keratinocytes following induction of apoptosis and necrosis. Results show significantly elevated levels of both the mean lifetime of NADH and the intracellular ratio of protein bound-to-free NADH in the apoptotic compared to the necrotic tissue. In addition, the longitudinal profiles of these two cell death processes show remarkable differences. By identifying and extracting these temporal metabolic signatures, apoptosis in single cells can be studied in native tissue environments within the living organism.
Keywords: apoptosis, fluorescence lifetime imaging microscopy, in vivo imaging, label-free imaging, cell death
Graphical abstract
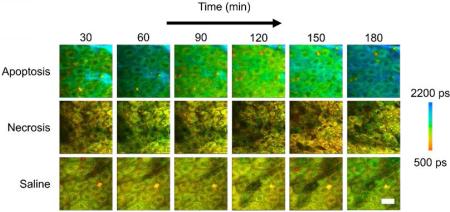
Apoptosis, or programmed cell death plays a critical role in health and homeostasis as well as in the treatment of many diseases. While this process has been characterized extensively in vitro, label-free detection of cells in vivo has yet to be shown. In this study, fluorescence lifetime imaging microscopy of reduced nicotinamide adenine dinucleotide is utilized to assess the metabolic response of in vivo mouse keratinocytes following induction of apoptosis.
1. Introduction
Apoptosis, or programmed cell death, is a fundamentally important process in the maintenance of healthy cell populations in living organisms [1]. Pathological alterations in apoptotic pathways can lead to many disorders both in the case of increased levels of apoptosis, as in Alzheimer's disease [2], as well as in the case of decreased levels of apoptosis, which is common during the progression of many cancers [3,4]. Necrosis, a form of acute cell death [5], can be well differentiated from apoptosis based on cellular energy consumption. Specifically, apoptosis is characterized by a coordinated, energy-regulated process that results in successful clearing of the cell without an appreciable immune response, while necrosis is an accidental process that ultimately results in the rupture of the cell membrane causing an inflammatory response due to the leakage of intracellular materials into the extracellular space [6]. In this study, label-free fluorescence lifetime imaging microscopy (FLIM), based on two-photon excitation fluorescence (TPEF) microscopy, is used to observe the binding dynamics of intracellular reduced nicotinamide adenine dinucleotide (NADH), allowing identification of apoptosis and discrimination between the two major cell death modes in vivo with cellular resolution.
Methods for the detection of cell death have been developed and utilized for in vitro studies of cultured cells [7,8], preclinical small animal studies [9], and even for clinical trials [10,11]. The discovery of cell death-related biomarkers have enabled the in vitro study of numerous pathways associated with apoptosis and necrosis. These studies have paved the way for detection of apoptosis in clinical settings which can be performed in vivo with SPECT or PET imaging using radiolabeled annexin V, a molecule which has a nanomolar affinity for membrane-bound phosphatidylserine (PS) specific for the cell membrane of apoptotic bodies [12,13]. More recently, noninvasive and label-free methods have been adopted to microscopically identify and quantify important parameters of cell death. These methods include ultrasound imaging [14-16], dynamic light scattering [17], Raman scattering [18], and endogenous fluorescence imaging [19]. Fluorescence imaging of reduced nicotinamide adenine dinucleotide (NADH) in particular shows promising results for longitudinally tracking the metabolic processes during cell death [20-23]. Independently, FLIM and TPEF have both shown great value in a wide variety of applications toward obtaining metabolic contrast from intrinsic fluorophores such as NADH [24-26]. In particular, FLIM is capable of distinguishing the unbound, or free NADH in the cell cytosol from protein-bound NADH in the cell [27]. As proteins bind to NADH in response to both metabolic functions and external conditions [28], these two combined modalities are capable of high-resolution, deep tissue imaging, relative to confocal microscopy, of both the structural morphology and metabolic profiles of living cells both in vitro [29,30] and in vivo [31,32]. While these modalities have been successfully used previously in tracking cell death in vitro or in assessing the metabolic state of in vivo tissue, they have not yet been extended to specifically identify and track cell death in vivo with cellular level resolution in a label-free manner.
In this study, fluorescence lifetime imaging microscopy (FLIM) and two-photon excited fluorescence (TPEF) microscopy of endogenous intracellular NADH are used to longitudinally track and distinguish apoptotic keratinocytes from necrotic and healthy keratinocytes beneath the intact skin surface in an in vivo hairless mouse model. Keratinocytes were imaged by focusing the excitation beam of the microscope just beneath the surface of the stratum corneum in the epidermis. Analysis of the longitudinal dynamics and metabolic parameters from obtained data enable differentiation of these death modes in vivo with cellular level resolution. These intrinsic biomarkers may prove highly beneficial in the translation of the next generation of therapeutics by permitting the noninvasive investigation of metabolic dynamics and therapeutic responses in individual cells.
2. Materials and methods
2.1. Experimental Design
A hairless mouse model (SKH1-Elite, Charles River) was used to investigate the longitudinal metabolic changes following chemical treatment to induce different forms of cell death. This animal model is the most widely used mouse model for dermatological research [33]. All studies were conducted under a protocol approved by the University of Illinois at Urbana-Champaign Institutional Animal Care and Use Committee (IACUC). All animals were anesthetized using isoflurane gas (3% induction, 2% maintenance). Animals remained under anesthesiz for the duration of the experiment. All groups received an intraepidermal injection in the dorsal region of the body. Briefly, animals were separated into three groups. One group of animals (N = 2) received 100 μL saline and served as a control. Apoptosis (N = 5) was induced in the next group of animals with a solution of combined 200 μM camptothecin and 500 μM etoposide prepared in a 100 μL volume. Finally, necrosis (N = 3) was induced in the third group of animals with a 100 μL injection of 100 μM hydrogen peroxide. Camptothecin and etoposide, when used in concert, are well documented to induce apoptosis in a wide variety of cell types, including keratinocytes [19,34,35]. Similarly, hydrogen peroxide has been shown to cause necrotic cell death at high doses, consistent with what was used in this study [36]. 30 minutes following treatment, animals were imaged with a custom-built nonlinear optical microscope capable of performing TPEF imaging and FLIM. Following this, each animal was imaged every 15 minutes following for a total of three hours following the injection. The imaging duration was chosen such that the same cells could be imaged for as long as possible while minimizing the risk associated with long-term anesthesia of the animals. The imaging site was located approximately 200-500 μm away from the injection site to avoid the potential effects of the injection process on the sensitive metabolic imaging. Following this, animals were sacrificed and skin samples were harvested for histological comparison.
2.2. Nonlinear optical microscopy
A custom-built multimodal optical microscope capable of both TPEF and FLIM imaging and described previously [30,34] was used in this study. The combination of TPEF and FLIM can provide metabolic information regarding the skin microenvironment with cellular resolution and depth-resolved sectioning. Excitation light was provided by a titanium:sapphire laser (MaiTai HP, Spectra Physics) centered at a wavelength of 730 nm, which was focused in the epidermal keratinocyte layers (approximately 5-20 μm beneath the skin surface) of intact, living mouse skin using a high numerical aperture (NA) objective lens (XLUMP20X, Olympus). The optical power at the focus was less than 7 mW. The focal spot was raster scanned across the sample using a pair of computer-controlled galvanometric mirrors (Micromax 671, Cambridge Technology). Detection of fluorescence was performed using a 16 channel photomultiplier tube (PMT) spectrometer (PML-16-C, Becker-Hickl) centered at 450 nm. In order to obtain fluorescence lifetime curves, time-correlated single photon counting (TCSPC) was performed using a commercial TCSPC data acquisition board (SPC-150, Becker-Hickl).
2.3. Image analysis
Data analysis was performed for TPEF and FLIM images using SPCImage (Becker-Hickl). The bi-exponential fluorescence decay model was fit to the recorded FLIM dataset at each pixel in order to recover the parameters of interest including the mean fluorescence lifetime, relative concentrations of both free and protein-bound NADH, and excited state lifetimes of free and protein-bound NADH. Color-coded images were constructed based on these calculated values. In general, more red hues in these images represent lower values of these FLIM parameters while more blue hues represent increased values of the FLIM parameters. The appropriate scale of these mappings is given by the color scale bar in each figure. For statistical analysis in Figures 1-3 and Figure S1, cells from artifact-free regions in each image were segmented using a customized CellProfiler [37] pipeline based on an intensity based segmentation algorithm. Briefly, images were first thresholded manually and contrast adjusted to mitigate the effect of bright artifacts that interfere with the intensity based segmentation procedure. Next, an automatic, intensity based segmentation algorithm in the CellProfiler software was used to segment regions of the image of the approximate size of the cells. Following this, segmented regions not corresponding to cells or regions that included regions of artifacts were removed from the analysis. Finally, the metabolic parameters of interest were then extracted from the regions provided by these segmented cells.
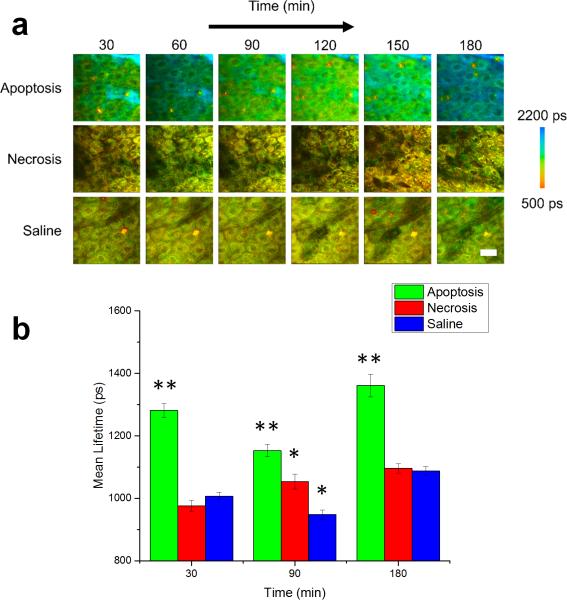
Figure 1.
In vivo mean fluorescence lifetime dynamics in murine keratinocytes. (a) Images of the mean lifetime tracked between 30-180 minutes following treatment for inducing apoptosis or necrosis in epidermal keratinocytes. Saline-treated mice were used as a control. (b) Comparison of the mean lifetime (τm) in cells across the observed experimental population 30, 90 and 180 minutes after the treatment. At each time point, N = 34 cells analyzed for the apoptosis group, N = 14 cells analyzed for the saline group and N = 23 cells analyzed for the necrosis group. * p < 0.05, ** p < 0.01 compared to the other two groups. Scale bar is 25 μm. All error bars represent SEM.
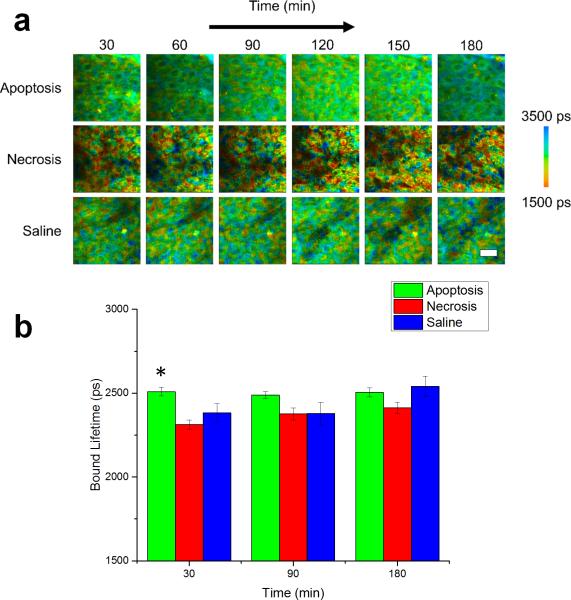
Figure 3.
NADH bound lifetime dynamics of in vivo murine keratinocytes. (a) Images of the bound lifetime (τ2) tracked from 30-180 minutes following treatment for induction of apoptosis or necrosis in epidermal keratinocytes. Saline-treated mice were used as a control. (b) Statistical analysis of bound lifetime in cells across entire experimental population. At each time point, N = 34 cells analyzed for the apoptosis group, N = 14 cells analyzed for the saline group and N = 23 cells analyzed for the necrosis group. * p < 0.05 compared to the other two groups. Scale bar is 25 μm. All error bars represent SEM.
2.4. Statistical Analysis
One-way ANOVA followed by Tukey's post-hoc test was used to make comparisons across the apoptosis, necrosis, and control cells in Figures 1-3. Data are presented in all cases as means ± s.e.m.
3. Results
3.1. In vivo cellular identification of apoptosis in keratinocytes
For each imaging session, TPEF intensity images were used to obtain information about the keratinocyte structure and morphology as well as provide a measure of the relative concentration of NADH in the region under investigation, while the time resolved fluorescence decay curves acquired at each pixel in the image provided functional, metabolic information regarding the binding dynamics of NADH. Figure 1 shows the longitudinal tracking of the mean fluorescence lifetime of NADH in mice with locally induced apoptosis and necrosis in the skin, with representative datasets from each group at 30 minute intervals (Figure 1a). Data from the saline-treated mice were used as a control. The mean lifetime shown here is given by:
| (1) |
where a1 is the relative concentration of free NADH, a2 is the relative concentration of protein-bound NADH, and τ1 and τ2 are the free and protein-bound excited state lifetimes, respectively. Thus, the mean lifetime can be considered as the concentration weighted average of the free and bound NADH lifetime. The statistical analysis of the mean lifetime parameter across the entire observed cell population 30, 90 and 180 minutes after the treatment showed that the mean lifetime in animals with induced apoptosis was significantly increased at each of these time points compared to both the animals with induced necrosis and the control group (Figure 1b). However, a significant decrease in the mean lifetime was observed 90 minutes after the treatment (Figure S3a) after which it increased again. Interestingly, this was consistently found for all apoptosis-induced animals.
3.2. Parametric analysis of time-resolved fluorescence
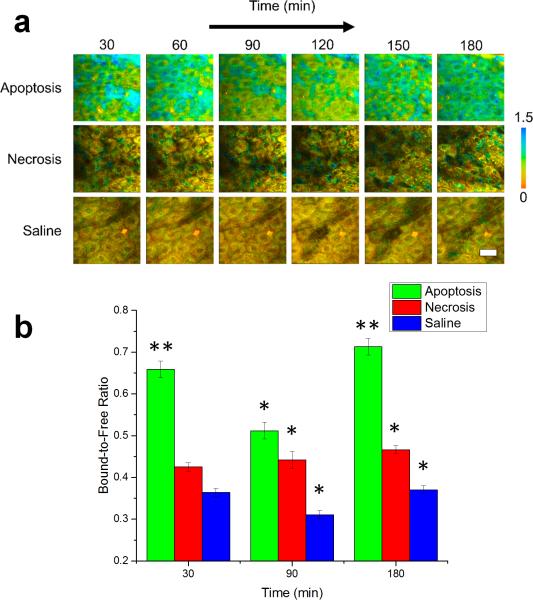
In order to further understand the mechanism responsible for these differences in the mean lifetime between apoptotic, necrotic, and control cells, the individual parameters in Eqn. 1 were isolated using the fit parameters of each fluorescence decay curve, allowing study of the effects of cell death on both the extent of NADH binding as well as alterations in the binding site of NADH. This type of analysis has been useful previously in better characterizing the binding dynamics of NADH [38] as well as distinguishing between NADH and NADPH in living cells [39]. Figure 2 shows a comparison of these two cell death modes based on the ratio of protein bound-to-free NADH concentrations (a2/a1). Color-coded images of the bound-to-free NADH ratio at 30 minute intervals of representative datasets from each group illustrate the observed dynamics of the relative binding (Figure 2a). While the relative concentration of bound NADH in the necrosis-induced and control cells appear to be relatively unchanged during the experiment, the cells in the apoptosis-induced mice show an increase in relative binding initially, which significantly decreases at 90 minutes (Figure S3b) and is then again observed to be elevated after 180 minutes. The statistical analysis across the entire observed cell population (Figure 2b) confirms that these trends closely match the dynamics observed in the mean lifetime. Statistically, a significantly increased ratio of bound-to-free NADH concentrations is observed at 30 and 180 minutes (p < 0.01) as well as at 90 minutes (p < 0.05) after the induction of apoptosis compared to the other two groups.
Figure 2.
Bound-to-free NADH concentration ratio dynamics of in vivo murine keratinocytes. (a) Images of the bound-to-free concentration ratio (a2/a1) tracked from 30-180 minutes following treatment for inducing apoptosis or necrosis in epidermal keratinocytes. Saline-treated mice were used as a control. (b) Statistical comparison of the bound-to-free NADH concentration ratio in cells across the experimental population. At each time point, N = 34 cells analyzed for the apoptosis group, N = 14 cells analyzed for the saline group and N = 23 cells analyzed for the necrosis group. * p < 0.05 compared to the other two groups, ** p < 0.01 compared to the other two groups. Scale bar is 25 μm. All error bars represent SEM.
In contrast, lifetimes for both the free NADH (τ1; Figure S1) and the bound NADH (τ2; Figure 3) show relatively little change for the duration of the experiment. While the necrosis-induced mice appear to have a broader distribution of lifetimes for bound NADH compared to the other two groups of mice, the metabolic dynamics of this group appear to be largely unchanged. The statistical analysis across the entire observed cell population shows a significant change only in the bound NADH lifetime (p < 0.05) at 30 minutes (Figure 3b), while no significant change is observed for the free NADH lifetime (Figure S1).
3.3. Single cell tracking of early cell apoptosis dynamics
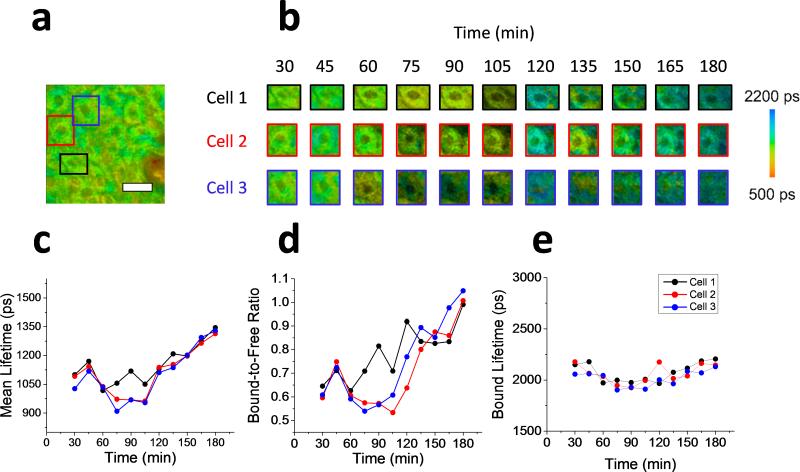
In order to identify the potential advantages of a cellular, in vivo approach to identify apoptosis, analysis of the longitudinal data was performed on three randomly selected single cells in addition to the population of cells sampled across the field of view of the acquired microscope images. The results of the single cell analysis of in vivo keratinocytes treated with the apoptosis-inducing compound are shown in Figure 4. The boxed regions in the fluorescence lifetime image (τm) of the original field of view are identifying the three analyzed single cells (Figure 4a). Longitudinal mean lifetime images of these cells show the temporal metabolic dynamics of each cell analyzed at 15 minute intervals for the full duration of the 3 hour experiment. Higher values for the mean lifetime can be observed after 180 minutes for all three cells, which is consistent with the general trend observed for the entire field of view (Figure 2) as well as in the previous in vitro studies [23,34]. The parametric analysis of each lifetime component was also applied to these cells (Figure 4c-e). The mean lifetime (Figure 4c), bound-to-free NADH ratio (Figure 4d), and bound lifetime (Figure 4e) were each tracked as the average value of each parameter across the individual selected cells. After 60 minutes, a sharp decrease in mean lifetime is observed in cell 3 that precedes the corresponding decrease observed in cells 1 and 2, followed by the continuous increase in all three cells for the remainder of the experiment. The ratio of bound-to-free NADH ratio exhibits very similar changes. The time discrepancy in observed changes between cells can be due to many local factors such as diffusion effects (time difference in exposure to the apoptotic drug), or different metabolic status of the cells.
Figure 4.
Single cell analysis of in vivo apoptotic keratinocytes. (a) Mean fluorescence lifetime image of the full field of view of the microscope of in vivo mouse skin treated with apoptosis-inducing compound. The three colored rectangles represent the image regions were individual cells were studied. (b) Longitudinal tracking of the mean lifetime from three cellular regions. Images are shown for each cell every 15 minutes up to three hours following the treatment. (c-e) Plots of the metabolic lifetime parameters of the three cells studied including the mean lifetime (c), bound-to-free NADH ratio (d), and bound lifetime (e). Scale bar is 25 μm.
3.4. Cell death confirmation
Cell death was confirmed using standard histological staining of tissue samples with hematoxylin and eosin of the skin areas that were imaged with TPEF and FLIM (Figure S2). Standard hallmarks of apoptosis such as indicating condensed nuclei as well as the loss of membrane integrity can be clearly observed in the skin samples treated with the apoptosis-inducing compound (Figure S2a) [40]. In the group treated with the necrosis-inducing compound, a complete loss of cellular structure can be observed in the affected area, a clear indication of necrotic cell death (Figure S2b). These are both well contrasted by the normal keratinocytes observed in saline-treated animals (Figure S2c).
4. Discussion
This study presents an in vivo, label-free approach to identifying apoptosis with single cell resolution. The obtained results show that the mean fluorescence lifetime of NADH is a suitable biomarker for tracking apoptosis in vivo. Most notably, the NADH mean lifetime shows a significant increase especially at later time points, which is in good agreement with previous in vitro studies of cell [23] and tissue [34] cultures. The primary mechanism responsible for the significantly elevated mean lifetime is the relative increase in bound NADH, which could be due to an increased level of mitochondrial activation associated with apoptotic cell death [21,36]. These observations imply that while cells are undergoing apoptosis, the relative amount of binding of intracellular NADH to proteins has more impact on the observed decay curves than any change to the bound lifetime of NADH that may result from binding to different proteins or environmental conditions. It is also worth noting that the decrease in mean lifetime in the apoptosis-induced cells between 30 and 90 minutes post-treatment can be primarily attributed to a significant decrease in the relative amount of protein-bound NADH compared to free NADH (Figure S3). This deviation from previous in vitro experiments might be explained by the presence of blood and nutrient supply to the cells undergoing apoptosis. Important future experiments to investigate this could focus on the role of nutrient and blood supply in the process of apoptosis using in vivo FLIM. Tracking of these metabolic parameters could play a critical role in distinguishing apoptotic cells from both normal and necrotic cells with fluorescence lifetime imaging.
These results can be explained mechanistically by the role of active energy consumption in the programmed cell death process described previously in cell culture studies [23,34]. The in vitro studies also report a significant increase in the mean lifetime of NADH associated with apoptosis and no significant changes in the mean lifetime associated with necrosis. The approach employed here has enabled the successful translation of these methods in vivo, showing that these biomarkers can be used for label-free tracking of apoptosis in living organisms. Finally, the advantage of a cellular resolution imaging for identifying cell death was demonstrated by studying the heterogeneous response to an apoptosis-inducing agent in nearby cells, allowing for the assessment of the individual cellular responses. Therefore, the respective metabolic changes can be probed and studied in the real time in their natural environment in order to identify apoptosis in single cells. Moving forward, it will be critical to correlate in time these in vivo observations to the molecular hallmarks of apoptosis using sensitive methods such as immunohistochemistry as has been done in vitro [41]. In addition, further study of these intrinsic biomarkers can also be used to identify pathological alterations of cell death pathways, which is critical to better understand the progression of many diseases.
Supplementary Material
Acknowledgements
We thank Darold Spillman for assistance with logistical and information technology support. This research was supported in part by a grant from the National Institutes of Health (1 R01 CA166309). A.J.B. was supported in part by a National Science Foundation Graduate Research Fellowship (DGE-1144245) and by a UIUC ECE Distinguished Research Fellowship, and J.L. was supported by the NIH National Cancer Institute Alliance for Nanotechnology in Cancer program (Midwest Cancer Nanotechnology Training Center; R25 CA154015A), a Support for Under-Represented Groups in Engineering (SURGE) Fellowship (University of Illinois at Urbana-Champaign), and a Beckman Institute Graduate Research Fellowship (University of Illinois at Urbana-Champaign). Additional information can be found at http://biophotonics.illinois.edu.
Footnotes
Supporting Information
Additional supporting information may be found in the online version of this article at the publisher's website.
Author Biographies Please see Supporting Information online.
References
- 1.Thompson CB. Science. 1995;267:1456–1462. doi: 10.1126/science.7878464. [DOI] [PubMed] [Google Scholar]
- 2.Behl C. J. Neural Transm. 2000;107:1325–1344. doi: 10.1007/s007020070021. [DOI] [PubMed] [Google Scholar]
- 3.Gerl R, Vaux DL. Carcinogenesis. 2005;26:263–270. doi: 10.1093/carcin/bgh283. [DOI] [PubMed] [Google Scholar]
- 4.Kerr JF, Winterford CM, Harmon BV. Cancer. 1994;73:2013–2026. doi: 10.1002/1097-0142(19940415)73:8<2013::aid-cncr2820730802>3.0.co;2-j. [DOI] [PubMed] [Google Scholar]
- 5.Saito Y, Nishio K, Ogawa Y, Kimata J, Kinumi T, Yoshida Y, Noguchi N, Niki E. Free Radic. Res. 2006;40:619–630. doi: 10.1080/10715760600632552. [DOI] [PubMed] [Google Scholar]
- 6.Kroemer G, Dallaporta B, Resche-Rigon M. Annu. Rev. Physiol. 1998;60:619–642. doi: 10.1146/annurev.physiol.60.1.619. [DOI] [PubMed] [Google Scholar]
- 7.Boersma AW, Nooter K, Oostrum RG, Stoter G. Cytometry. 1996;24:123–130. doi: 10.1002/(SICI)1097-0320(19960601)24:2<123::AID-CYTO4>3.0.CO;2-K. [DOI] [PubMed] [Google Scholar]
- 8.Koopman G, Reutelingsperger CP, Kuijten GA, Keehnen RM, Pals ST, van Oers MH. Blood. 1994;84:1415–1420. [PubMed] [Google Scholar]
- 9.Blankenberg FG, Katsikis PD, Tait JF, Davis RE, Naumovski L, Ohtsuki K, Kopiwoda S, Abrams MJ, Darkes M, Robbins RC, Maecker HT, Strauss HW. Proc. Natl. Acad. Sci. U. S. A. 1998;95:6349–6354. doi: 10.1073/pnas.95.11.6349. [DOI] [PMC free article] [PubMed] [Google Scholar]
- 10.Belhocine T, Steinmetz N, Hustinx R, Bartsch P, Jerusalem G, Seidel L, Rigo P, Green A. Clin. Cancer Res. 2002;8:2766–2774. [PubMed] [Google Scholar]
- 11.Van den Brande JMH, Koehler TC, Zelinkova Z, Bennink RJ, Velde AAT, ten Cate FJW, van Deventer SJH, Peppelenbosch MP, Hommes DW. Gut. 2007;56:509–517. doi: 10.1136/gut.2006.105379. [DOI] [PMC free article] [PubMed] [Google Scholar]
- 12.Keen HG, Dekker BA, Disley L, Hastings D, Lyons S, Reader AJ, Ottewell P, Watson A, Zweit J. Nucl. Med. Biol. 2005;32:395–402. doi: 10.1016/j.nucmedbio.2004.12.008. [DOI] [PubMed] [Google Scholar]
- 13.Narula J, Acio ER, Narula N, Samuels LE, Fyfe B, Wood D, Fitzpatrick JM, Raghunath P, Tomaszewski JE, Kelly C. Nat. Med. 2001;7:1347–1352. doi: 10.1038/nm1201-1347. [DOI] [PubMed] [Google Scholar]
- 14.Banihashemi B, Vlad R, Debeljevic B, Giles A, Kolios MC, Czarnota GJ. Cancer Res. 2008;68:8590–8596. doi: 10.1158/0008-5472.CAN-08-0006. [DOI] [PubMed] [Google Scholar]
- 15.Czarnota GJ. Eur. J. Nucl. Med. Mol. Imaging. 2005;32:622. doi: 10.1007/s00259-004-1736-1. [DOI] [PubMed] [Google Scholar]
- 16.Vlad RM, Kolios MC, Czarnota GJ. Methods Mol. Biol. 2011;682:165–187. doi: 10.1007/978-1-60327-409-8_13. [DOI] [PubMed] [Google Scholar]
- 17.Farhat G, Mariampillai A, Yang VX, Czarnota GJ, Kolios MC. J. Biomed. Opt. 2011;16:070505. doi: 10.1117/1.3600770. [DOI] [PubMed] [Google Scholar]
- 18.Okada M, Smith NI, Palonpon AF, Endo H, Kawata S, Sodeoka M, Fujita K. Proc. Natl. Acad. Sci. U. S. A. 2012;109:28–32. doi: 10.1073/pnas.1107524108. [DOI] [PMC free article] [PubMed] [Google Scholar]
- 19.Georgakoudi I, Levitt J, Baldwin A, Papadakis A, Munger K. Gynecol. Oncol. 2005;99:S54–57. doi: 10.1016/j.ygyno.2005.07.043. [DOI] [PubMed] [Google Scholar]
- 20.Buschke DG, Squirrell JM, Fong JJ, Eliceiri KW, Ogle BM. Biol. Cell. 2012;104:352–364. doi: 10.1111/boc.201100091. [DOI] [PMC free article] [PubMed] [Google Scholar]
- 21.Levitt JM, Baldwin A, Papadakis A, Puri S, Xylas J, Munger K, Georgakoudi I. J. Biomed. Opt. 2006;11:064012. doi: 10.1117/1.2401149. [DOI] [PubMed] [Google Scholar]
- 22.Sanchez WY, Prow TW, Sanchez WH, Grice JE, Roberts MS. J. Biomed. Opt. 2010;15:046008. doi: 10.1117/1.3466580. [DOI] [PubMed] [Google Scholar]
- 23.Wang HW, Gukassyan V, Chen CT, Wei YH, Guo HW, Yu JS, Kao FJ. J. Biomed. Opt. 13. 2008 doi: 10.1117/1.2975831. [DOI] [PubMed] [Google Scholar]
- 24.Balu M, Mazhar A, Hayakawa CK, Mittal R, Krasieva TB, König K, Venugopalan V, Tromberg BJ. Biophys. J. 2013;104:258–267. doi: 10.1016/j.bpj.2012.11.3809. [DOI] [PMC free article] [PubMed] [Google Scholar]
- 25.Bird DK, Yan L, Vrotsos KM, Eliceiri KW, Vaughan EM, Keely PJ, White JG, Ramanujam N. Cancer Res. 2005;65:8766–8773. doi: 10.1158/0008-5472.CAN-04-3922. [DOI] [PubMed] [Google Scholar]
- 26.Yu Q, Heikal AA. J. Photochem. Photobiol. B. 2009;95:46–57. doi: 10.1016/j.jphotobiol.2008.12.010. [DOI] [PMC free article] [PubMed] [Google Scholar]
- 27.Lakowicz JR, Szmacinski H, Nowaczyk K, Johnson ML. Proc. Natl. Acad. Sci. U. S. A. 1992;89:1271–1275. doi: 10.1073/pnas.89.4.1271. [DOI] [PMC free article] [PubMed] [Google Scholar]
- 28.Ying WH. Antioxid. Redox Signal. 2008;10:179–206. doi: 10.1089/ars.2007.1672. [DOI] [PubMed] [Google Scholar]
- 29.Ghukasyan VV, Kao F-J. J. Phys. Chem. C Nanomater. Interfaces. 2009;113:11532–11540. [Google Scholar]
- 30.Zhao Y, Graf BW, Chaney EJ, Mahmassani Z, Antoniadou E, DeVolder R, Kong H, Boppart MD, Boppart SA. J. Biophotonics. 2012;5:437–448. doi: 10.1002/jbio.201200003. [DOI] [PMC free article] [PubMed] [Google Scholar]
- 31.Skala MC, Riching KM, Gendron-Fitzpatrick A, Eickhoff J, Eliceiri KW, White JG, Ramanujam N. Proc. Natl. Acad. Sci. U. S. A. 2007;104:19494–19499. doi: 10.1073/pnas.0708425104. [DOI] [PMC free article] [PubMed] [Google Scholar]
- 32.Walsh AJ, Cook RS, Manning HC, Hicks DJ, Lafontant A, Arteaga CL, Skala MC. Cancer Res. 2013;73:6164–6174. doi: 10.1158/0008-5472.CAN-13-0527. [DOI] [PMC free article] [PubMed] [Google Scholar]
- 33.Benavides F, Oberyszyn TM, VanBuskirk AM, Reeve VE, Kusewitt DF. J. Dermatol. Sci. 2009;53:10–18. doi: 10.1016/j.jdermsci.2008.08.012. [DOI] [PMC free article] [PubMed] [Google Scholar]
- 34.Zhao Y, Marjanovic M, Chaney EJ, Graf BW, Mahmassani Z, Boppart MD, Boppart SA. Biomed. Opt. Express. 2014;5:3699–3716. doi: 10.1364/BOE.5.003699. [DOI] [PMC free article] [PubMed] [Google Scholar]
- 35.Bergeron S, Beauchemin M, Bertrand R. Mol. Cancer Ther. 2004;3:1659–1669. [PubMed] [Google Scholar]
- 36.Blankenberg FG. Cancer Biol. Ther. 2008;7:1525–1532. doi: 10.4161/cbt.7.10.6934. [DOI] [PubMed] [Google Scholar]
- 37.Carpenter AE, Jones TR, Lamprecht MR, Clarke C, Kang IH, Friman O, Guertin DA, Chang JH, Lindquist RA, Moffat J. Genome Biol. 2006;7:R100. doi: 10.1186/gb-2006-7-10-r100. [DOI] [PMC free article] [PubMed] [Google Scholar]
- 38.Skala MC, Riching KM, Bird DK, Gendron-Fitzpatrick A, Eickhoff J, Eliceiri KW, Keely PJ, Ramanujam N. J. Biomed. Opt. 2007;12:024014. doi: 10.1117/1.2717503. [DOI] [PMC free article] [PubMed] [Google Scholar]
- 39.Blacker TS, Mann ZF, Gale JE, Ziegler M, Bain AJ, Szabadkai G, Duchen MR. Nat. Commun. 5. 2014 doi: 10.1038/ncomms4936. [DOI] [PMC free article] [PubMed] [Google Scholar]
- 40.Corfe B, Dive C, Garrod D. Cell Death Differ. 2000;7:234–235. doi: 10.1038/sj.cdd.4400634. [DOI] [PubMed] [Google Scholar]
- 41.Yu J-S, Guo H-W, Wang C-H, Wei Y-H, Wang H-W. J. Biomed. Opt. 2011;16:036008. doi: 10.1117/1.3560513. [DOI] [PubMed] [Google Scholar]
Associated Data
This section collects any data citations, data availability statements, or supplementary materials included in this article.


