

Abstract
Urban areas are particularly vulnerable to heat-related health outcomes. Simultaneous trends of climate change and urbanization may increase the urban heat-related health burden. We investigated the effects of urban vegetation on heat-related mortality, and evaluated whether different levels of vegetation and individuals' characteristics affect the temperature-mortality associations within Seoul, Korea 2000-2009. We used Normalized Difference Vegetation Index (NDVI) to assess the urban vegetation within Seoul. We applied an overdispersed Poisson generalized linear model with interaction term between temperature and indicator of NDVI group (categorized in 3 levels) to assess the effect modification of the temperature-mortality association by urban vegetation. We conducted stratified analysis to explore whether associations are affected by individual characteristics of sex and age. The association between total mortality and a 1°C increase in temperature above the 90th percentile (25.1°C) (the “heat effect”) was the highest for gus with low NDVI. The heat effect was a 4.1% (95% confidence interval (CI) 2.3, 5.9%), 3.0% (95% CI 0.2, 5.9%), and 2.2% (95% CI -0.5, 5.0%) increase in mortality risk for low, medium, and high NDVI group, respectively. Estimated risks showed similar effects by sex and age. Our findings suggest a higher mortality effect of high temperature in areas with lower vegetation in Seoul, Korea.
Keywords: Heat island, Mortality, Temperature, Urban, Vegetation
1. Introduction
In recent decades, the relationship between weather and mortality has been studied throughout the world, indicating substantial health burden from extreme temperatures (Curriero et al., 2002; Iniguez et al., 2010; Medina-Ramon et al., 2006; Smoyer et al., 2000; Son et al., 2011, 2012, 2016). Given anticipated increases in temperature from overall global warming and urbanization, understanding the health impacts of weather under a changing climate and determinants of these associations is critical to protect public health. Previous findings have shown that urban areas are particularly vulnerable to heat-related health outcomes due to the urban heat island effect (Burkart et al., 2014; Kovats and Koppe, 2005; Tan et al., 2010; Wong et al., 2013). The urban heat island effect results in temperatures that are higher in urban areas than in surrounding rural or suburban areas and could exacerbate the effects of weather under global climate change. Many large cities show a heat island effect, with temperatures 1-3°C warmer than surrounding rural areas (EPA, 2016). The urban heat island effect could intensify extreme climatic events such as heat waves (Buechley et al., 1972; Patz et al., 2005; Smoyer, 1998). Thus, it is crucial to better understand the effect of temperature and health in urban areas in order to design policies for the present day and to establish mitigation and adaptation strategies for the future under climate change.
Many studies observed higher risk of heat-related health outcomes in urban areas compared to other regions (Gabriel and Endlicher, 2011; Goggins et al., 2012). Tan et al. (2010) examined daily all-cause summer mortality rates in 11 urban, suburban, and exurban regions (1998-2004) in Shanghai. They reported different degrees of warming in different locations (city center or surroundings) and a higher heat-related mortality effect in urban regions. A study in Italy reported increased risks of death in urban regions compared to suburban or rural areas during the heat waves (Conti et al., 2005). Rydman et al. (1999) estimated higher risk for heat-related hospital admissions in the city than the suburbs. In a study in Switzerland, heat wave mortality in urban areas was higher than in suburban areas (Grize et al., 2005). Song et al. (2015) evaluated how the degree of urbanization (urban, semirural, and rural) affects the prevalence of allergic sensitization and self-reported rhinitis symptoms in the elderly population in Korea. They reported positive associations between degree of urbanization with allergic sensitization and self-reported rhinitis symptoms.
Several previous studies found similar or even larger intra-urban temperature differences than urban-rural differences. Buyantuyev and Wu (2010) found heterogeneity of surface temperature patterns and high local gradients inside the Phoenix metropolitan area. They also found high correlation between daytime temperatures and neighborhood socioeconomic status (i.e., median family income). Gaffin et al. (2008) reported intra-city heat island variations in residential areas in New York City. Moreover, impacts of heat on mortality vary within a city due to differences such as in urban characteristics and socioeconomic status (Bell et al., 2008; Dadvand et al., 2012; Huang et al., 2011; O'Neill et al., 2003; Son et al., 2011; Stafoggia et al., 2006). Harlan et al. (2013) investigated neighborhood effects of population characteristics and features of the built and natural environments on heat exposure death in Arizona. They found substantial variability of risk to heat-related mortality between neighborhoods, with reduced heat vulnerability and fewer deaths in neighborhoods with higher income and education, younger white populations, greener landscapes, air conditioning, and cooler microclimates.
Urban vegetation may affect the climate and energy use of the city and reduce the temperature in urban areas through the shading of vegetation, evaporation from soils, and transpiration from plants (Akbari et al., 2001; Solecki et al., 2005; Susca et al., 2011). Shading of vegetation can block the sunlight to buildings and lead to reduced ground and wall surface temperature. Urban plants and trees are capable of cooling the air by evapotranspiration and decreasing wind speed. In addition, urban trees and green roofs may influence the energy use for cooling. Many studies reported an inverse relationship between green areas and temperature, indicating a mitigation effect of urban vegetation on the urban heat island (Akbari et al., 2001; Solecki et al., 2005; Susca et al., 2011; Taha et al., 1988).
The global urban population is growing rapidly, and about 66% of the world's population will live in urban areas by 2050 (United Nations, 2014). Asia is the most rapidly growing region in the world and South Korea has experienced expansive urbanization along with rapid economic growth and industrialization. With rapid urbanization in South Korea during the period 1973-2001, the average annual daily maximum temperature has increased by 3.3°C in Seoul over the 29-year period (Kim and Baik, 2004). However, limited studies in South Korea investigated the effect of urbanization on health outcomes although a few studies have examined the spatial and temporal patterns of the urban heat island (Chung et al., 2004; Kim and Baik, 2004; Kim and Baik, 2005).
In this study, we evaluated the effects of urban vegetation as an (inverse) indicator of urbanization on heat-related mortality in Seoul, Korea, and investigated whether different levels of urban vegetation and individual characteristics affect the heat-mortality associations in Seoul, Korea 2000-2009. We divided districts of Seoul into 3 groups based on urban vegetation of each area and estimated the relationship between heat and total mortality by urban vegetation group. Also, we evaluated whether the effect modification of the association between heat and total mortality by urban vegetation differs by individual characteristics of sex and age.
2. Methods
2.1 Data
Urban vegetation is the most significant indicator of surface temperature and has been widely used to describe the urban heat island effect (Weng et al., 2004). We assessed urban vegetation using the Normalized Difference Vegetation Index (NDVI) derived from the Moderate Resolution Imaging Spectroradiometer (MODIS) sensor aboard the Terra satellite image from NASA's Earth Observing System. Earlier studies have used the NDVI as an indicator of urban green vegetation (James P et al. 2015; Yuan and Bauer 2007). Higher NDVI indicates a larger fraction of urban vegetation, and NDVI values range from -1 to +1, with +1 representing a high density of green and -1 indicating water features (Weier and Herring, 2000). We converted NDVI values to a percentage scale. We used the global MODIS product MOD13Q1 Version 005. This product is from Terra sensor for a 16-day composite image at 250m spatial resolution in the sinusoidal projection using the version 5 data (Huete et al., 2002). NDVI data include the warm months (May to September) for the years 2000-2009 and encompass 110 NDVI images, with each image constituting a 16-day period. Processing and aggregation of NDVI data was conducted using the ArcGIS 10.2 Geographical Information System (GIS) (ESRI, Redlands, CA) software. A gu is an administrative unit in South Korea, which is equivalent to district in the West. Most cities are divided into gu. Gus are similar to boroughs in Western countries, and there are 25 gus in Seoul. Details about the administrative units in Korea (e.g., gu) can be found in our previous study (Son et al. 2015). For each of the 25 gus, we calculated long-term NDVI for May-September, 2000-2009.
Hourly levels of particulate matter with aerodynamic diameter ≤10 μm (PM10) and ozone (O3) were obtained for 27 monitoring stations in Seoul operated by the Department of Environment, Republic of Korea during the whole study period. PM2.5 data were not available. For 23 gus, one monitor was available for each gu; for two gus (Songpa and Guro) two monitors per gu were available during the study period. We used 24-h averages as the exposure index for PM10 for each day for each monitor. For O3, we calculated the maximum daily 8-h moving average as the exposure index. The National Meteorological Administration, Republic of Korea, provided hourly measurements of ambient temperature and relative humidity for Seoul during the study period. We converted weather data into 24-h values. Daily levels of PM10, O3 (daily 8-h maximum), temperature, and relative humidity were calculated separately for each gu.
We obtained daily counts of death for each gu in Seoul between January 1, 2000 and December 31, 2009 from the National Statistical Office, Republic of Korea. Mortality data included date of death, address of residence at the gu level, sex, and age. We considered total mortality as all causes of death except external causes (International Classification of Diseases, ICD-10, A00-R99). Age was categorized as <65 and ≥65 years.
Socioeconomic and demographic data at the gu level for 2009 were obtained from Seoul Statistics, Seoul Metropolitan Government. We considered percentage of residents older than 65 years of age, percentage of residents receiving social benefits as a proxy for socioeconomic status (SES), population size, and area of each gu.
2.2 Statistical analysis
To estimate the association between daily exposure to heat and daily mortality, we applied an over-dispersed Poisson generalized linear model with natural cubic splines for time to adjust for temporal trends and meteorology to allow non-linear associations. We categorized the 25 gus into 3 NDVI groups based on average NDVI score during May-September, 2000-2009 as low, medium, and high with approximately one-third of the gus in each category. We included an interaction term between temperature and an indicator of NDVI group for each gu to assess the potential effect modification of the temperature-mortality association by urban vegetation. The model included the following variables: time trends (natural cubic spline of a variable representing time to adjust for long-term and seasonal trends, with 7 degrees of freedom (df) per year), day of the week, relative humidity (natural cubic spline of humidity, with 4 df), daily PM10 and O3 concentrations, indicator of NDVI group for each gu, percentage of persons >65 years of age in each gu, percentage of persons receiving social benefits as a proxy for socioeconomic status (SES) in each gu, offset term for the population size in each gu, area of each gu, and an interaction term between temperature and NDVI group indicator. We considered lag structure of temperature on the average of same day and previous day (lag01). For air pollution, we used levels for the same day (lag 0).
Heat-related temperature effects were estimated by modeling temperature as a segmented linear variable using the 90th percentile of temperature as the threshold (25.1°C). Results were presented as the percentage change in risk of total mortality for a 1°C increase in temperature above the threshold (90th percentile or 25.1°C).
We conducted stratified analysis to explore whether temperature-mortality associations are affected by individual characteristics of sex or age. We estimated the relationship between heat and total mortality in models without considering urban vegetation to assess the effect modification by individual characteristics. Separate models were fitted for sex and age. We also examined whether the effect modification of the association between heat and total mortality by urban vegetation is affected by individual characteristics (i.e., sex, age). All analyses were conducted using R 2.10.1 (R Foundation for Statistical Computing, Vienna, Austria).
3. Results
Fig. 1 shows the study area and the distribution of urban vegetation at the gu level in Seoul, where “gu” is a spatial unit similar to a borough in Western countries. The range of long-term average NDVI across gus is from 28.3 to 61.3%. Table 1 provides summary statistics of NDVI, gu characteristics, and air pollution by NDVI group. The mean NDVI is 54.2, 43.9, and 34.1% for high, medium, and low NDVI group, respectively. Gus with higher NDVI tended to have lower population density and percentage of the population more than 65 years of age. Percentage the population receiving social benefits and air pollution concentration by NDVI group showed similar spatial patterns with slightly higher levels in the gus with higher vegetation.
Fig. 1. Map of the average NDVI distribution in 25 gus in Seoul, Korea.
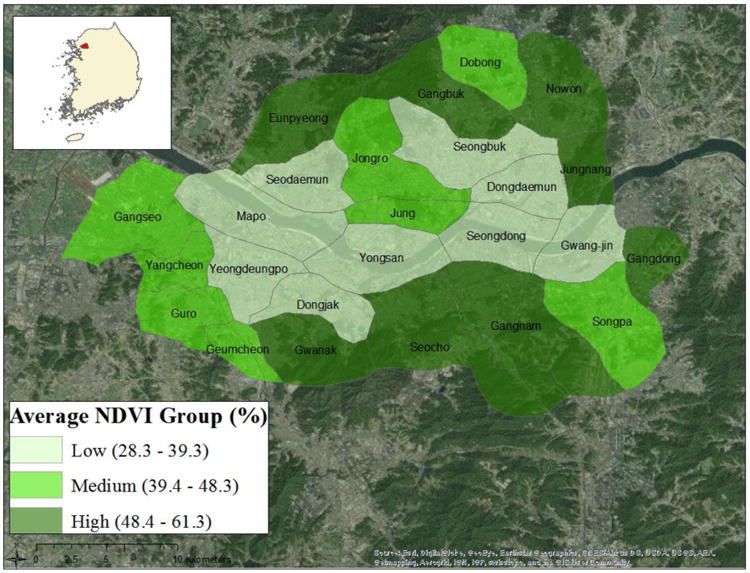
Table 1. Descriptive statistics of NDVI, community characteristics and pollution level by NDVI group in Seoul, Korea, 2000-2009.
| NDVI (%) | |||
|---|---|---|---|
|
| |||
| Low (<39.4%) | Medium (39.4-48.3%) | High (>48.3%) | |
| NDVI Mean (SD) | 34.1% (3.8) | 43.9% (3.4) | 54.2% (4.4) |
| Gu characteristics | |||
| Percentage of persons >65 years | 9.5% (1.0) | 8.7% (1.7) | 8.4% (1.3) |
| Percentage of persons receiving social benefits | 1.8% (0.3) | 2.0% (0.9) | 2.1% (0.9) |
| Population density [N/km2] | 19,869 (4622) | 18,196 (6486) | 16,525 (4308) |
| Pollution | |||
| PM10 (μg/m3) | 61.4 (47.4) | 62.1 (46.7) | 63.3 (46.3) |
| O3 (ppb) | 27.0 (17.1) | 28.7 (17.9) | 29.9 (17.9) |
Supplementary Material, Table S1 shows yearly and long-term average NDVI for each gu in Seoul for 2000 to 2009. Average NDVI by gu showed little variation by time across the whole study period although there was some spatial variation by gu.
Table 2 shows the percentage change in risk of total mortality for a 1°C increase in temperature above 25.1°C by NDVI group. The association between temperature and total mortality was the highest for gus with low NDVI. The heat effect was a 4.1% (95% confidence interval (CI) 2.3, 5.9%), 3.0% (95% CI 0.2, 5.9%), and 2.2% (95% CI -0.5, 5.0%) increase in mortality risk for low, medium, and high NDVI group, respectively.
Table 2.
Percentage change in risk of total mortality for a 1°C increase in temperature (lag01) above the threshold (90th (25.1°C) percentile), by NDVI group.
| NDVI level | Estimate (%) (95% CI) |
|---|---|
| Low (<39.4%) | 4.1 (2.3, 5.9) |
| Medium (39.4-48.3%) | 3.0 (0.2, 5.9) |
| High (>48.3%) | 2.2 (-0.5, 5.0) |
Model included time trend, day of the week, relative humidity, NDVI group, percentage of persons >65 years, percentage receiving social benefits as a proxy for socioeconomic status (SES), offset term for the population size in each gu, PM10 and O3 concentrations in each gu level, area of each gu level, interaction term between temperature and NDVI group.
We estimated the relationship between heat and total mortality in separate models without considering urban vegetation to assess the effect modification by individual characteristics within the whole population. Associations between heat and total mortality were slightly higher in women than men, and higher in people more than 65 years of age than in those <65 years, although results were not statistically different (Supplementary Material, Table S2). We also investigated whether trends in the temperature-mortality relationship by sex or age was robust within each NDVI group. Estimates for stratified analysis by NDVI group showed similar patterns except for estimates by sex in the medium NDVI group (Supplementary Material, Table S2). In other words, we did not observe statistically different effect estimates for temperature and mortality by sex or age, but results are suggestive of higher temperature-mortality effects for older persons than younger persons, and this trend remains across all NDVI groups.
To examine whether the potential effect modification of the heat-mortality association by urban vegetation suggested in Table 2 is affected by individual characteristics (i.e., sex, age), we conducted stratified analyses by sex and age. Table 3 shows the percentage change in total heat-related mortality risk by NDVI group and individual characteristics. In women, associations between heat and total mortality were higher in lower NDVI groups. For people more than 65 years of age, heat-mortality effect estimates were highest for the low NDVI group. In other words, we observed indication that effect modification of the temperature-mortality relationship by urban vegetation (higher heat-temperature mortality effect estimates for lower levels of urban vegetation) remained for women or for people more than 65 years of age.
Table 3. Percentage change in risk of total mortality for a 1°C increase in temperature (lag01) above the threshold (90th (25.1°C) percentile) by NDVI group, stratified by individual characteristics.
| NDVI | |||
|---|---|---|---|
|
| |||
| Low (<39.4%) | Medium (39.4-48.3%) | High (>48.3%) | |
| Sex | |||
| Male | 2.2 (0.1, 4.4) | 2.8 (-0.5, 6.3) | 1.3 (-1.9, 4.6) |
| Female | 3.8 (1.6, 6.1) | 2.3 (-1.2, 5.8) | 1.9 (-1.4, 5.4) |
| Age | |||
| <65 | 0.3 (-1.9, 2.7) | -0.5 (-4.0, 3.2) | -0.6 (-4.0, 3.0) |
| 65+ | 3.7 (1.6, 5.8) | 2.9 (-0.3, 6.2) | 3.4 (0.3, 6.6) |
4. Discussion
In this study, we observed that associations between heat and total mortality differed by level of urban vegetation in Seoul, Korea, with higher effect estimates for lower levels of urban vegetation. Our findings are supportive of our hypothesis that the association between heat and mortality was lower in the high NDVI group, indicating the mitigation of heat effects on mortality by urban vegetation. We also examined whether the mitigation of the association between heat and total mortality by urban vegetation is affected by individual characteristics and found that higher effect estimates for lower levels of urban vegetation remained for women and people more than 65 years of age.
Previous findings showed that high temperature or heat-related health outcomes may differ by urban neighborhoods, population characteristics, and adaptive resources such as air conditioning, cooling centers. A U.S. study found statistically significant differences in temperatures and human thermal comfort index as an indicator of heat stress between the neighborhoods in 8 diverse city neighborhoods during the summer of 2003 in Phoenix. Neighborhoods with high population density, sparse vegetation, and no open space had higher temperatures and were significantly correlated with human thermal comfort index (Harlan et al., 2006). Stone et al. (2010) found that the rate of increase in extreme heat events is higher in sprawling areas than in more compact metropolitan regions, an association that is independent of climate zone, metropolitan population size, or the rate of metropolitan population growth. Solecki et al. (2005) examined mitigation of the heat island effect in urban New Jersey and found that urban vegetation can lower health hazards associated with the urban heat island effect by removing pollutants from the air. Burkart et al. (2016) found that urban vegetation and proximity to water were associated with decreased heat-related mortality in the elderly population in Lisbon. On the other hand, a study conducted in Australia found that the proportion of vegetation or developed land were not a significant factor in explaining heat-related mortality among the elderly (Vaneckova et al., 2010). Sheridan and Dolney (2003) examined heat vulnerability on mortality across Ohio on a county-level basis classified as urban, suburban, or rural. They reported that rural and suburban counties showed a higher mortality rate than urban areas. These studies show that urban areas and vegetation may impact heat-mortality associations. Differences in study design with respect to how urban vegetation or urban area was designated may explain inconsistent findings of previous studies. Thus, more research is needed to clarify the relationship between urban vegetation and heat-related health outcomes, particularly with respect to the methods used to define urbanicity and vegetation and whether results differ by region, population, or adaptive resources.
Previous studies have suggested that heat-related mortality is higher for some vulnerable subpopulations. Elderly or children, pregnant women, people with underlying disease, people who lack access to cool environment or medical care and resources, and persons living in poverty are reported to be at potentially higher risk for heat-related mortality (Luber and McGeehin, 2008; Balbus and Malina, 2009). Our study investigated whether the effect modification of the association between heat and total mortality by urban vegetation differs by individual characteristics of sex and age. Estimated effects for heat and mortality were higher for women and people more than 65 years of age. Also, these associations were higher in women or people more than 65 years of age living in lower vegetation area than those living in higher vegetation area. The elderly are more likely to have a greater risk of heat-related mortality due to preexisting diseases, limited mobility, living lone and lack of access to several resources.
Moreover, interaction among potential risk factors could worsen these associations. People with lower socioeconomic status and ethnic minority groups tended to live in the same neighborhood (Harlan et al., 2006). Wong et al. (2013) reported that population between the ages of 65 and 74, people unmarried or living alone, population suffering from chronic disease or psychiatric disorders, and women in the 75+ age group were more vulnerable to heat.
Urban environments have complexities of correlated physical characteristics and socioeconomic factors that can affect the associations between heat exposure and health outcomes. Within the urban environment, a combination of social and environmental factors could play an important role. Thus, the urban heat island effect should be considered along with several factors such as socioeconomic status. Our analysis adjusted by socioeconomic and demographic factors of each community such as the percentage of people more than 65 years of age and the percentage of people receiving social benefits in each gu as a proxy for SES. Luber and McGeehin (2008) reviewed major epidemiologic risk factors associated with heat-related mortality and confirmed that several features of the built environment and urban sociodemographics such as housing type, neighborhood land use, and access to cooling centers or other resources have been shown to affect the heat-related mortality association. A study in U.S. suggested that social vulnerability to heat is associated with the ability to modify land cover by vegetation and to live at lower urban densities. They also showed that higher social and economic status mitigates heat stress for those living in low-density housing with much vegetation (Jenerette et al., 2007). Another study in the U.S. evaluated neighborhood effects of socio-environmental factors on heat-related death in Arizona. They found substantial variability between neighborhoods in vulnerability to heat, risk, and locations of vulnerable neighborhood clusters. Higher neighborhood income and education, younger white populations, greener landscapes, air conditioning, and cooler microclimates in suburban neighborhoods were associated with reduced heat vulnerability and fewer deaths (Harlan et al., 2013). Harlan et al. (2006) reported that people with lower socioeconomic status are more likely to live in warmer neighborhoods and these people were more vulnerable to heat exposure due to greater exposure to heat stress and lower availability of adaptive resources to mitigate it. These studies show that several social and urban environmental factors may impact heat-related mortality associations.
A limitation of our study is that we used ambient meteorological data from one monitoring site for all gus due to data availability. Seoul has only one monitoring site for meteorological conditions. Thus, future study is needed to include more local and regional meteorological data to assess within-city differences. Also, due to data availability our study did not include air conditioning, which may vary by gu or subpopulation. Use of air conditioning has been associated with lower heat-related health outcomes (Wong et al., 2013). It is important to consider the urban density to investigate the potential effect modification of the temperature-mortality association by urban vegetation. In this study, we investigated differences in heat-related mortality adjusted by urban density at the gu level. We adjusted for several variables including socioeconomic status, population size and area of each gu in the model to account for potential confounders. However, we were not able to look at smaller spatial units because the gu data we used in this study is the best (the smallest) spatial resolution for such data in Korea and we do not have any urban density data (e.g., building density) at smaller spatial resolution. Thus, future work is needed to consider smaller units of urban density. Strengths of this study include the investigation of the intra-urban analysis of the heat-related mortality and the possible mitigation effect by urban vegetation at local level. This is the first study to investigate the effects of urban vegetation on heat-related mortality and evaluate whether different levels of urban vegetation and individual characteristics affect the heat-mortality associations in Seoul, Korea.
5. Conclusions
In conclusion, we observed a trend of lower heat-mortality associations with higher urban vegetation in Seoul, South Korea. We also observed suggestive findings that higher effect estimates for lower levels of urban vegetation remained for women and people more than 65 years of age. Our analyses could provide scientific information for planning the mitigation and adaptation strategies for future climate change. However, more research in other urban areas with different urban characteristics and climate using more localized data is still needed.
Supplementary Material
Highlights.
Associations between heat and total mortality differed by level of urban vegetation.
We observed higher effect estimates for lower levels of urban vegetation.
The mitigation of the association is affected by individual characteristics.
Higher effects for lower vegetation remained for women and 65+ age group.
Acknowledgments
Funding: This work was supported by the U.S. National Institutes of Health (NIEHS R01ES019560, R21ES020152, R21ES022585).
Abbreviations
- GIS
Geographical Information System
- ICD-10
International Classification of Diseases Tenth Revision
- MODIS
Moderate Resolution Imaging Spectroradiometer
- NDVI
Normalized Difference Vegetation Index
- O3
ozone
- PM10
particulate matter with aerodynamic diameter ≤10 μm
- SES
socioeconomic status
Footnotes
Conflicts of interest: The authors declare no competing interests.
Publisher's Disclaimer: This is a PDF file of an unedited manuscript that has been accepted for publication. As a service to our customers we are providing this early version of the manuscript. The manuscript will undergo copyediting, typesetting, and review of the resulting proof before it is published in its final citable form. Please note that during the production process errors may be discovered which could affect the content, and all legal disclaimers that apply to the journal pertain.
References
- Akbari H, Pomerantz M, Taha H. Cool surfaces and shade trees to reduce energy use and improve air quality in urban areas. Solar Energy. 2001;70(3):295–310. [Google Scholar]
- Balbus JM, Malina C. Identifying vulnerable subpopulations for climate change health effects in the United States. J Occup and Environ Med. 2009;51:33–37. doi: 10.1097/JOM.0b013e318193e12e. [DOI] [PubMed] [Google Scholar]
- Burkart K, Meier F, Schneider A, Breitner S, Canario P, Alcoforado M João, et al. Modification of heat-related mortality in an elderly urban population by vegetation (urban green) and proximity to water (urban blue): Evidence from Lisbon, Portugal. Environmental Health Perspectives. 2016 doi: 10.1289/ehp.1409529. [DOI] [PMC free article] [PubMed] [Google Scholar]
- Bell ML, O'Neill MS, Ranjit N, Borja-Aburto VH, Cifuentes LA, Gouveia NC. Vulnerability to heat-related mortality in Latin America: a case-crossover study in Sao Paulo, Brazil, Santiago, Chile and Mexico City, Mexico. Int J Epidemiol. 2008;37:796–804. doi: 10.1093/ije/dyn094. [DOI] [PMC free article] [PubMed] [Google Scholar]
- Buechley RW, Van Bruggen J, Truppi LE. Heat island equals death island? Environ Res. 1972;5(1):85–92. doi: 10.1016/0013-9351(72)90022-9. [DOI] [PubMed] [Google Scholar]
- Burkart K, Breitner S, Schneider A, Khan MM, Krämer A, Endlicher W. An analysis of heat effects in different subpopulations of Bangladesh. Int J Biometeorol. 2014;58(2):227–237. doi: 10.1007/s00484-013-0668-5. [DOI] [PubMed] [Google Scholar]
- Buyantuyev A, Wu J. Urban heat islands and landscape heterogeneity: linking spatiotemporal variations in surface temperatures to land-cover and socioeconomic patterns. Landscape Ecol. 2010;25:17–33. [Google Scholar]
- Chow WTL, Chuang WC, Gober P. Vulnerability to extreme heat in metropolitan Phoenix: Spatial, temporal, and demographic dimensions. The Professional Geographer. 2012;64(2):286–302. [Google Scholar]
- Chung U, Choi J, Yun JI. Urbanization Effect on the Observed Change in Mean Monthly Temperatures between 1951-1980 and 1971-2000 in Korea. Climate Change. 2004;66(1):127–136. [Google Scholar]
- Conti S, Meli P, Minelli G, Solimini R, Toccaceli V, Vichi M, et al. Epidemiologic study of mortality during the Summer 2003 heat wave in Italy. Environ Res. 2005;98(3):390–399. doi: 10.1016/j.envres.2004.10.009. [DOI] [PubMed] [Google Scholar]
- Curriero FC, Heiner KS, Samet JM, Zeger SL, Strug L, Patz JA. Temperature and mortality in 11 cities of the eastern United States. Am J Epidemiol. 2002;155:80–87. doi: 10.1093/aje/155.1.80. [DOI] [PubMed] [Google Scholar]
- Dadvand P, de Nazelle A, Figueras F, Basagaña X, Su J, Amoly E, et al. Green space, health inequality and pregnancy. Environ Int. 2012;40:110–115. doi: 10.1016/j.envint.2011.07.004. [DOI] [PubMed] [Google Scholar]
- Gabriel KMA, Endlicher WR. Urban and rural mortality rates during heat waves in Berlin and Brandenburg, Germany. Environ Pollut. 2011;159:2044–2050. doi: 10.1016/j.envpol.2011.01.016. [DOI] [PubMed] [Google Scholar]
- Goggins WB, Chan EYY, Ng E, Ren C, Chen L. Effect modification of the association between short-term meteorological factors and mortality by urban heat islands in Hong Kong. PLoS ONE. 2012;7(6):e38551. doi: 10.1371/journal.pone.0038551. [DOI] [PMC free article] [PubMed] [Google Scholar]
- Gaffin SR, Rosenzweig C, Khanbilvardi R, Parshall L, Mahani S, Glickman H, et al. Variations in New York city's urban heat island strength over time and space. Theor Appl Climatol. 2008;94:1–11. [Google Scholar]
- Grize L, Huss A, Thommen O, Schindler C, Braun-Fahrländer C. Heat wave 2003 and mortality in Switzerland. Swiss Med Wkly. 2005;135:200–205. doi: 10.4414/smw.2005.11009. [DOI] [PubMed] [Google Scholar]
- Harlan SL, Declet-Barreto JH, Stefanov WL, Petitti DB. Neighborhood effects on heat deaths: social and environmental predictors of vulnerability in Maricopa County, Arizona. Environ Health Perspect. 2013;121(2):197–204. doi: 10.1289/ehp.1104625. [DOI] [PMC free article] [PubMed] [Google Scholar]
- Harlan SL, Brazel AJ, Prashad L, Stefanov WL, Larsen L. Neighborhood microclimates and vulnerability to heat stress. Social Science & Medicine. 2006;63:2847–2863. doi: 10.1016/j.socscimed.2006.07.030. [DOI] [PubMed] [Google Scholar]
- Huang G, Zhou W, Cadenasso ML. Is everyone hot in the city? Spatial pattern of land surface temperatures, land cover and neighborhood socioeconomic characteristics in Baltimore, MD. J Environ Manage. 2011;92:1753–1759. doi: 10.1016/j.jenvman.2011.02.006. [DOI] [PubMed] [Google Scholar]
- Huete AR, Didan K, Miura T, Rodriguez EP, Gao X, Ferreira LG. Overview of the radiometric and biophysical performance of the MODIS vegetation indices. Remote Sens Environ. 2002;83:195–213. [Google Scholar]
- Iñiguez C, Ballester F, Ferrandiz J, Pérez-Hoyos S, Sáez M, López A. Relation between temperature and mortality in thirteen Spanish cities. Int J Environ Res Public Health. 2010;7:3196–210. doi: 10.3390/ijerph7083196. [DOI] [PMC free article] [PubMed] [Google Scholar]
- James P, Banay RF, Hart JE, Laden F. A review of the health benefits of greenness. Current Epidemiology Reports. 2015;2(2):131–142. doi: 10.1007/s40471-015-0043-7. [DOI] [PMC free article] [PubMed] [Google Scholar]
- Jenerette GD, Harlan SL, Brazel A, Jones N, Larsen L, Stefanov WL. Regional relationships between surface temperature, vegetation, and human settlement in a rapidly urbanizing ecosystem. Landscape Ecol. 2007;22:353–365. [Google Scholar]
- Kim YH, Baik JJ. Maximum urban heat island intensity in Seoul. J Appl Meteorol. 2002;41:651–659. [Google Scholar]
- Kim YH, Baik JJ. Daily maximum urban heat island intensity in large cities of Korea. Theor Appl Climatol. 2004;79:151–164. [Google Scholar]
- Kim YH, Baik JJ. Spatial and Temporal Structure of the Urban Heat Island in Seoul. J Appl Meteor. 2005;44:591–605. [Google Scholar]
- Kovats RS, Koppe C. Heat waves: past and future impacts on health. In: Ebi KL, Smith JB, Burton I, editors. Integration of Public Health with Adaptation to Climate Change. New York: Taylor and Francis; 2005. [Google Scholar]
- Markevych I, Thiering E, Fuertes E, Sugiri D, Berdel D, Koletzko S, et al. A cross-sectional analysis of the effects of residential greenness on blood pressure in 10-year old children: results from the GINIplus and LISAplus studies. BMC Public Health. 2014;14:477–487. doi: 10.1186/1471-2458-14-477. [DOI] [PMC free article] [PubMed] [Google Scholar]
- Medina-Ramon M, Zanobetti A, Cavanagh DP, Schwartz J. Extreme temperatures and mortality: assessing effect modification by personal characteristics and specific cause of death in a multi-city case-only analysis. Environ Health Perspect. 2006;114:1331–1336. doi: 10.1289/ehp.9074. [DOI] [PMC free article] [PubMed] [Google Scholar]
- NASA's Earth Observing System. http://reverb.echo.nasa.gov.
- O'Neill MS, Zanobetti A, Schwartz J. Modifiers of the temperature and mortality association in seven US cities. Am J Epidemiol. 2003;157:1074–1082. doi: 10.1093/aje/kwg096. [DOI] [PubMed] [Google Scholar]
- Papanastasiou D, Melas D, Bartzanas T, Kittas C. Temperature, comfort and pollution levels during heat waves and the role of sea breeze. Int J Biometeorol. 2010;54(3):307–317. doi: 10.1007/s00484-009-0281-9. [DOI] [PubMed] [Google Scholar]
- Patz JA, Campbell-Lendrum D, Holloway T, Foley JA. Impact of regional climate change on human health. Nature. 2005;438(7066):310–317. doi: 10.1038/nature04188. [DOI] [PubMed] [Google Scholar]
- Price JC. Assessment of the urban heat island effect through the use of satellite data. Monthly Weather Review. 1979;107:1554–1557. [Google Scholar]
- Rydman RJ, Rumoro DP, Silva JC, Hogan TM, Kampe LM. The rate and risk of heat-related illness in hospital emergency departments during the 1995 Chicago heat disaster. J Med Syst. 1999;23:41–56. doi: 10.1023/a:1020871528086. [DOI] [PubMed] [Google Scholar]
- Seoul Statistics. Seoul Metropolitan Government. http://stat.seoul.go.kr/
- Sheridan SC, Dolney TJ. Heat, mortality, and level of urbanization: measuring vulnerability across Ohio, USA. Climate Research. 2003;24:255–265. [Google Scholar]
- Smoyer KE. Putting risk in its place: methodological considerations for investigating extreme event health risk. Soc Sci Med. 1998;47:1809–1824. doi: 10.1016/s0277-9536(98)00237-8. [DOI] [PubMed] [Google Scholar]
- Smoyer KE, Rainham DGC, Hewko JN. Heat-stress-related mortality in five cities in Southern Ontario:1980-1996. Int J Biometeorol. 2000;44:190–197. doi: 10.1007/s004840000070. [DOI] [PubMed] [Google Scholar]
- Solecki WD, Rosenzweig C, Parshall L, Pope G, Clark M, Cox J, et al. Mitigation of the heat island effect in urban New Jersey. Global Environmental Change Part B: Environmental Hazards. 2005;6(1):39–49. [Google Scholar]
- Son JY, Kim H, Bell ML. Does urban land-use increase risk of asthma symptoms? Environmental Research. 2015;142:309–318. doi: 10.1016/j.envres.2015.06.042. [DOI] [PubMed] [Google Scholar]
- Son JY, Lee JT, Anderson GB, Bell ML. Vulnerability to temperature-related mortality in Seoul, Korea. Environ Res Lett. 2011;6:034027. doi: 10.1088/1748-9326/6/3/034027. [DOI] [PMC free article] [PubMed] [Google Scholar]
- Son JY, Lee JT, Anderson GB, Bell ML. The impact of heat waves on mortality in seven major cities in Korea. Environ Health Perspect. 2012;120:566–571. doi: 10.1289/ehp.1103759. [DOI] [PMC free article] [PubMed] [Google Scholar]
- Son JY, Gouveia N, Bravo MA, de Freitas CU, Bell ML. The impact of temperature on mortality in a subtropical city: effects of cold, heat, and heat waves in São Paulo, Brazil. Int J Biometeorol. 2016;60(1):113–121. doi: 10.1007/s00484-015-1009-7. [DOI] [PMC free article] [PubMed] [Google Scholar]
- Song IJ, Hong SK, Kim HO, Byun B, Gin Y. The pattern of landscape patches and invasion of naturalized plants in developed areas of urban Seoul. Landscape and Urban Planning. 2005;70:205–219. [Google Scholar]
- Song WJ, Sohn KH, Kang MG, Park HK, Kim MY, Kim SH, et al. Urban-rural differences in the prevalence of allergen sensitization and self-reported rhinitis in the elderly population. Ann Allergy Asthma Immunol. 2015;114(6):455–461. doi: 10.1016/j.anai.2015.03.008. [DOI] [PubMed] [Google Scholar]
- Stafoggia M, Forastiere F, Agostini D, Biggeri A, Bisanti L, Cadum E, et al. Vulnerability to heat-related mortality: a multicity, population-based, casecrossover analysis. Epidemiology. 2006;17:315–323. doi: 10.1097/01.ede.0000208477.36665.34. [DOI] [PubMed] [Google Scholar]
- Susca T, Gaffin SR, Dell'Osso GR. Positive effects of vegetation: Urban heat island and green roofs. Environmental Pollution. 2011;159:2119–2126. doi: 10.1016/j.envpol.2011.03.007. [DOI] [PubMed] [Google Scholar]
- Taha H, Akbari H, Rosenfeld A, Huang J. Residential cooling loads and the urban heat island-the effects of albedo. Building and Environment. 1988;23(4):271–283. [Google Scholar]
- Tan J, Zheng Y, Tang X, Guo C, Li L, Song G, et al. The urban heat island and its impact on heat waves and human health in Shanghai. Int J Biometeorol. 2010;54(1):75–84. doi: 10.1007/s00484-009-0256-x. [DOI] [PubMed] [Google Scholar]
- United Nations. World urbanization prospects: The 2014 revision. New York: NY: United Nations 2014; 2014. Department of Economic and Social Affairs, Population Division. [Google Scholar]
- U.S. Environmental Protection Agency. Heat island effect. [accessed 11 April 2016];2016 Available: http://www.epa.gov/heat-islands.
- Weier J, Herring D Measuring vegetation (NDVI & EVI) [accessed 20 Feb 2016];2000 Available: http://earthobservatory.nasa.gov/Features/MeasuringVegetation/
- Weng Q, Dengsheng L, Jacquelyn S. Estimation of land surface temperature-vegetation abundance relationship for urban heat island studies. Remote Sensing of Environment. 2004;89:467–483. [Google Scholar]
- Wong KV, Paddon A, Jimenez A. Review of world urban heat islands: Many linked to increased mortality. Journal of Energy Resources Technology. 2013;135:022101. [Google Scholar]
- Yuan F, Bauer ME. Comparison of impervious surface area and normalized difference vegetation index as indicators of surface urban heat island effects in Landsat imagery. Remote Sensing of Environment. 2007;106:375–386. [Google Scholar]
- Zhao L, Lee X, Smith RB, Oleson K. Strong contributions of local background climate to urban heat islands. Nature. 2014;511(7508):216–219. doi: 10.1038/nature13462. [DOI] [PubMed] [Google Scholar]
- Zhou D, Zhang L, Hao L, Sun G, Liu Y, Zhu C. Spatiotemporal trends of urban heat island effect along the urban development intensity gradient in China. Sci Total Environ. 2015;544:617–626. doi: 10.1016/j.scitotenv.2015.11.168. [DOI] [PubMed] [Google Scholar]
Associated Data
This section collects any data citations, data availability statements, or supplementary materials included in this article.