

Abstract
White matter disease in the brain increases with age and cardiovascular disease, emerging in midlife, and these associations may be influenced by both genetic and environmental factors. We examined the frequency, distribution, and heritability of abnormal white matter and its association with hypertension in 395 middle-aged male twins (61.9 ± 2.6 years) from the Vietnam Era Twin Study of Aging, 67% of whom were hypertensive. A multi-channel segmentation approach estimated abnormal regions within the white matter. Using multivariable regression models, we characterized the frequency distribution of abnormal white matter in midlife and investigated associations with hypertension and Apolipoprotein E-ε4 status and the impact of duration and control of hypertension. Then, using the classical twin design, we estimated abnormal white matter heritability and the extent of shared genetic overlap with blood pressure. Abnormal white matter was predominantly located in periventricular and deep parietal and frontal regions; associated with age (t = 1.9, p = 0.05) and hypertension (t = 2.9, p = 0.004), but not Apolipoprotein ε4 status; and was greater in those with uncontrolled hypertension relative to controlled (t = 3.0, p = 0.003) and normotensive (t = 4.0, p = 0.0001) groups, suggesting that abnormal white matter may reflect currently active cerebrovascular effects. Abnormal white matter was highly heritable (a2 = 0.81) and shared some genetic influences with systolic blood pressure (rA = 0.26), although there was evidence for distinct genetic contributions and unique environmental influences. Future longitudinal research will shed light on factors impacting white matter disease presentation, progression, and potential recovery.
Keywords: White matter, MRI, Brain, Hypertension, Blood pressure, Heritability
Abbreviations: AWM, abnormal white matter; ApoE, apolipoprotein E; SBP, systolic blood pressure; DBP, diastolic blood pressure; HTN, hypertension; BMI, body mass index; LDL, Low; HDL, high-density lipoprotein; CRP, C-Reactive protein; ICV, intracranial vault
Highlights
-
•
White matter abnormalities were highly heritable and associated with hypertension.
-
•
Only some genetic influences were shared with systolic blood pressure.
-
•
There is evidence for unique environmental influences unrelated to hypertension.
-
•
Poorly controlled hypertension was associated with more abnormal white matter.
-
•
Abnormal white matter may reflect currently active cerebrovascular effects.
1. Introduction
The incidence and prevalence of white matter disease increase with age, and white matter damage has been associated with cerebro- and cardiovascular disease, as well as cognitive impairment and even Alzheimer's disease (Bigler et al., 2002, Gunning-Dixon et al., 2009, Gunning-Dixon and Raz, 2000, Valdes Hernandez et al., 2014). Underlying causes of white matter disease include vasculopathy, de-myelination, and gliosis, although the most common cause associated with aging and cerebrovascular disease is ischemic pathogenesis, or small cerebral vessel disease (Fazekas et al., 1993, Gunning-Dixon et al., 2009, Kim et al., 2008). Magnetic resonance imaging (MRI) can detect such damage, providing measures of abnormal white matter (AWM) including white matter hyperintensities of presumed vascular origin, lacunes, and small subcortical infarcts (all hyperintense areas on T2-weighted or FLAIR and iso- or hypo-intense regions on T1) (Wardlaw et al., 2013). By age 90, an individual may have more than six times as much AWM as at age 30 (Jernigan et al., 2001). Little is known, however, about the extent and distribution of AWM specifically within middle-age (~ 50–65 years). Rather, most studies include individuals over the age of 70 or a broad age range (anywhere from late adolescence to 85 years) without large representation of middle-aged individuals. A rating-based study of individuals aged 16–65 reported that those 55 to 65 years of age (n = 31) had a 10-fold increase in prevalence of AWM compared to those 16–54, although AWM was uncommon overall (Hopkins et al., 2006). Studies focused more specifically on midlife, when such abnormalities begin to substantially increase, are necessary to more fully understand factors influencing white matter disease.
Hypertension, a strong risk factor for cerebrovascular disease, has been associated with white matter disease (de Leeuw et al., 2002, Knopman et al., 2011, Liao et al., 1997, Raz et al., 2012, Valdes Hernandez et al., 2014), and shares a similar increase in incidence beginning in midlife (Qiu et al., 2005). Elevated midlife systolic blood pressure (SBP) has been linked to late life structural brain changes and poor cognitive functioning (Swan et al., 1998), which may be particularly severe with uncontrolled hypertension (van Dijk et al., 2004). Hypertension may exacerbate effects of normal aging on the brain (Strassburger et al., 1997), and the study of middle-aged individuals may provide an early window into the association between emerging hypertension and white matter disease.
Understanding the genetic and environmental contributions to white matter disease and the basis of its association with hypertension may be important to better guide prevention and intervention strategies. An early report in older men from the National Heart, Lung, and Blood Institute (NHLBI) Twin study (n = 290; mean age = 72, sd = 2.8) supports a strong genetic contribution (h2 = 0.71) to AWM (Carmelli et al., 1998), and the San Antonio Family Heart Study of healthy Mexican Americans (n = 459; aged 19–85), using a family-based approach, estimated similar heritability (0.72) (Kochunov et al., 2009). Another family/pedigree-based study of both men and women across a broad age range (n = 1330; mean age = 61 years, range 34–88) from the Framingham Heart Study, however, reported somewhat lower heritability (0.55) (Atwood et al., 2004), and heritability tended to increase with age in males (from 0.52 to 0.66). In the Older Australian Twin Study (Sachdev et al., 2013), AWM was highly heritable (0.79) in individuals older than 64 years (n = 404; mean age = 70.8). As individuals age, the relative prominence of genetic versus environmental influences may change. For example, in our evaluation of ventricular volume, the variance of which increases with age as does AWM, we found greater genetic influences later in life (Kremen et al., 2012). Thus, the heritability of AWM among middle-aged adults may differ from the estimates reported in prior studies.
Blood pressure has also been shown to be heritable across a variety of cohorts; estimates range from 0.34 to 0.60 for SBP and 0.34 to 0.67 for diastolic blood pressure (DBP) (No Authors Listed, 1978, Hottenga et al., 2005, van Rijn et al., 2007). There is evidence for shared genetic influences between BP and white matter integrity assessed by diffusion tensor imaging (Kochunov et al., 2011) and AWM volumes (Kochunov et al., 2010) in family/pedigree based studies of broad age range samples (19–79 and 19–85 respectively). These and other studies support the potential influence of complex age-related factors modifying genetic associations and impacting measured white matter disease (Atwood et al., 2004, Kochunov et al., 2010, Kochunov et al., 2011). The present study extends prior work to examine the genetic overlap between BP and AWM within a restricted midlife age range to reduce the influence of potentially complex age-related factors.
Studies of specific genes also may provide insight into the causes of white matter disease. The Apolipoprotein E (ApoE) ε4 allele is of interest due to a relationship with greater risk for cerebrovascular disease, exacerbation of white matter disease in the presence of vascular diseases, and association with increased risk for Alzheimer's disease (DeCarli et al., 1999). Although there is evidence of an association between the ε4 allele and AWM in the context of older age and Alzheimer's disease (Brickman et al., 2014), it is not clear whether ε4 carrier status would have such a direct association in midlife, as there is evidence for complex underlying interactions among factors (Kalmijn et al., 1996).
The purpose of the present study is to define the distribution and heritability of AWM and its phenotypic and genetic associations with hypertension in a community-based sample of middle-aged (aged 56–66 years) male twins from the Vietnam Era Twin Study of Aging (VETSA; Kremen et al., 2013, Kremen et al., 2006). We proposed that AWM would be related to hypertension and that the ApoE-ε4 allele would be associated with more AWM only in the presence of hypertension. We hypothesized that AWM would be more common and worse in individuals with longer duration of hypertension and with uncontrolled hypertension. Finally, using the classical twin design, we estimated the heritability of AWM and the extent of shared genetic and environmental influences between AWM and blood pressure. Findings from this midlife cohort exhibiting emerging white matter disease and hypertension are discussed in the context of existing studies that explore broad age ranges and older cohorts.
2. Materials and methods
2.1. Participants
Participants in the parent VETSA cohort were recruited from the Vietnam Era Twin Registry, a nationally distributed sample of male-male twin pairs who served in the United States military at some point between 1965 and 1975 (Goldberg et al., 2002), and were in their 50s at initial recruitment (Kremen et al., 2006). The VETSA MRI study is a subset described previously (Kremen et al., 2013, Kremen et al., 2010); during Wave 2, MRI data included protocols for quantitative estimation of white matter disease which are used herein. Participants were similar in health and lifestyle characteristics to American men in their age range (Schoenborn and Heyman, 2009), and most (~ 80%) did not experience combat. Participants traveled either to San Diego or Boston for the study. Informed consent was obtained from all participants, the protocol was approved by Institutional Review Boards at the University of California, San Diego (UCSD), Boston University, and the Massachusetts General Hospital (MGH), and all procedures were in accordance with institutional guidelines. The available sample included 395 individuals: 86 monozygotic (MZ) twin pairs (n = 172); 63 dizygotic (DZ) twin pairs (n = 126); 97 unpaired twins. The average age was 61.9 years (SD = 2.6; range 56–66), most were non-Hispanic white (88%; African American 7%).
2.2. Hypertensive status
SBP and DBP were measured as the average of 2 A.M. and 2 P.M. seated readings with an electronic sphygmomanometer (Omron Model HEM-757/Wave 1; Lifesource Model UA-789 AC/Wave 2). Participants rested for 5 min prior to the first reading in each set, wearing a blood pressure cuff on their dominant arm with their arm resting on a table. Participants rested quietly for 1 min between the paired readings. Hypertension was determined on the basis of SBP ≥ 140 mm Hg, DBP ≥ 90 mm Hg, or self-report of a physician diagnosis. For hypertension analyses, we conservatively excluded individuals (n = 22) who were using hypertensive medication without evidence of use specifically for hypertension, thus, the cross-sectional association of hypertension and AWM was based on 373 individuals.
A subset of these individuals (n = 297) had additional longitudinal data on hypertensive status at Wave 1 approximately 5.5 (SD = 0.5) years earlier. To examine the association of duration of hypertension with AWM, we categorized participants with hypertension at both waves as longer duration and those who met criteria only at Wave 2 as more recent onset. We also categorized participants on the basis of whether their hypertension was controlled (SBP < 140 mm Hg and DBP < 90) or uncontrolled.
2.3. ApoE genotype
ApoE genotype was determined from blood samples using established methods (Emi et al., 1988, Hixson and Vernier, 1990). ApoE-ε4 allele status was available for 385 of the 395 participants, and participants were categorized as to whether or not they carried at least one ε4 allele.
2.4. Health and lifestyle covariates
Height and weight were measured, and body mass index (BMI) calculated. Diabetes status was ascertained from self-report of a doctor's diagnosis or reported use of a diabetes-related medication. Fasting blood samples were obtained for low- and high-density lipoprotein (LDL and HDL), cholesterol, and triglycerides via spectrophotometry, and for C-Reactive protein (CRP) via nephelometry. CRP values of 10 or higher were assumed to reflect acute infection, and these cases (n = 12) were excluded. Samples available included 369 for LDL, 374 for HDL, and 372 for CRP. Assays were conducted by Quest Diagnostics Inc./Nichols Institute, San Juan Capistrano, CA.
2.5. Multi-channel structural MRI protocol and image analysis
T1-, T2-, and proton-density- (PD) weighted images were acquired at UCSD and MGH. UCSD used a GE 3 T Discovery 750 scanner with an 8-channel phased array head coil: sagittal 3D fast spoiled gradient echo (FSPGR) T1 with TE = min/full, TI = 600 ms, flip angle = 8°, FOV = 25.6 cm, frequency = 256, phase = 192, slices = 172, slice thickness = 1.2 mm; a coronal 2D FRFSE-XL T2 with 2 mm slice thickness, FOV = 24 cm, TE = 94 ms, TR = 4.6 s, ETL = 16, frequency = 256, phase = 256, 2 NEX; and a coronal 2D FSE-XL PD with 2 mm slice thickness, FOV = 24 cm, TE = min/full, TR = 3 s, ETL = 4, frequency = 256, phase = 256. MGH used a Siemens 3 T Tim Trio with a 12-channel head coil: sagittal 3D magnetization-prepared rapid gradient-echo (MPRAGE) T1 with TE = 4.3, TR = 2170 ms, TI = 1100 ms, flip angle = 7°, slices = 160, slice thickness = 1.2 mm; a coronal 2D TSE T2 with 2 mm slice thickness, FOV = 24 cm, TE = 93 ms, TR = 4.7 s, ETL = 24, 2 NEX; and a coronal 2D TSE PD with 2 mm slice thickness, FOV = 24 cm, TE = 19 ms, TR = 3 s, ETL = 12.
We used a multi-channel segmentation approach to measure AWM in addition to total cerebral white matter, total gray matter, total cerebrospinal fluid (CSF), and intracranial vault volumes (based on Fennema-Notestine et al., 2013, Jernigan et al., 2011) (Fig. 1). This approach leverages complementary information in three volumes to increase measurement sensitivity while reducing the impact of MR acquisition noise. Steps include standard alignment of the T1 (i.e., 6 degrees-of-freedom, rigid transformation to an anterior/posterior commissure aligned space), registration of T2 and PD to T1 using a mutual information method (based on Maes et al., 1997), bias-correction using N3 (Sled et al., 1998), and a three-class tissue segmentation utilizing Scott's L2E method (Scott, 2001) to determine robust means and covariances for white matter, gray matter, and CSF. AWM was classified using morphological operators (Yoo et al., 2002) to identify voxel clusters originally segmented as gray matter that fell within anatomically defined white matter regions; results were visually reviewed and manually edited when necessary to correct misclassifications. All tissue volumes were measured in each subject's (undeformed) space. Since partial voluming of fluid and white matter along the edges of ventricles results in voxels with AWM-like signal, even in healthy individuals, we did not allow any voxels that touched (i.e., shared a common face, edge, or vertex with) a ventricular fluid voxel to be classified as AWM; such voxels were excluded from the estimated volumes. Following AWM classification, we constructed an AWM frequency atlas to present the anatomical distribution. Each T1 was nonlinearly warped to the MNI-152 atlas (Fonov et al., 2011) using Advanced Normalization Tools (Avants et al., 2011). Then, each subject's four-class (gray, white, CSF, abnormal white) tissue segmentation was warped to MNI-152 space, using nearest neighbor interpolation and the subject specific nonlinear warps calculated for each T1. The value of each voxel in the frequency atlas represents the proportion of subjects across the sample that have AWM at that voxel's location in MNI-152 space.
Fig. 1.

Abnormal white matter. Three example coronal sections, in locations similar to Fig. 2, from one case reflecting approximately the 75th percentile (0.79) of proportion of AWM. Top row: anatomical segmentation; Middle row: T2-weighted images; and Bottom row: T1-weighted images. Sections are taken from posterior (left) to anterior (right). RED = abnormal white matter; BLUE = CSF; LIGHT GRAY = white matter; DARK GRAY = gray matter.
2.6. Statistical analysis
Volumetric measures were log-transformed to symmetrize the distributions and stabilize the variances; due to non-normal distributions, LDL, HDL, and CRP also were log-transformed.
2.6.1. Non-twin analyses
We employed linear mixed effects models with fixed effects of scanner (Barnes et al., 2010, Fennema-Notestine et al., 2007) and age. To adjust for the non-independence of twins within pairs, the “family ID” of each twin pair was entered as a random effect. When using volumes, the log of the total intracranial vault (ICV) volume was included as a fixed effect to adjust for individual differences in head size. Statistical effects are reported for t and p values associated with parameter estimates from the models, with an alpha level of 0.05.
AWM was examined both as a proportion of total white matter (i.e., how much of the white matter was abnormal) and as a total volume; reported values are for the proportion of AWM unless otherwise noted. We estimated the association between AWM and hypertension status at Wave 2 (n = 373). In a second model, we added ε4 status and a hypertension HTN × ε4 status interaction; 9 cases were excluded because ApoE information was not available. Finally, we explored the impact of duration of hypertension (normotensive, longer, or more recent) and the effectiveness of controlling hypertension (controlled, uncontrolled) on AWM using the subset of available Wave 1 individuals (n = 297).
2.6.2. Twin analyses
We fit univariate biometrical (ACE) models to AWM and total white matter; measures were adjusted for age, scanner and, for volumes only, ICV. In the twin design the variance of a phenotype is decomposed into the proportion attributed to additive genetic (A), common environmental (C), and unique environmental (E) influences (Eaves et al., 1978, Neale and Cardon, 1992). Additive genetic influences are assumed to correlate 1.0 between MZ twins and 0.50 for DZ twins. Shared environment is assumed to correlate 1.0, and unique environmental influences are uncorrelated between the members of a twin pair. The proportion of variance attributable to additive genetic influences is the heritability.
To examine the interplay of AWM, SBP, and DBP, we performed a trivariate ACE model. This estimates genetic and environmental correlations between variables, or the degree of shared genetic and environmental variance. Continuous BP measures, rather than categorical hypertension status, were used to increase our power for detecting a genetic covariance. We used medication-corrected (Rana et al., 2014) BP estimates because medication may mask associations of hypertension with genetic status. These were calculated by leveraging data from the larger VETSA sample (n = 1237) (Rana et al., 2014). Twin analyses were performed using the maximum-likelihood based structural equation modeling software OpenMx (Boker et al., 2011, Neale et al., 2016).
3. Results
3.1. Frequency and distribution of AWM in midlife
The distribution of AWM across the entire sample was broad and skewed ranging from 0.1% to 16.6% of the white matter being abnormal (median = 0.9%, IQR = [0.5–1.8]). The percent of ICV volume accounted for by AWM ranged from 0.03% to 5.1% (median = 0.3%, IQR = [0.1–0.6]). Statistical analyses used the log-transformed variables for proportion of white matter that was abnormal to address the skewness of the data. AWM was broadly distributed, but most commonly located in periventricular regions and the deep white matter of the parietal and frontal lobes (Fig. 2).
Fig. 2.

Abnormal white matter frequency atlas. The spatial distribution and most common areas of AWM are shown overlaid on an averaged T1. High to low frequency ranged from 0.76 (red) to 0.01 (dark blue) of the sample with AWM in a given voxel. Top row: three coronal sections from posterior to anterior (left to right). Bottom row includes one axial (left) and one sagittal (right) view. Voxels displayed were designated as AWM with minimum threshold of 0.01 (n = 4). (For interpretation of the references to color in this figure legend, the reader is referred to the web version of this article.)
3.2. Effects of hypertension and ApoE-ε4 status
Of the 373 participants, 250 (67%) were hypertensive at Wave 2 (Table 1). Individuals with hypertension had a larger proportion of AWM (t = 2.9, p = 0.004; Fig. 3A) and a greater volume of AWM (t = 3.0, p = 0.003). The proportion of AWM for hypertensive individuals ranged from 0.1% to 16.6% (median = 1.0%, IQR = [0.5%–1.9%]), relative to normotensives who ranged from 0.1% to 5.1% (median = 0.7%, IQR = [0.4%–1.7%]). For additional reference, the distribution of log-transformed raw (uncorrected) AWM volumes by group is presented in Supplementary Fig. S1. Individuals with hypertension had smaller gray matter volumes (t = − 3.3, p = 0.001), but total white matter volume was not different by hypertension status (t < 1.0), and CSF volume only tended to be different (t = 1.9, p = 0.06). Even within this restricted age range (56–66), older age also was subtly associated with more AWM in the full model (t = 1.9, p = 0.05; Spearman's ρ = 0.08), with less gray matter (t = − 3.8, p = 0.0002) and more CSF (t = 4.6, p = 0.0001). Age only tended to be related to total white matter (t = − 1.9, p = 0.06). There was no effect of or interaction with ApoE-ε4 status for any measures (all t ≤ 1; for ApoE group characteristics, see Supplementary Table S1). Hypertensive and normotensive groups did not differ on age, ApoE-ε4 allele status, or HDL levels; however, individuals with hypertension had significantly higher BMI and CRP levels, as well as lower LDL and a higher prevalence of diabetes (Table 1).
Table 1.
Demographic and health characteristics of Wave 2 hypertensive sample.
| Wave 2 hypertension |
Group difference t |
||
|---|---|---|---|
| No (n = 123) |
Yes (n = 250) |
||
| Age, yrs | 62.0 (2.6) | 61.7 (2.6) | 0.9ns |
| BMI | 26.9 (3.9) | 29.3 (4.0) | − 5.5*** |
| SBP | 120.1 (9.3) | 132.1 (16.8) | − 7.4*** |
| DBP | 74.7 (6.2) | 80.4 (9.6) | − 6.0*** |
| HDL | 51 (15) | 49 (14) | 1.6 ns |
| LDL | 120 (37) | 102 (31) | 4.4*** |
| CRP | 1.6 (1.7) | 2.3 (2.2) | − 4.2*** |
| HTN meds | – | 69% | |
| Diabetes | 6% (7) | 18% (45) | X2 = 12*** |
| ApoE-ε4 | 25% (31) | 22% (55) | X2 = 0.9ns |
Values are mean and (SD) unless otherwise specified. yrs = years; BMI = body mass index; HDL = high density lipoprotein; LDL = low density lipoprotein; CRP = C-reactive protein; HTN Meds = antihypertensive medication; ApoE = apolipoprotein E. t value: ns = not significant; *p < 0.05; **p < 0.01; ***p < 0.001.
Fig. 3.
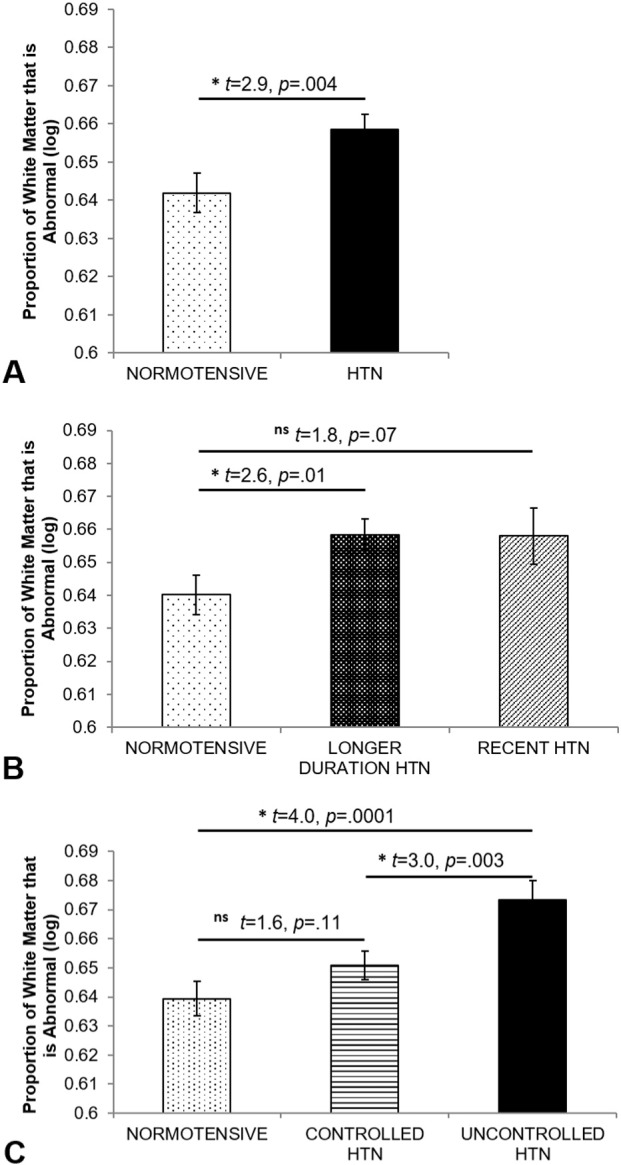
Abnormal white matter by A) hypertension status, B) duration of hypertension, and C) control of hypertension. Values reflect estimated marginal means and standard error bars from the full models using the log transformed data to control for the influence of scanner, age, and the non-independence of the twin sample.
Supplementary Fig. S1.
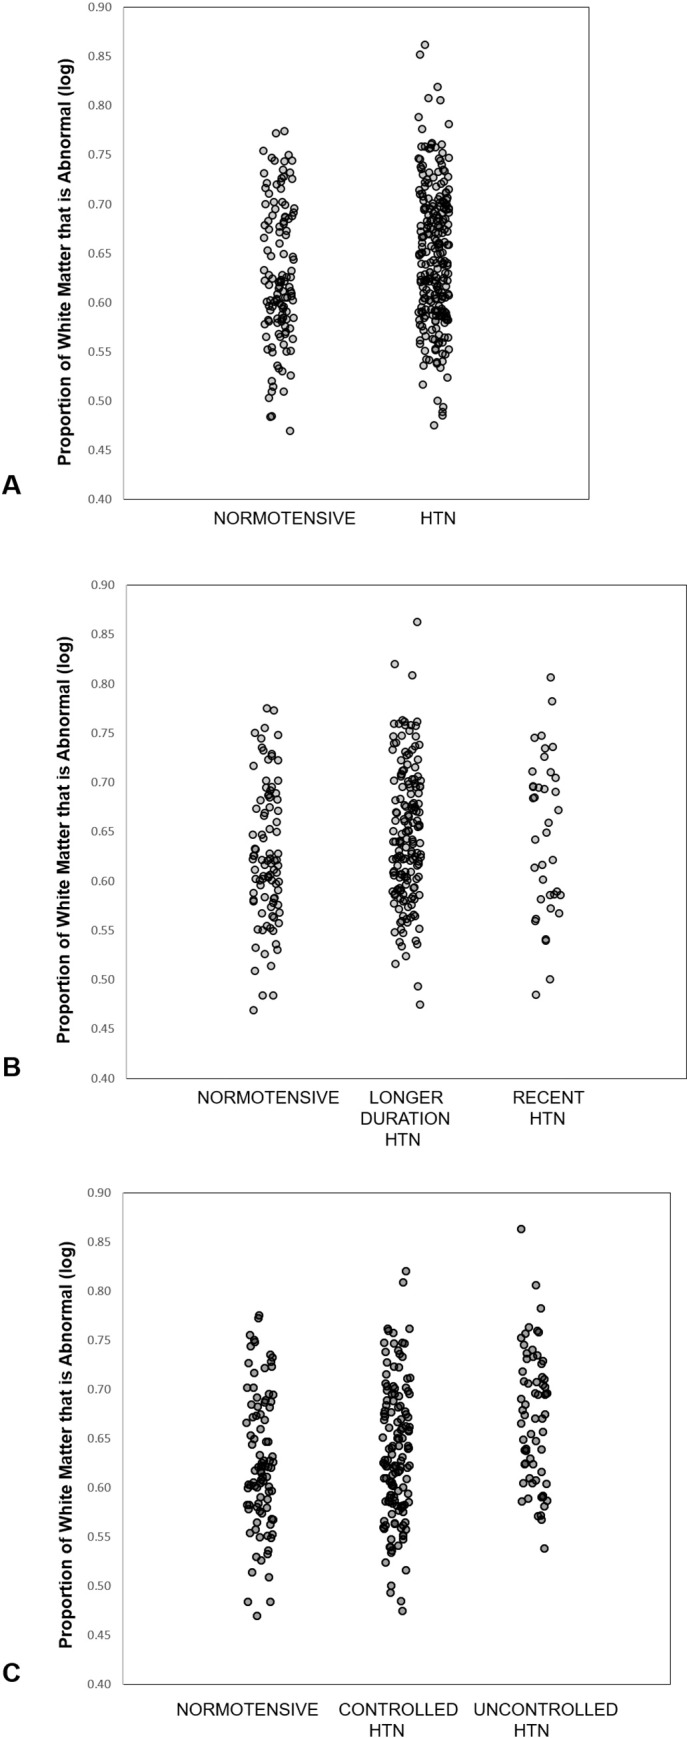
Scatterplots of proportion of white matter that is
abnormal by A) hypertension status, B) duration of hypertension, and C)
control of hypertension. Values reflect log transformed raw data without
controlling for other influences.
3.3. Duration and control of hypertension
Of the 204 hypertensive individuals with data available in Wave 1, 81% had longer duration hypertension and 19% had more recent onset hypertension (Table 2). The longer duration group had more AWM relative to the normotensive group (t = 2.6, p = 0.01; Fig. 3B). There was a trend for the recent group to have more AWM than the normotensive group (t = 1.8, p = 0.07), although the recent and longer duration groups did not differ (t < 1.0, p = 0.97) (Fig. 3B). The longer duration and recent onset groups did not differ significantly on HDL, ApoE-ε4 status, or age, although the longer duration group tended to be older than the recent group (t = 2.3, p = 0.06) (Table 2). The longer duration group had higher BMI relative to normotensives, and both hypertension groups had lower LDL and higher CRP levels as well as a higher prevalence of diabetes, but were not different from each other on these measures. Hypertension groups did not differ on anti-hypertensive medications, controlled hypertension, or diabetes.
Table 2.
Demographic and health characteristics of hypertension duration groups.
| Normotensive (n = 93) |
Recent (n = 38) |
Longer (n = 166) |
Group differences | |
|---|---|---|---|---|
| Age, yrs | 61.9 (2.6) | 60.1 (2.7) | 62.0 (2.5) | – |
| BMI | 26.8 (4.0) | 28.2 (4.7) | 29.3 (3.9) | Longer > Norm⁎⁎⁎ |
| SBP | 118.8 (8.9) | 130.1 (15.3) | 132.2 (17.4) | Longer and Recent > Norm⁎⁎⁎ |
| DBP | 74.1 (6.5) | 79.5 (10.2) | 80.5 (9.6) | Longer and Recent > Norm⁎⁎ |
| HDL | 52 (14) | 45 (9) | 50 (15) | – |
| LDL | 120 (40) | 99 (31) | 103 (33) | Norm > Longer and Recent⁎⁎ |
| CRP | 1.5 (1.7) | 2.9 (2.8) | 2.2 (2.1) | Longer and Recent > Norm⁎⁎ |
| HTN meds | – | 60% | 72% | – |
| Diabetes | 5% | 26% | 17% | Longer and Recent > Norm⁎⁎ |
| ApoE-ε4 | 27% | 29% | 22%⁎ | – |
Values are mean and (SD) unless otherwise specified. yrs = years; BMI = body mass index; HDL = high density lipoprotein; LDL = low density lipoprotein; CRP = C-reactive protein; HTN Meds = antihypertensive medication; ApoE = apolipoprotein E. t value: *p < 0.05; **p < 0.01; ***p < 0.001.
Of these same 204 individuals, 68% had controlled hypertension and 32% had uncontrolled hypertension at Wave 2 (Table 3). The uncontrolled hypertension group had more AWM than the controlled (t = 3.0, p = 0.003) and normotensive groups (t = 4.0, p = 0.0001); the controlled group did not differ from the normotensive group (t = 1.6, p = 0.11; Fig. 3C). The uncontrolled group had higher BMI relative to the controlled and normotensive groups, while the hypertension groups did not differ on age, HDL, LDL, CRP, or ApoE-ε4 status (Table 3). The controlled group had more individuals on hypertension medications and more with diabetes, but did not differ from uncontrolled on proportion of longer duration hypertension. Relative to the normotensive group, the controlled group had higher BMI, SBP, and CRP as well as a higher incidence of diabetes.
Table 3.
Demographic and health characteristics of hypertension control groups.
| Normotensive (n = 93) |
Controlled (n = 138) |
Uncontrolled (n = 66) |
Group differences | |
|---|---|---|---|---|
| Age, yrs | 61.9 (2.6) | 62.0 (2.5) | 61.3 (2.6) | – |
| BMI | 26.8 (4.0) | 28.6 (4.1) | 30.1 (3.9) | N < C⁎⁎ < U⁎ |
| SBP | 118.8 (8.9) | 122.8 (10.2) | 150.7 (12.4) | N < C⁎ < U⁎⁎⁎ |
| DBP | 74.1 (6.5) | 75.9 (7.1) | 89.4 (7.8) | N = C < U⁎⁎⁎ |
| HDL | 52 (14) | 49 (15) | 49 (13) | – |
| LDL | 120 (40) | 99 (32) | 110 (31) | N > C⁎⁎ = U |
| CRP | 1.5 (1.7) | 2.3 (2.4) | 2.4 (2.2) | N < C⁎⁎ = U |
| HTN meds | – | 80% | 47% | C > U⁎⁎⁎ |
| Diabetes | 5% | 24% | 10% | C > U⁎,N⁎⁎⁎ |
| ApoE-ε4 | 27% | 25% | 20% | – |
Values are mean and (SD) unless otherwise specified. yrs = years; BMI = body mass index; HDL = high density lipoprotein; LDL = low density lipoprotein; CRP = C-reactive protein; HTN Meds = antihypertensive medication; ApoE = apolipoprotein E. t value: ⁎p < 0.05; ⁎⁎p < 0.01; ⁎⁎⁎p < 0.001.
3.4. Heritability of abnormal white matter
AWM showed strong genetic influences (heritability = 0.81) (a2 in Table 4); unique environmental influences (e2) accounted for approximately 19% of the variance. Common environmental influences (c2) did not significantly contribute to the model.
Table 4.
Univariate twin model fitting results for white matter measures.
| Model fit |
Standardized variance components |
|||||||
|---|---|---|---|---|---|---|---|---|
| Phenotype | rMZ | rDZ | − 2LL | LRT | p | a2 (95% CI) | c2 (95% CI) | e2 (95% CI) |
| Proportion of AWMa | 0.85 | 0.34 | 1004.31 | 5.67 | 0.4609 | 0.81 (0.61; 0.86) | 0.00 (0.00; 0.19) | 0.19 (0.14; 0.26) |
| AWMa,b | 0.85 | 0.34 | 1003.26 | 5.88 | 0.4362 | 0.81 (0.61; 0.87) | 0.00 (0.00; 0.19) | 0.19 (0.13; 0.26) |
| Total white mattera,b | 0.83 | 0.40 | 1004.33 | 3.54 | 0.7387 | 0.85 (0.62; 0.89) | 0.00 (0.00; 0.22) | 0.15 (0.11; 0.22) |
rMZ = monozygotic and rDZ = dizygotic twin correlations. − 2LL = Negative 2 log-likelihood; LRT = Likelihood ratio test; a2 = Additive genetic, c2 = Common/Shared environmental, and e2 = Unique environmental influences; CI = confidence intervals. aAdjusted for scanner and age; bAlso adjusted for ICV.
3.5. Genetic associations between AWM and BP
In the full trivariate model, the heritability of SBP was 0.44 and that of DBP was 0.46 (Table 5); AWM heritability was similar to that found in the univariate model (a2 = 0.80). Unique environmental influences accounted for the remaining variances. Significant phenotypic correlations (rP) with AWM were demonstrated for both SBP (0.18) and DBP (0.12); the majority of these correlations could be attributed to shared genetic influences for SBP (86.7%) and DBP (72.7%). A significant genetic correlation was observed between AWM and SBP (rA = 0.26), but not for DBP.
Table 5.
Trivariate twin model fitting results for AWM, SBP, and DBP.
| Standardized variance components |
Correlation with proportion of AWM |
|||||
|---|---|---|---|---|---|---|
| a2 | c2 | e2 | rP | rA | rE | |
| SBPa,b | 0.44 (0.20; 0.54) | 0.01 (0.00; 0.21) | 0.54 (0.46; 0.63) | 0.18 (0.07; 0.28) | 0.26 (0.02; 0.71) | 0.11 (− 0.09; 0.31) |
| DBPa,b | 0.46 (0.24; 0.55) | 0.01 (0.00; 0.19) | 0.52 (0.45; 0.61) | 0.12 (0.01; 0.22) | 0.14 (− 0.08; 0.52) | 0.14 (− 0.05; 0.31) |
| Proportion of AWMc | 0.80 (0.56; 0.86) | 0.01 (0.00; 0.23) | 0.19 (0.14; 0.27) | – | – | – |
a2 = Additive genetic, c2 = Common/Shared environmental, and e2 = Unique environmental influences. rP = phenotypic, rA = genetic, rE = unique environmental correlations. 95% confidence intervals in parentheses. a BP estimates were medication corrected (Rana et al., 2014). b BP estimation includes non-MRI participants (Rana et al., 2014). c Adjusted for scanner and age.
4. Discussion
The present study provides a phenotypic and genetic characterization of white matter disease in a community-based middle-aged cohort of men. The presence of abnormalities was clear, most commonly in the periventricular regions and the deep white matter of the parietal and frontal lobes. Even within this narrow midlife age range (56–66 years), the amount of AWM increased with age. AWM was related to hypertension and more evident in individuals who had uncontrolled hypertension. There was no apparent effect of ApoE-ε4 status. AWM was highly heritable in this midlife sample and genetic overlap was demonstrated between AWM and SBP but not DBP. There also were independent unique genetic and environmental influences on AWM.
The extent and distribution of AWM in this large midlife male sample appears to fall on the cusp of normal age-related increases and in a pattern similar to studies of older adults. Direct comparisons of the amount of AWM to existing literature are challenging due to varied methods [e.g., ratings (Hopkins et al., 2006); segmentation (Jernigan et al., 2001); MRI sequences (Raz et al., 2012)], and statistical reports of different metrics, often averaging across broad age ranges. With these challenges in mind, our overall AWM raw volume (mean = 6843 mm3; median = 3803 mm3) falls above a reported mean averaged across the age range of 34–88 years (mean age = 60.7; mean = 940 mm3) in a study using a relatively similar T2/PD segmentation approach (n = 626 men) (Atwood et al., 2004), as would be expected given the inclusion of many younger individuals who likely have no measurable AWM. Our AWM volume was slightly above a reported mean in 144 individuals ages 44–77 years (mean age = 58.9; 46 men; mean = 5533 mm3), although this study relied on manual tracing of FLAIR images (Raz et al., 2012). Finally, our AWM volume as a percentage of ICV (mean = 0.47%, range 0.03%–5.1%) can be cautiously interpreted as falling within linear estimates proportionalized to the smaller supratentorial cranial vault (which would result in higher proportional estimates) for ages 30 (0.50%) and 90 (3.0%) (Jernigan et al., 2001).
The distribution of AWM was similar to that reported for older age in general, emphasizing periventricular regions and deep frontal and parietal white matter locations (Fig. 2) (de Leeuw et al., 2001, de Leeuw et al., 2002, Jernigan et al., 2001, Valdes Hernandez et al., 2014, Zhu et al., 2012). Periventricular white matter hyperintensities are common, as these are watershed zones of circulation (Awad et al., 1986b, Fazekas et al., 1993), and may be primarily vascular in nature (Awad et al., 1987, Fazekas et al., 1993, Wardlaw et al., 2013), although gliosis and myelin degeneration may be present (Awad et al., 1986a, Awad et al., 1987). Periventricular caps in particular have been shown to be of non-ischemic origin, associated with myelin pallor and dilated perivascular spaces, whereas punctate abnormalities can reflect ischemic tissue damage (Fazekas et al., 1993, Wardlaw et al., 2013). Deep white matter abnormalities included hyperintensities of presumed vascular origin, small subcortical infarcts and lacunes, some of which are thought to be associated with ischemic tissue damage ranging from mild perivascular alterations to large areas of fiber loss and arteriosclerosis (Kim et al., 2008, Wardlaw et al., 2013).
Hypertension was associated with more AWM even controlling for age. Poorly-controlled hypertension was clearly associated with more white matter damage, whereas well-controlled hypertension was associated with less apparent current damage. In contrast, our work using diffusion tensor imaging showed little effect of controlled hypertension on alterations of white matter microstructure (McEvoy et al., 2015). This might suggest that macrostructural AWM is more strongly associated with currently active cerebrovascular effects. Future longitudinal analyses will allow insight into whether some controlled hypertensives can return to more normal levels of brain integrity if hypertension is treated sufficiently early in the disease.
Although the proportion of AWM in the recent and longer duration hypertension groups was nearly identical, only the longer duration group had significantly more AWM relative to the normotensive group. Given the small sample size of the recent group (n = 38), the most parsimonious explanation may be that there was an effect of the presence, but not duration, of hypertension in this sample. Our diffusion study and previous work indicate similar findings, with no effect of duration within this time frame (McEvoy et al., 2015); however, a study of older adults (mean age = 83, SD = 2.8; n = 311) suggests that much longer duration of high and variable SBP was associated with worse white matter integrity (Rosano et al., 2015). These findings support a need for further study of more recent onset hypertensive individuals and longitudinal follow-up of VETSA participants to assess if longer duration is, in fact, associated with more AWM.
There was no effect of carrying the ε4 allele on AWM in this midlife sample. Another study with a broad age range also found no association (Hirono et al., 2000), although ε4 has been associated with more white matter disease in older individuals and Alzheimer's disease (Brickman et al., 2014). However, it remains possible that such effects are regionally specific, as suggested by a ratings-based study demonstrating more AWM only in subcortical regions for hypertensive ε4 carriers (de Leeuw et al., 2004), and by our diffusion study that reported an interaction between hypertension and ε4 status within the uncinate and inferior fronto-occipital fasciculi only (McEvoy et al., 2015).
The genetic influence on AWM is high. Heritability was similar in our middle-aged cohort (0.81) relative to the older NHLBI (Carmelli et al., 1998) (0.71) and OATS (Sachdev et al., 2013) (0.79) cohorts, and higher than the Framingham non-twin pedigree-based study across a wider age range (0.55) (Atwood et al., 2004). Although methodology is relevant in comparing across studies, as the imaging sequences used in segmentation varied, comparison to other studies may suggest an increase in the influence of genetic factors with increasing age. However, while AWM shared some genetic influences with SBP, no genetic correlation was evident for DBP, and there was evidence for the contribution of unique environmental and genetic influences independent from those associated with hypertension and blood pressure. Common environmental influences (c2) did not significantly contribute. Although exactly when common (shared) environment is most likely to influence the brain is not yet known, in most adult studies, there often is little to no indication of “C” effects with respect to MRI phenotypes (Blokland et al., 2012). Prior work in other research areas suggests that the influence of a common environment may diminish later in life when individuals have been living apart longer (Silventoinen et al., 2010, Sundet et al., 2008). Our sample of men in late middle age is relatively far removed from any common environmental influences, and they are at an age when measures of brain pathology may be more influenced by genetic and unique environmental factors.
Although the current study is limited in generalization, with a cohort that is solely male and largely Caucasian, the study's restriction to men in a narrow age range reduces variability that may be associated with age and gender in both prevalence and heritability of hypertension and age-associated white matter disease (Atwood et al., 2004, de Leeuw et al., 2001). Subgroup comparisons for duration of hypertension may be limited in power due to small sample sizes, requiring replication and follow-up.
5. Conclusions
In this midlife cohort in the midst of emerging hypertension, significant white matter abnormalities were evident, predominantly in periventricular regions and in deep parietal and frontal white matter. These abnormalities were associated with hypertension, particularly in individuals with uncontrolled hypertension. This suggests that AWM may reflect currently active cerebrovascular effects; future work will explore comparisons with microstructural measures of white matter disease (i.e., diffusion MRI) which may provide evidence for more permanent or longer-lasting white matter damage. Furthermore, while AWM was highly heritable and shared some genetic influences with SBP, no genetic correlation was evident for DBP. There was evidence for the contribution of unique environmental and genetic influences independent from those associated with BP. Given the importance of early identification and treatment of cardiovascular-related risk factors, research focused on individual differences and factors impacting white matter disease specifically in midlife is of importance.
The following are the supplementary data related to this article.
Demographic and health characteristics of Wave 2 ApoE-ε4 subsample by hypertension group.
Acknowledgments
Content of this manuscript is the responsibility of the authors and does not represent official views of NIA/NIH, or the Veterans' Administration. We gratefully acknowledge the continued cooperation of the twins and sincerely appreciate the assistance of the supporting staff and Lesley Wetherell.
Funding: This work was supported by grants from the National Institute on Aging [R01s AG018386, AG022381, AG022982 to W.S.K.; R01 AG018384 to M.J.L.; R03 AG 046413 to C.E.F; and K08 AG047903 to M.S.P] and the National Institute on Alcohol Abuse and Alcoholism [R01AA021187 to L.K.M.].
None of the authors have conflicts of interest or disclosures relevant to this manuscript.
References
- Atwood L.D., Wolf P.A., Heard-Costa N.L., Massaro J.M., Beiser A., D'Agostino R.B., DeCarli C. Genetic variation in white matter hyperintensity volume in the Framingham study. Stroke. 2004;35:1609–1613. doi: 10.1161/01.STR.0000129643.77045.10. [DOI] [PubMed] [Google Scholar]
- Avants B.B., Tustison N.J., Song G., Cook P.A., Klein A., Gee J.C. A reproducible evaluation of ANTs similarity metric performance in brain image registration. NeuroImage. 2011;54:2033–2044. doi: 10.1016/j.neuroimage.2010.09.025. [DOI] [PMC free article] [PubMed] [Google Scholar]
- Awad I.A., Johnson P.C., Spetzler R.F., Hodak J.A. Incidental subcortical lesions identified on magnetic resonance imaging in the elderly. II. Postmortem pathological correlations. Stroke. 1986;17:1090–1097. doi: 10.1161/01.str.17.6.1090. [DOI] [PubMed] [Google Scholar]
- Awad I.A., Spetzler R.F., Hodak J.A., Awad C.A., Carey R. Incidental subcortical lesions identified on magnetic resonance imaging in the elderly. I. Correlation with age and cerebrovascular risk factors. Stroke. 1986;17:1084–1089. doi: 10.1161/01.str.17.6.1084. [DOI] [PubMed] [Google Scholar]
- Awad I.A., Spetzler R.F., Hodak J.A., Awad C.A., Williams F., Jr., Carey R. Incidental lesions noted on magnetic resonance imaging of the brain: prevalence and clinical significance in various age groups. Neurosurgery. 1987;20:222–227. doi: 10.1227/00006123-198702000-00004. [DOI] [PubMed] [Google Scholar]
- Barnes J., Ridgway G.R., Bartlett J., Henley S.M., Lehmann M., Hobbs N., Clarkson M.J., MacManus D.G., Ourselin S., Fox N.C. Head size, age and gender adjustment in MRI studies: a necessary nuisance? NeuroImage. 2010;53:1244–1255. doi: 10.1016/j.neuroimage.2010.06.025. [DOI] [PubMed] [Google Scholar]
- Bigler E.D., Kerr B., Victoroff J., Tate D.F., Breitner J.C. White matter lesions, quantitative magnetic resonance imaging, and dementia. Alzheimer Dis. Assoc. Disord. 2002;16:161–170. doi: 10.1097/00002093-200207000-00006. [DOI] [PubMed] [Google Scholar]
- Blokland G.A.M., de Zubicaray G.I., McMahon K.L., Wright M.J. Genetic and environmental influences on neuroimaging phenotypes: a meta-analytical perspective on twin imaging studies. Twin research and human genetics: the official journal of the International Society for Twin Studies. 2012;15:351–371. doi: 10.1017/thg.2012.11. [DOI] [PMC free article] [PubMed] [Google Scholar]
- Boker S., Neale M., Maes H., Wilde M., Spiegel M., Brick T., Spies J., Estabrook R., Kenny S., Bates T., Mehta P., Fox J. OpenMx: an open source extended structural equation modeling framework. Psychometrika. 2011;76:306–317. doi: 10.1007/s11336-010-9200-6. [DOI] [PMC free article] [PubMed] [Google Scholar]
- Brickman A.M., Schupf N., Manly J.J., Stern Y., Luchsinger J.A., Provenzano F.A., Narkhede A., Razlighi Q., Collins-Praino L., Artero S., Akbaraly T.N., Ritchie K., Mayeux R., Portet F. APOE epsilon4 and risk for Alzheimer's disease: do regionally distributed white matter hyperintensities play a role? Alzheimer's & Dementia: the Journal of the Alzheimer's Association. 2014;10:619–629. doi: 10.1016/j.jalz.2014.07.155. [DOI] [PMC free article] [PubMed] [Google Scholar]
- Carmelli D., DeCarli C., Swan G.E., Jack L.M., Reed T., Wolf P.A., Miller B.L. Evidence for genetic variance in white matter hyperintensity volume in normal elderly male twins. Stroke. 1998;29:1177–1181. doi: 10.1161/01.str.29.6.1177. [DOI] [PubMed] [Google Scholar]
- de Leeuw F.E., de Groot J.C., Achten E., Oudkerk M., Ramos L.M., Heijboer R., Hofman A., Jolles J., van Gijn J., Breteler M.M. Prevalence of cerebral white matter lesions in elderly people: a population based magnetic resonance imaging study. The Rotterdam scan study. J. Neurol. Neurosurg. Psychiatry. 2001;70:9–14. doi: 10.1136/jnnp.70.1.9. [DOI] [PMC free article] [PubMed] [Google Scholar]
- de Leeuw F.E., de Groot J.C., Oudkerk M., Witteman J.C.M., Hofman A., van Gijn J., Breteler M.M. Hypertension and cerebral white matter lesions in a prospective cohort study. Brain. 2002;125:765–772. doi: 10.1093/brain/awf077. [DOI] [PubMed] [Google Scholar]
- de Leeuw F.E., Richard F., de Groot J.C., van Duijn C.M., Hofman A., Van Gijn J., Breteler M.M. Interaction between hypertension, apoE, and cerebral white matter lesions. Stroke. 2004;35:1057–1060. doi: 10.1161/01.STR.0000125859.71051.83. [DOI] [PubMed] [Google Scholar]
- DeCarli C., Reed T., Miller B.L., Wolf P.A., Swan G.E., Carmelli D. Impact of apolipoprotein E epsilon4 and vascular disease on brain morphology in men from the NHLBI twin study. Stroke. 1999;30:1548–1553. doi: 10.1161/01.str.30.8.1548. [DOI] [PubMed] [Google Scholar]
- Eaves L.J., Last K.A., Young P.A., Martin N.G. Model-fitting approaches to the analysis of human behavior. Heredity. 1978;41:249–320. doi: 10.1038/hdy.1978.101. [DOI] [PubMed] [Google Scholar]
- Emi M., Wu L.L., Robertson M.A., Myers R.L., Hegele R.A., Williams R.R., White R., Lalouel J.M. Genotyping and sequence analysis of apolipoprotein E isoforms. Genomics. 1988;3:373–379. doi: 10.1016/0888-7543(88)90130-9. [DOI] [PubMed] [Google Scholar]
- Fazekas F., Kleinert R., Offenbacher H., Schmidt R., Kleinert G., Payer F., Radner H., Lechner H. Pathologic correlates of incidental MRI white matter signal hyperintensities. Neurology. 1993;43:1683–1689. doi: 10.1212/wnl.43.9.1683. [DOI] [PubMed] [Google Scholar]
- Fennema-Notestine C., Gamst A.C., Quinn B.T., Pacheco J., Jernigan T.L., Thal L., Buckner R., Killiany R., Blacker D., Dale A.M., Fischl B., Dickerson B., Gollub R.L. Feasibility of multi-site clinical structural neuroimaging studies of aging using legacy data. Neuroinformatics. 2007;5:235–245. doi: 10.1007/s12021-007-9003-9. [DOI] [PubMed] [Google Scholar]
- Fennema-Notestine C., Ellis R.J., Archibald S.L., Jernigan T.L., Letendre S.L., Notestine R.J., Taylor M.J., Theilmann R.J., Julaton M.D., Croteau D.J., Wolfson T., Heaton R.K., Gamst A.C., Franklin D.R., Jr., Clifford D.B., Collier A.C., Gelman B.B., Marra C., McArthur J.C., McCutchan J.A., Morgello S., Simpson D.M., Grant I., the CHARTER Group Increases in brain white matter abnormalities and subcortical gray matter are linked to CD4 recovery in HIV infection. J. Neurovirol. 2013;19:393–401. doi: 10.1007/s13365-013-0185-7. [DOI] [PMC free article] [PubMed] [Google Scholar]
- Fonov V., Evans A.C., Botteron K., Almli C.R., McKinstry R.C., Collins D.L. Unbiased average age-appropriate atlases for pediatric studies. NeuroImage. 2011;54:313–327. doi: 10.1016/j.neuroimage.2010.07.033. Atlas: http://www.bic.mni.mcgill.ca/ServicesAtlases/ICBM152NLin2009. [DOI] [PMC free article] [PubMed] [Google Scholar]
- Goldberg J., Curran B., Vitek M.E., Henderson W.G., Boyko E.J. The Vietnam era twin registry. Twin Res. Hum. Genet. 2002;5:476–481. doi: 10.1375/136905202320906318. [DOI] [PubMed] [Google Scholar]
- Gunning-Dixon F.M., Raz N. The cognitive correlates of white matter abnormalities in normal aging: a quantitative review. Neuropsychology. 2000;14:224–232. doi: 10.1037//0894-4105.14.2.224. [DOI] [PubMed] [Google Scholar]
- Gunning-Dixon F.M., Brickman A.M., Cheng J.C., Alexopoulos G.S. Aging of cerebral white matter: a review of MRI findings. Int. J. Geriatr. Psychiatry. 2009;24:109–117. doi: 10.1002/gps.2087. [DOI] [PMC free article] [PubMed] [Google Scholar]
- Hirono N., Yasuda M., Tanimukai S., Kitagaki H., Mori E. Effect of the apolipoprotein E epsilon4 allele on white matter hyperintensities in dementia. Stroke. 2000;31:1263–1268. doi: 10.1161/01.str.31.6.1263. [DOI] [PubMed] [Google Scholar]
- Hixson J.E., Vernier D.T. Restriction isotyping of human apolipoprotein E by gene amplification and cleavage with HhaI. J. Lipid Res. 1990;31:545–548. [PubMed] [Google Scholar]
- Hopkins R.O., Beck C.J., Burnett D.L., Weaver L.K., Victoroff J., Bigler E.D. Prevalence of white matter hyperintensities in a young healthy population. J. Neuroimaging. 2006;16:243–251. doi: 10.1111/j.1552-6569.2006.00047.x. [DOI] [PubMed] [Google Scholar]
- Hottenga J.J., Boomsma D.I., Kupper N., Posthuma D., Snieder H., Willemsen G., de Geus E.J. Heritability and stability of resting blood pressure. Twin Res. Hum. Genet. 2005;8:499–508. doi: 10.1375/183242705774310123. [DOI] [PubMed] [Google Scholar]
- Jernigan T.L., Archibald S.L., Fennema-Notestine C., Gamst A.C., Stout J.C., Bonner J., Hesselink J.R. Effects of age on tissues and regions of the cerebrum and cerebellum. Neurobiol. Aging. 2001;22:581–594. doi: 10.1016/s0197-4580(01)00217-2. [DOI] [PubMed] [Google Scholar]
- Jernigan T.L., Archibald S.L., Fennema-Notestine C., Taylor M.J., Theilmann R.J., Julaton M.D., Notestine R.J., Wolfson T., Letendre S.L., Ellis R.J., Heaton R.K., Gamst A.C., Franklin D.R., Jr., Clifford D.B., Collier A.C., Gelman B.B., Marra C., McArthur J.C., McCutchan J.A., Morgello S., Simpson D.M., Grant I., the CHARTER Group Clinical factors related to brain structure in HIV: the CHARTER study. J. Neurovirol. 2011;17:248–257. doi: 10.1007/s13365-011-0032-7. [DOI] [PMC free article] [PubMed] [Google Scholar]
- Kalmijn S., Feskens E.J., Launer L.J., Kromhout D. Cerebrovascular disease, the apolipoprotein e4 allele, and cognitive decline in a community-based study of elderly men. Stroke. 1996;27:2230–2235. doi: 10.1161/01.str.27.12.2230. [DOI] [PubMed] [Google Scholar]
- Kim K.W., MacFall J.R., Payne M.E. Classification of white matter lesions on magnetic resonance imaging in elderly persons. Biol. Psychiatry. 2008;64:273–280. doi: 10.1016/j.biopsych.2008.03.024. [DOI] [PMC free article] [PubMed] [Google Scholar]
- Knopman D.S., Penman A.D., Catellier D.J., Coker L.H., Shibata D.K., Sharrett A.R., Mosley T.H., Jr. Vascularrisk factors and longitudinal changes on brain MRI: the ARIC study. Neurology. 2011;76:1879–1885. doi: 10.1212/WNL.0b013e31821d753f. [DOI] [PMC free article] [PubMed] [Google Scholar]
- Kochunov P., Glahn D., Winkler A., Duggirala R., Olvera R.L., Cole S., Dyer T.D., Almasy L., Fox P.T., Blangero J. Analysis of genetic variability and whole genome linkage of whole-brain, subcortical, and ependymal hyperintense white matter volume. Stroke. 2009;40:3685–3690. doi: 10.1161/STROKEAHA.109.565390. [DOI] [PMC free article] [PubMed] [Google Scholar]
- Kochunov P., Glahn D., Lancaster J., Winkler A., Kent J.W., Jr., Olvera R.L., Cole S.A., Dyer T.D., Almasy L., Duggirala R., Fox P.T., Blangero J. Whole brain and regional hyperintense white matter volume and blood pressure: overlap of genetic loci produced by bivariate, whole-genome linkage analyses. Stroke. 2010;41:2137–2142. doi: 10.1161/STROKEAHA.110.590943. [DOI] [PMC free article] [PubMed] [Google Scholar]
- Kochunov P., Glahn D.C., Lancaster J., Winkler A., Karlsgodt K., Olvera R.L., Curran J.E., Carless M.A., Dyer T.D., Almasy L., Duggirala R., Fox P.T., Blangero J. Blood pressure and cerebral white matter share common genetic factors in Mexican Americans. Hypertension. 2011;57:330–335. doi: 10.1161/HYPERTENSIONAHA.110.162206. [DOI] [PMC free article] [PubMed] [Google Scholar]
- Kremen W.S., Thompson-Brenner H., Leung Y.J., Grant M.D., Franz C.E., Eisen S.A., Jacobson K.C., Boake C., Lyons M.J. Genes, environment, and time: the Vietnam Era Twin Study of Aging (VETSA) Twin Res. Hum. Genet. 2006;9:1009–1022. doi: 10.1375/183242706779462750. [DOI] [PubMed] [Google Scholar]
- Kremen W.S., Prom-Wormley E., Panizzon M.S., Eyler L.T., Fischl B., Neale M.C., Franz C.E., Lyons M.J., Pacheco J., Perry M.E., Stevens A., Schmitt J.E., Grant M.D., Seidman L.J., Thermenos H.W., Tsuang M.T., Eisen S.A., Dale A.M., Fennema-Notestine C. Genetic and environmental influences on the size of specific brain regions in midlife: the VETSA MRI study. NeuroImage. 2010;49:1213–1223. doi: 10.1016/j.neuroimage.2009.09.043. [DOI] [PMC free article] [PubMed] [Google Scholar]
- Kremen W.S., Panizzon M.S., Neale M.C., Fennema-Notestine C., Prom-Wormley E., Eyler L.T., Stevens A., Franz C.E., Lyons M.J., Grant M.D., Jak A.J., Jernigan T.L., Xian H., Fischl B., Thermenos H.W., Seidman L.J., Tsuang M.T., Dale A.M. Heritability of brain ventricle volume: converging evidence from inconsistent results. Neurobiol. Aging. 2012;33:1–8. doi: 10.1016/j.neurobiolaging.2010.02.007. [DOI] [PMC free article] [PubMed] [Google Scholar]
- Kremen W.S., Fennema-Notestine C., Eyler L.T., Panizzon M.S., Chen C.H., Franz C.E., Lyons M.J., Thompson W.K., Dale A.M. Genetics of brain structure: contributions from the Vietnam Era Twin Study of Aging. Am. J. Med. Genet. B Neuropsychiatr. Genet. 2013;162:751–761. doi: 10.1002/ajmg.b.32162. [DOI] [PMC free article] [PubMed] [Google Scholar]
- Liao D., Cooper L., Cai J., Toole J., Bryan N., Burke G., Shahar E., Nieto J., Mosley T., Heiss G. The prevalence and severity of white matter lesions, their relationship with age, ethnicity, gender, and cardiovascular disease risk factors: the ARIC study. Neuroepidemiology. 1997;16:149–162. doi: 10.1159/000368814. [DOI] [PubMed] [Google Scholar]
- Maes F., Collignon A., Vandermeulen D., Marchal G., Suetens P. Multimodality image registration by maximization of mutual information. IEEE Trans. Med. Imaging. 1997;16:187–198. doi: 10.1109/42.563664. [DOI] [PubMed] [Google Scholar]
- McEvoy L.K., Fennema-Notestine C., Eyler L.T., Franz C.E., Hagler D.J., Jr., Lyons M.J., Panizzon M.S., Rinker D.A., Dale A.M., Kremen W.S. Hypertension-related alterations in white matter microstructure detectable in middle age. Hypertension. 2015;66:317–323. doi: 10.1161/HYPERTENSIONAHA.115.05336. [DOI] [PMC free article] [PubMed] [Google Scholar]
- Neale M.C., Cardon L.R. Kluwer Academic Publishers; Dordrecht, The Netherlands: 1992. Methodology for Genetic Studies of Twins and Families. [Google Scholar]
- Neale M.C., Hunter M.D., Pritikin J.N., Zahery M., Brick T.R., Kirkpatrick R.M., Estabrook R., Bates T.C., Maes H.H., Boker S.M. OpenMx 2.0: extended structural equation and statistical modeling. Psychometrika. 2016;81:535–549. doi: 10.1007/s11336-014-9435-8. [DOI] [PMC free article] [PubMed] [Google Scholar]
- No Authors Listed Heritability of blood pressure. Br. Med. J. 1978;1:127–128. [PMC free article] [PubMed] [Google Scholar]
- Qiu C., Winblad B., Fratiglioni L. The age-dependent relation of blood pressure to cognitive function and dementia. Lancet Neurol. 2005;4:487–499. doi: 10.1016/S1474-4422(05)70141-1. [DOI] [PubMed] [Google Scholar]
- Rana B.K., Dhamija A., Panizzon M.S., Spoon K.M., Vasilopoulos T., Franz C.E., Grant M.D., Jacobson K.C., Kim K., Lyons M.J., McCaffery J.M., Stein P.K., Xian H., O'Connor D.T., Kremen W.S. Imputing observed blood pressure for antihypertensive treatment: impact on population and genetic analyses. Am. J. Hypertens. 2014;27:828–837. doi: 10.1093/ajh/hpt271. [DOI] [PMC free article] [PubMed] [Google Scholar]
- Raz N., Yang Y., Dahle C.L., Land S. Volume of white matter hyperintensities in healthy adults: contribution of age, vascular risk factors, and inflammation-related genetic variants. Biochim. Biophys. Acta. 2012;1822:361–369. doi: 10.1016/j.bbadis.2011.08.007. [DOI] [PMC free article] [PubMed] [Google Scholar]
- Rosano C., Abebe K.Z., Aizenstein H.J., Boudreau R., Jennings J.R., Venkatraman V., Harris T.B., Yaffe K., Satterfield S., Newman A.B. Longitudinal systolic blood pressure characteristics and integrity of white matter tracts in a cohort of very old black and white adults. Am. J. Hypertens. 2015;28:326–334. doi: 10.1093/ajh/hpu134. [DOI] [PMC free article] [PubMed] [Google Scholar]
- Sachdev P.S., Lee T., Wen W., Ames D., Batouli A.H., Bowden J., Brodaty H., Chong E., Crawford J., Kang K., Mather K., Lammel A., Slavin M.J., Thalamuthu A., Trollor J., Wright M.J., the Oats Research Team The contribution of twins to the study of cognitive ageing and dementia: the Older Australian twins study. Int. Rev. Psychiatry (Abingdon, England) 2013;25:738–747. doi: 10.3109/09540261.2013.870137. [DOI] [PubMed] [Google Scholar]
- Schoenborn C.A., Heyman K.M. National Health Statistics Reports. 2009. Health characteristics of adults aged 55 years and over: United States, 2004–2007; pp. 1–31. [PubMed] [Google Scholar]
- Scott D. Parametric statistical modeling by minimum integrated square error. Technometrics. 2001;43:274–285. [Google Scholar]
- Silventoinen K., Rokholm B., Kaprio J., Sorensen T.I. The genetic and environmental influences on childhood obesity: a systematic review of twin and adoption studies. Int. J. Obes. (Lond) 2010;34:29–40. doi: 10.1038/ijo.2009.177. [DOI] [PubMed] [Google Scholar]
- Sled J.G., Zijdenbos A.P., Evans A.C. A nonparametric method for automatic correction of intensity nonuniformity in MRI data. IEEE Trans. Med. Imaging. 1998;17:87–97. doi: 10.1109/42.668698. [DOI] [PubMed] [Google Scholar]
- Sundet J.M., Eriksen W., Tambs K. Intelligence correlations between brothers decrease with increasing age difference: evidence for shared environmental effects in young adults. Psychol. Sci. 2008;19:843–847. doi: 10.1111/j.1467-9280.2008.02166.x. [DOI] [PubMed] [Google Scholar]
- Strassburger T.L., Lee H.C., Daly E.M., Szczepanik J., Krasuski J.S., Mentis M.J., Salerno J.A., DeCarli C., Schapiro M.B., Alexander G.E. Interactive effects of age and hypertension on volumes of brain structures. Stroke. 1997;28:1410–1417. doi: 10.1161/01.str.28.7.1410. [DOI] [PubMed] [Google Scholar]
- Swan G.E., DeCarli C., Miller B.L., Reed T., Wolf P.A., Jack L.M., Carmelli D. Association of midlife blood pressure to late-life cognitive decline and brain morphology. Neurology. 1998;51:986–993. doi: 10.1212/wnl.51.4.986. [DOI] [PubMed] [Google Scholar]
- Valdes Hernandez M.C., Piper R.J., Bastin M.E., Royle N.A., Maniega S.M., Aribisala B.S., Murray C., Deary I.J., Wardlaw J.M. Morphologic, distributional, volumetric, and intensity characterization of periventricular hyperintensities. Am. J. Neuroradiol. 2014;35:55–62. doi: 10.3174/ajnr.A3612. [DOI] [PMC free article] [PubMed] [Google Scholar]
- van Dijk E.J., Breteler M.M.B., Schmidt R., Berger K., Nilsson L.-G., Oudkerk M., Pajak A., Sans S., de Ridder M., Dufouil C., Fuhrer R., Giampaoli S., Launer L.J., Hofman A., the CASCADE Consortium The association between blood pressure, hypertension, and cerebral white matter lesions: cardiovascular determinants of dementia study. Hypertension. 2004;44:625–630. doi: 10.1161/01.HYP.0000145857.98904.20. [DOI] [PubMed] [Google Scholar]
- van Rijn M.J., Schut A.F., Aulchenko Y.S., Deinum J., Sayed-Tabatabaei F.A., Yazdanpanah M., Isaacs A., Axenovich T.I., Zorkoltseva I.V., Zillikens M.C., Pols H.A., Witteman J.C., Oostra B.A., van Duijn C.M. Heritability of blood pressure traits and the genetic contribution to blood pressure variance explained by four blood-pressure-related genes. J. Hypertens. 2007;25:565–570. doi: 10.1097/HJH.0b013e32801449fb. [DOI] [PubMed] [Google Scholar]
- Wardlaw J.M., Smith E.E., Biessels G.J., Cordonnier C., Fazekas F., Frayne R., Lindley R.I., O'Brien J.T., Barkhof F., Benavente O.R., Black S.E., Brayne C., Breteler M., Chabriat H., Decarli C., de Leeuw F.E., Doubal F., Duering M., Fox N.C., Greenberg S., Hachinski V., Kilimann I., Mok V., Oostenbrugge R., Pantoni L., Speck O., Stephan B.C., Teipel S., Viswanathan A., Werring D., Chen C., Smith C., van Buchem M., Norrving B., Gorelick P.B., Dichgans M., STandards for ReportIng Vascular changes on nEuroimaging (STRIVE v1) Neuroimaging standards for research into small vessel disease and its contribution to ageing and neurodegeneration. Lancet Neurol. 2013;12:822–838. doi: 10.1016/S1474-4422(13)70124-8. [DOI] [PMC free article] [PubMed] [Google Scholar]
- Yoo T.S., Ackerman M.J., Lorensen W.E., Schroeder W., Chalana V., Aylward S., Metaxas D., Whitaker R. Engineering and algorithm design for an image processing API: a technical report on ITK–the insight toolkit. Stud. Health Technol. Inform. 2002;85:586–592. [PubMed] [Google Scholar]
- Zhu Y.-C., Chabriat H., Godin O., Dufouil C., Rosand J., Greenberg S.M., Smith E.E., Tzourio C., Viswanathan A. Distribution of white matter hyperintensity in cerebral hemorrhage and healthy aging. J. Neurol. 2012;259:530–536. doi: 10.1007/s00415-011-6218-3. [DOI] [PMC free article] [PubMed] [Google Scholar]
Associated Data
This section collects any data citations, data availability statements, or supplementary materials included in this article.
Supplementary Materials
Demographic and health characteristics of Wave 2 ApoE-ε4 subsample by hypertension group.